


Next 24 hours: Positioning into mid-week event risk
Today’s report: Commodity currencies get boost from oil surge
We come into Tuesday with the US Dollar extending an impressive run against the Euro and Pound, while coming under mild pressure against most other currencies.
Wake-up call
- peak rates
- PMI reads
- YCC policy
- AUDUSD Aussie recovers as stocks turn higher
- surging oil
- key exports
- Inflation headache
- Dealers report
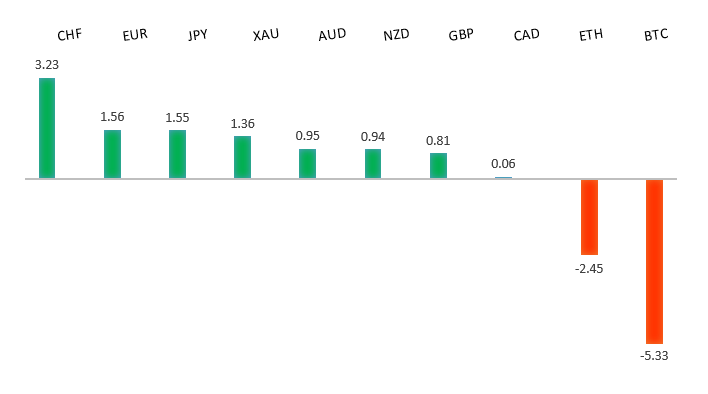
Peformance chart: 30 Day Performance vs. US dollar (%)
Suggested reading
- Forget 5 Months. Where Will Markets Be in 3, 7 or 10 Years?, J. Authers, Bloomberg (July 24, 2023)
- How Climate Friendly Innovations Can Cool Cities, L. Hook, Financial Times (July 24, 2023)
Chart talk: Technical & fundamental highlights
Choose pair:
EURUSD – technical overview
The Euro remains well supported on dips following a run to the topside through 1.1000 earlier this year. Any additional setbacks should be well supported ahead of 1.0500 in favor of a bullish continuation. Ultimately, only a monthly close back below 1.0500 would give reason for concern. Next key resistance comes in the form of the February 2022 high at 1.1496.EURUSD – fundamental overview
The Euro was dealt another blow on Monday, this time from a round of softer PMI reads out of Germany and the Eurozone. German manufacturing PMI reads crashed, while Eurozone and France reads slid deeper into contraction. Implied peak rates have been impacted as a consequence, sliding 10bps over the past several days. Implied peak rates now sit at 3.85%. Key standouts on Tuesday’s calendar come from German Ifo reads, UK CBI data, Canada manufacturing sales, US Case Shiller, US house prices, US consumer confidence, and Richmond Fed manufacturing.EURUSD - Technical charts in detail
GBPUSD – technical overview
Signs have emerged of the market wanting to put in a longer-term base after collapsing to a record low in September 2022. The November 2022 monthly close back above 1.2000 strengthens this prospect. Any setbacks should now be well supported ahead of 1.2000. Next key resistance comes in at 1.3500.GBPUSD – fundamental overview
Monday's PMI reads out of the UK weren't pretty and weighed on the Pound as a consequence. The composite PMI read slumped to the lowest level in 6 months, while the manufacturing PMI print was a lowly 45, trading to a post-pandemic low. Key standouts on Tuesday’s calendar come from German Ifo reads, UK CBI data, Canada manufacturing sales, US Case Shiller, US house prices, US consumer confidence, and Richmond Fed manufacturing.USDJPY – technical overview
The major pair has seen a nice recovery following the massive correction out from multi-year highs. Setbacks have finally been well supported ahead of 125.00 in the 127s thus far. At this stage, it looks like the market could be wanting to resume the bigger picture uptrend and head back towards a retest of that multi-year high from October 2022 up at 151.95. Look for any weakness to continue to be well supported ahead of 135.00 in favor of the next higher low.USDJPY – fundamental overview
There has been plenty of news in recent days backing up the view the BOJ is unlikely to shift YCC policy this week. All of this has led to a flood of renewed selling in the Yen. Key standouts on Tuesday’s calendar come from German Ifo reads, UK CBI data, Canada manufacturing sales, US Case Shiller, US house prices, US consumer confidence, and Richmond Fed manufacturing.AUDUSD – technical overview
There are signs of the potential formation of a longer-term base following the late 2022 surge back above 0.6500. Next key resistance comes in at 0.7284. Setbacks should continue to be well supported in the 0.6500 area. Only a monthly close below 0.6500 would give reason for rethink.AUDUSD – fundamental overview
The Australian Dollar took an early hit on Monday from a round of discouraging PMI reads that slipped into contractionary territory. However, setbacks were supported on help from a solid performance in US equities. Key standouts on Tuesday’s calendar come from German Ifo reads, UK CBI data, Canada manufacturing sales, US Case Shiller, US house prices, US consumer confidence, and Richmond Fed manufacturing.USDCAD – technical overview
Above 1.3000 signals an end to a period of longer-term bearish consolidation and suggests the market is in the process of carving out a more significant longer-term base. Next key resistance now comes in up into the 1.4000 area. Setbacks should be very well supported down into the 1.3000 area.USDCAD – fundamental overview
Monday's round of outperformance in the Canadian Dollar was mostly about the surging price of oil, though we also saw some gains from higher stocks. Key standouts on Tuesday’s calendar come from German Ifo reads, UK CBI data, Canada manufacturing sales, US Case Shiller, US house prices, US consumer confidence, and Richmond Fed manufacturing.NZDUSD – technical overview
Overall pressure remains on the downside with the market once again stalling out on a run up into the 0.6500 area. Ultimately, a break back above 0.6577 would be required to take the immediate pressure off the downside. A monthly close below 0.6000 would intensify bearish price action.NZDUSD – fundamental overview
The New Zealand Dollar held up well on Monday on account of higher US equities and an impressive jump in New Zealand key exports. Milk powder, butter and cheese exports were up 11%, while oil, iron and steel sales were also solid. Key standouts on Tuesday’s calendar come from German Ifo reads, UK CBI data, Canada manufacturing sales, US Case Shiller, US house prices, US consumer confidence, and Richmond Fed manufacturing.US SPX 500 – technical overview
Longer-term technical studies are in the process of unwinding from extended readings off record highs. Look for rallies to be well capped in favor of lower tops and lower lows. A monthly close back above 4600 will be required to take the immediate pressure off the downside. Next key support comes in at 4376.US SPX 500 – fundamental overview
We've finally reached a point in the cycle where the Fed recognizes unanchored inflation expectations pose a greater downside risk than over-tightening. This is significant, as it means less investor friendly monetary policy that risks potential recession in the months ahead. Overall, we expect inflation to continue to be a problem in 2023 that results in downside pressure into rallies despite market expectations that would argue otherwise.GOLD (SPOT) – technical overview
The 2019 breakout above the 2016 high at 1375 was a significant development, opening the door for fresh record highs. Setbacks should now be well supported above 1600 on a monthly close basis ahead of the next major upside extension. The recent break back above 1808 strengthens the bullish outlook. Next major resistance comes in at 2100, above which opens the next extension towards 2,500.GOLD (SPOT) – fundamental overview
The yellow metal continues to be well supported on dips with solid demand from medium and longer-term accounts. These players are more concerned about inflation risk and a less upbeat global growth outlook. All of this should keep the commodity well supported, with many market participants also fleeing to the hard asset as the grand dichotomy of record high equities and record low yields comes to an unnerving climax.