


Next 24 hours: Fear and uncertainty creep back in
Today’s report: Currencies extend rally after another discouraging round of US data
Another day and another round of softer US economic data, this time highlighted by a discouraging US ISM manufacturing print. The net result has been more selling of the US Dollar and more demand for stocks on the implication this will keep the Fed in an investor friendly monetary policy position.
Wake-up call
- German unemployment
- retail sales
- Yield differentials
- AUDUSD Iron ore sinks to lowest level in six weeks
- Oil slumps
- GDT auction
- Fed outlook
- Macro themes
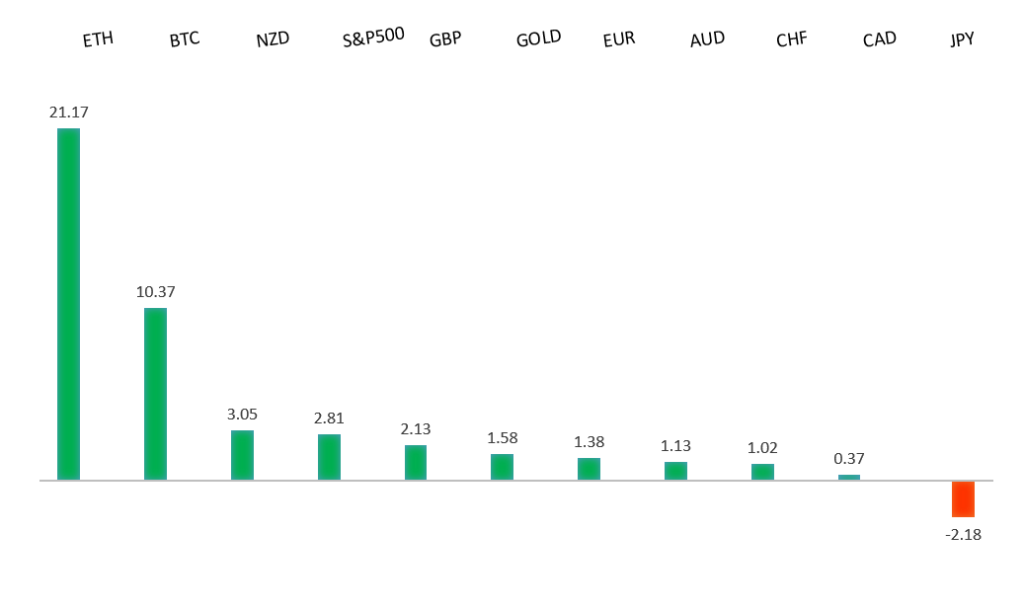
Peformance chart: 30-Day Performance vs. US dollar (%)
Suggested reading
- Artificial Intelligence Will Succeed Where Web Failed, S. McBride, RiskHedge (May 28, 2024)
- A Puzzle in Markets, T. Slok, Apollo Academy (May 31, 2024)
Chart talk: Technical & fundamental highlights
Choose pair:
EURUSD – technical overview
The Euro has been in a multi-month consolidation since bottoming out in 2022. Setbacks have since been exceptionally well supported on dips below 1.0500, with a higher platform sought out ahead of the next major upside extension. Look for a push through the 2023 high at 1.1276 to strengthen the constructive outlook and extend the recovery run towards 1.2000. Only back below 1.0400 negates.EURUSD – fundamental overview
The Euro has been able to extend its run of gains to fresh multi-session highs, mostly on the back of broad based US Dollar selling brought on by yet another round of unimpressive US data, this time from softer ISM manufacturing. We also saw some demand earlier on Monday from an improvement in Eurozone manufacturing PMIs. Key standouts on Tuesday’s calendar come from German unemployment, US JOLTs job openings, US factory orders, and the New Zealand GDT auction.EURUSD - Technical charts in detail
GBPUSD – technical overview
Signs have emerged of the market wanting to put in a longer-term base after collapsing to a record low in September 2022. The latest push to a fresh 2024 high beyond 1.2830 confirms the outlook and opens the door for the next major upside extension towards the 2023 high at 1.3143. Any setbacks should now be well supported ahead of 1.2000.GBPUSD – fundamental overview
The British Retail Consortium reported May retail sales like-for-like at a much lower growth than expected. Still, this did nothing to prevent the Pound from trading to a multi-session high on the back of yet another round of soft US economic data, this time from ISM manufacturing. Key standouts on Tuesday’s calendar come from German unemployment, US JOLTs job openings, US factory orders, and the New Zealand GDT auction.USDJPY – technical overview
The market remains confined to a strong uptrend, most recently extending to a multi-year high through 160.00. Key support comes in at 151.95, with only a weekly close below to delay the constructive outlook.USDJPY – fundamental overview
Japan's monetary base for May grew 0.9% year over year versus 2.1% previous. Meanwhile, BOJ Governor Ueda said if inflation moved as projected it could be enough reason to start to raise rates. Japan FinMin Suzuki added FX intervention had been working and there would continue to be an appropriate response when needed. The Yen has been better bid on the back of these comments and another soft round of US economic data. Key standouts on Tuesday’s calendar come from German unemployment, US JOLTs job openings, US factory orders, and the New Zealand GDT auction.AUDUSD – technical overview
There are signs of the potential formation of a longer-term base with the market trading down into a meaningful longer-term support zone. Only a monthly close below 0.6200 would give reason for rethink. Back above 0.6900 will take the big picture pressure off the downside and strengthen case for a bottom.AUDUSD – fundamental overview
The Australian Dollar has been better bid on softer US economic data though has run into some resistance into rallies as iron ore struggles after falling to its lowest level in six weeks, and as Aussie company gross profits disappoint. Key standouts on Tuesday’s calendar come from German unemployment, US JOLTs job openings, US factory orders, and the New Zealand GDT auction.USDCAD – technical overview
Above 1.3000 signals an end to a period of longer-term bearish consolidation and suggests the market is in the process of carving out a more significant longer-term base. Next key resistance now comes in up into the 1.4000 area. Setbacks should be very well supported down into the 1.3000 area.USDCAD – fundamental overview
The Canadian Dollar wasn't able to participate in the broad currency rally against the Buck on Monday. Canada manufacturing PMIs came in softer than expected to offset fallout from the weaker US ISM manufacturing, all while the price of oil continued to slump, trading to its lowest level since February. Key standouts on Tuesday’s calendar come from German unemployment, US JOLTs job openings, US factory orders, and the New Zealand GDT auction.NZDUSD – technical overview
Overall pressure remains on the downside with the market continuing to stall out on runs up into the 0.6500 area. At the same time, there are some signs of the market wanting to put in a longer-term base. Ultimately, a break back above 0.6500 would be required to take the medium-term pressure off the downside and encourage this prospect. A monthly close below 0.5800 will intensify bearish price action.NZDUSD – fundamental overview
The New Zealand Dollar has been generating its latest round of bids on the back of softer US economic data that has painted a more investor friendly path forward for global markets. Key standouts on Tuesday’s calendar come from German unemployment, US JOLTs job openings, US factory orders, and the New Zealand GDT auction.US SPX 500 – technical overview
Longer-term technical studies continue to look quite extended, begging for a deeper correction ahead. At the same time, the latest bullish breakout to a fresh record high beyond the 2024 high opens the door for the next measured move upside extension targeting the 5650 area. Key support comes in at 5194.US SPX 500 – fundamental overview
Though we have seen a healthy adjustment of investor expectations towards the amount of rate cuts in 2024, the market still hopes policy will end up erring more towards the investor friendly, accommodative side of things. This bet has kept stocks well bid into dips and consistently pushing record highs. Still, if there is a sense the Fed will need to be more sensitive towards erring on the side of higher rates, it could invite major disruption to the stock market.GOLD (SPOT) – technical overview
The 2019 breakout above the 2016 high at 1375 was a significant development, opening the door for fresh record highs and this next major upside extension into the 2500-3000 area. Setbacks should now be well supported above 2000 on a monthly close basis.GOLD (SPOT) – fundamental overview
The yellow metal has pushed record highs in 2024 with solid demand from medium and longer-term accounts. These players are more concerned about inflation, geopolitical risk and a less upbeat global growth outlook. All of this should keep the commodity well supported, with many market participants also fleeing to the hard asset as the grand dichotomy of record high equities and record low yields comes to an end.