


Today’s report: Currencies underperform in 2024
The big story in financial markets in 2025 is going to be about the direction of Fed policy. Investors will want the Fed to get back to thinking about more rate cuts than less in 2025. At the moment, Fed funds futures are pricing 38 basis points of cuts in 2025.
Wake-up call
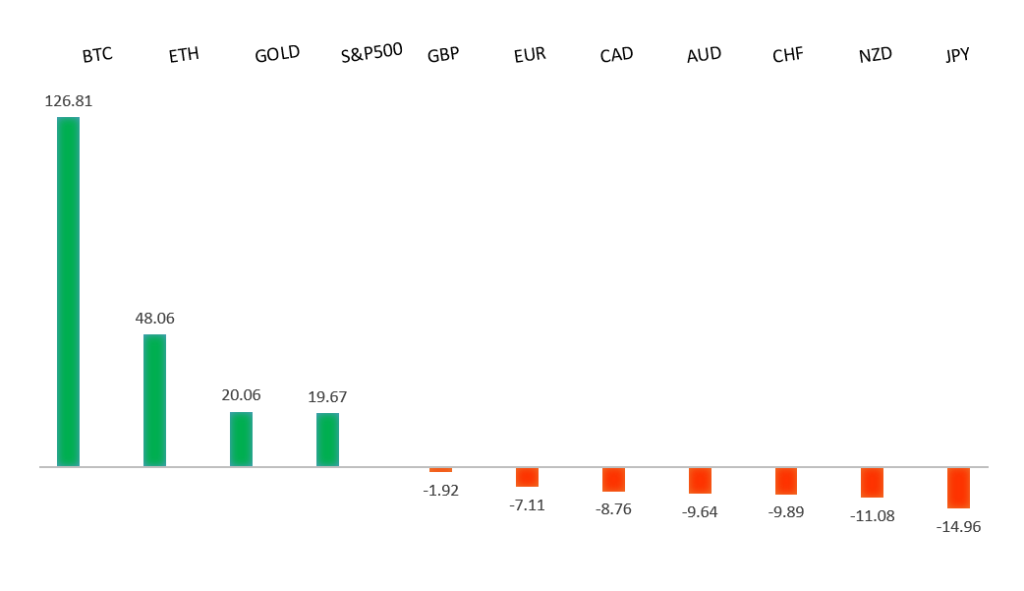
Peformance chart: YTD Performance vs. US dollar (%)
Suggested reading
- Risks To Global Markets In 2025, T. Slok, Apollo (December 23, 2024)
- The 10 Fastest Growing Jobs of 2024, S. Gupta, Apollo (December 23, 2024)
Chart talk: Technical & fundamental highlights
Choose pair:
EURUSD – technical overview
The Euro has been in a multi-month consolidation since bottoming out in 2022. Setbacks have since been exceptionally well supported on dips below 1.0500, with a higher platform sought out ahead of the next major upside extension. Look for a major bounce in the days ahead and the start to a push back towards the 2023 high at 1.1276. Only a monthly close below 1.0400 negates.EURUSD – fundamental overview
The Euro continues to trade in the 1.0400 area around several reported large option barriers. Trading conditions will remain exceptionally thin through the second week in January on account of the holiday season. Expect bigger picture themes to dictate direction and flow.EURUSD - Technical charts in detail
GBPUSD – technical overview
Signs have emerged of the market wanting to put in a longer-term base after collapsing to a record low in September 2022. The door is now open for the next major upside extension towards the 2018 high at 1.4377. Setbacks should be well supported above 1.2500 on a monthly close basis.GBPUSD – fundamental overview
The Pound has been extra quiet in the holiday week. Trading conditions will remain exceptionally thin through the second week in January on account of the holiday season. Expect bigger picture themes to dictate direction and flow.USDJPY – technical overview
The market is looking to resume the longer-term uptrend after an intense correction in 2024. A higher low is ideally sought out above 140.00 in favor of a bullish continuation. The recent weekly close back above 150.00 strengthens the case for longer-term uptrend resumption.USDJPY – fundamental overview
The BOJ Summary of Opinions offered up little in the way of any surprises, with central bankers exhibiting uncertainty over the timing of rate hikes. Trading conditions will remain exceptionally thin through the second week in January on account of the holiday season. Expect bigger picture themes to dictate direction and flow.AUDUSD – technical overview
There are signs of the potential formation of a longer-term base with the market trading down into a meaningful longer-term support zone. Only a monthly close below 0.6200 would give reason for rethink. A monthly close back above 0.7000 will take the big picture pressure off the downside and strengthen case for a bottom.AUDUSD – fundamental overview
The Australian Dollar trades soft despite the recent World Bank upgrade to the China outlook and bid in metals. On the data front, China industrial profits fell by less than expected. Aussie is trading back down to post-FOMC, multi-month low levels. Trading conditions will remain exceptionally thin through the second week in January on account of the holiday season. Expect bigger picture themes to dictate direction and flow.USDCAD – technical overview
A sustained hold above 1.3000 over the past several months signals an end to a period of longer-term bearish consolidation and suggests the market is in the process of carving out a more significant longer-term base. Next key resistance now comes in up into the 1.4500-1.5000 area, exposing a retest of the 2020 high just ahead of 1.4700. Setbacks should be very well supported ahead of 1.3500.USDCAD – fundamental overview
The Canadian Dollar has come under some pressure on the latest pullback in the price of oil. Trading conditions will remain exceptionally thin through the second week in January on account of the holiday season. Expect bigger picture themes to dictate direction and flow.NZDUSD – technical overview
Overall pressure remains on the downside with the market continuing to stall out on runs up into the 0.6500 area. At the same time, there are some signs of the market wanting to put in a longer-term base. Ultimately, a break back above 0.6500 would be required to take the medium-term pressure off the downside and encourage this prospect. A monthly close below 0.5500 will intensify bearish price action.NZDUSD – fundamental overview
The New Zealand Dollar trades soft despite the recent World Bank upgrade to the China outlook and bid in metals. On the data front, China industrial profits fell by less than expected. Kiwi is trading just off recent 26-month lows. Trading conditions will remain exceptionally thin through the second week in January on account of the holiday season. Expect bigger picture themes to dictate direction and flow.US SPX 500 – technical overview
The longer term uptrend remains intact and dips continue to be exceptionally well supported. Critical support comes in at 5679, with only a break back below this level to compromise the structure and open the door for a more significant corrective decline. Until then, the focus remains on a continued push to fresh record highs.US SPX 500 – fundamental overview
Investors are feeling better about a soft landing in the US economy. Moreover, there has been a fresh wave of market optimism in anticipation of a market bullish Trump presidency. It will however be important to keep an eye on inflation, bigger picture economic data and the latest shift in the Fed dot plot. Any of these variables are capable of easily ruffling some feathers and we've already seen a little of this in the aftermath of the latest Fed decision.GOLD (SPOT) – technical overview
The 2019 breakout above the 2016 high at 1375 was a significant development, opening the door for fresh record highs and this next major upside extension into the 3000 area. Setbacks should now be well supported above 2500 on a monthly close basis.GOLD (SPOT) – fundamental overview
The yellow metal has pushed record highs in 2024 with solid demand from medium and longer-term accounts. These players are more concerned about inflation, geopolitical risk and a less upbeat global growth outlook. All of this should keep the commodity well supported over the coming months.