


Today’s report: Direction unclear into weekend
Updates have been a slow go into Friday and there just hasn’t been a whole lot of meaningful movement in financial markets. As the week closes out, tensions around Russia and the Ukraine have lightened up, while expectations around the Fed outlook post this week’s Minutes have turned less hawkish.
Wake-up call
- EURUSD Economic data looking up
- BOE
- Japan CPI
- appetite improves
- hawkish talk
- RBNZ expectations
- Stocks vulnerable
- Dealers report
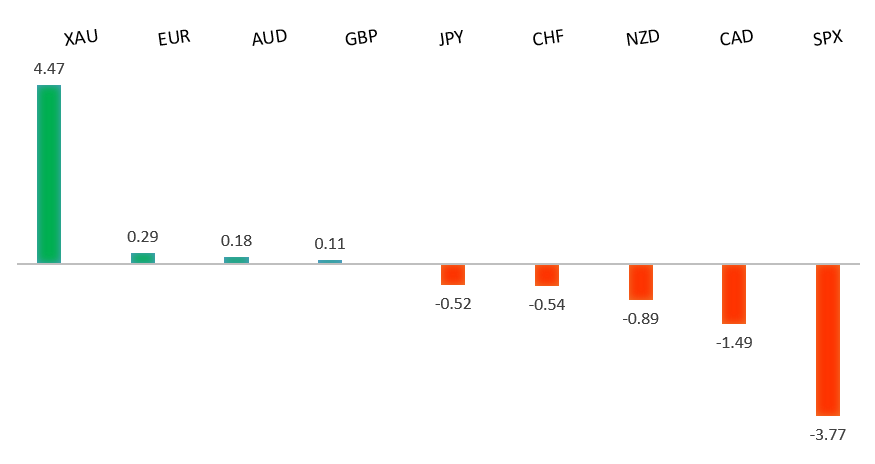
Peformance chart: 30 Day Performance vs. US dollar (%)
Suggested reading
- There’s More Than Ukraine. How About a China Pivot?, J. Authers, Bloomberg (February 18, 2022)
- How Robinhood's Psych Experiment Backfired Horribly, S. Jakab, Wired (February 11, 2022)
Chart talk: Technical & fundamental highlights
Choose pair:
EURUSD – technical overview
Setbacks have been well supported below 1.1200, with the market sharply reversing course and pushing back towards the yearly high. A clear break back above 1.1500 will suggest the market could be getting ready to turn back up. Inability to sustain above 1.1500 will keep the pressure on the downside.EURUSD – fundamental overview
Price action has been subdued, though we have seen support into dips from solid Eurozone data this week. Key standouts on today’s calendar come in the form of UK retail sales, the Eurozone current account, Eurozone construction output, Canada retail sales, Canada ADP employment, Eurozone consumer confidence, and US existing home sales. We also get a flurry of central bank speak.EURUSD - Technical charts in detail
GBPUSD – technical overview
The market is in a correction phase in the aftermath of the run to fresh multi-month highs in 2021. At this stage, additional setbacks should be limited to the 1.3000 area ahead of the next major upside extension towards a retest and break of critical resistance in the form of the 2018 high. Back above 1.3835 takes pressure off the downside.GBPUSD – fundamental overview
Strong UK jobs data and hot inflation prints have been pushing those odds up for a 50bp BOE hike in March. Key standouts on today’s calendar come in the form of UK retail sales, the Eurozone current account, Eurozone construction output, Canada retail sales, Canada ADP employment, Eurozone consumer confidence, and US existing home sales. We also get a flurry of central bank speak.USDJPY – technical overview
The longer-term trend is bearish despite the recent run higher. Look for additional upside to be limited, with scope for a topside failure and bearish resumption back down towards the 100.00 area. It would take a clear break back above 117.00 to negate the outlook.USDJPY – fundamental overview
The Yen comes into Friday with more of a bid tone, mostly on the back of Thursday's risk off flow. The Japanese government has lowered the growth outlook for first time in five months, citing the omicron surge. But we have seen some early Friday selling as risk appetite improves and after Japan CPI came in softer than expected. Key standouts on today’s calendar come in the form of UK retail sales, the Eurozone current account, Eurozone construction output, Canada retail sales, Canada ADP employment, Eurozone consumer confidence, and US existing home sales. We also get a flurry of central bank speak.AUDUSD – technical overview
The Australian Dollar has been in the process of a healthy correction following the impressive run towards a retest of the 2018 high in 2021. At this stage, the correction is starting to look stretched and setbacks should be well supported above 0.7000 on a weekly close basis. A weekly close below 0.7000 will force a bearish shift.AUDUSD – fundamental overview
The Australian Dollar has been tracking with risk sentiment. On Thursday, risk off flow weighed on Aussie, but into Friday, the resurgence in risk appetite has been propping the currency. Key standouts on today’s calendar come in the form of UK retail sales, the Eurozone current account, Eurozone construction output, Canada retail sales, Canada ADP employment, Eurozone consumer confidence, and US existing home sales. We also get a flurry of central bank speak.USDCAD – technical overview
Finally signs of a major bottom in the works after a severe decline from the 2020 high. A recent weekly close back above 1.2500 encourages the constructive outlook and opens the door for a push back towards next critical resistance in the 1.3000 area. Any setbacks should be well supported into the 1.2200s.USDCAD – fundamental overview
The Canadian Dollar was mildly offered on Thursday, mostly on the back of the dips in stocks and oil. But Canada inflation continues to run hot and BoC Lane has been out talking hawkish. Key standouts on today’s calendar come in the form of UK retail sales, the Eurozone current account, Eurozone construction output, Canada retail sales, Canada ADP employment, Eurozone consumer confidence, and US existing home sales. We also get a flurry of central bank speak.NZDUSD – technical overview
Setbacks have intensified in recent weeks with the market trading down to fresh multi-month lows. A recent breakdown below the 0.6700 area opens the door for a drop towards 0.6500 in the sessions ahead.NZDUSD – fundamental overview
The New Zealand Dollar has been supported in recent sessions on hawkish RBNZ expectations and a recovery in risk sentiment. Key standouts on today’s calendar come in the form of UK retail sales, the Eurozone current account, Eurozone construction output, Canada retail sales, Canada ADP employment, Eurozone consumer confidence, and US existing home sales. We also get a flurry of central bank speak.US SPX 500 – technical overview
Longer-term technical studies are in the process of unwinding from extended readings off record highs. The latest breakdown below 4,272 opens the door for the next major downside extension towards 3,500. Back above 4,612 will be required at a minimum to take the immediate pressure off the downside.US SPX 500 – fundamental overview
With so little room for additional central bank accommodation, given an already depressed interest rate environment, the prospect for sustainable runs to the topside on easy money policy incentives and government stimulus, should no longer be as enticing to investors. Meanwhile, ongoing worry associated with coronavirus fallout and risk of rising inflation should weigh more heavily on investor sentiment in Q1 2022.GOLD (SPOT) – technical overview
The 2019 breakout above the 2016 high at 1375 was a significant development, opening the door for fresh record highs and an acceleration beyond the next major psychological barrier at 2000. Setbacks should now be well supported above 1700.GOLD (SPOT) – fundamental overview
The yellow metal continues to be well supported on dips with solid demand from medium and longer-term accounts. These players are more concerned about exhausted monetary policy, extended global equities, and coronavirus fallout. All of this should keep the commodity well supported, with many market participants also fleeing to the hard asset as the grand dichotomy of record high equities and record low yields comes to an unnerving climax.