


Next 24 hours: Risk on flow alive and well
Today’s report: Dollar longs starting to lighten up
The market is starting to ease up on bets of aggressive Trump tariff policies, or at least as aggressive as initially feared. This has opened a repricing of Dollar exposure, with the Buck selling off across the board as a consequence.
Wake-up call
- dovish ECB
- public borrowing
- hike speculation
- fears tempered
- producer prices
- Kiwi CPI
- dovish Fed
- Macro themes
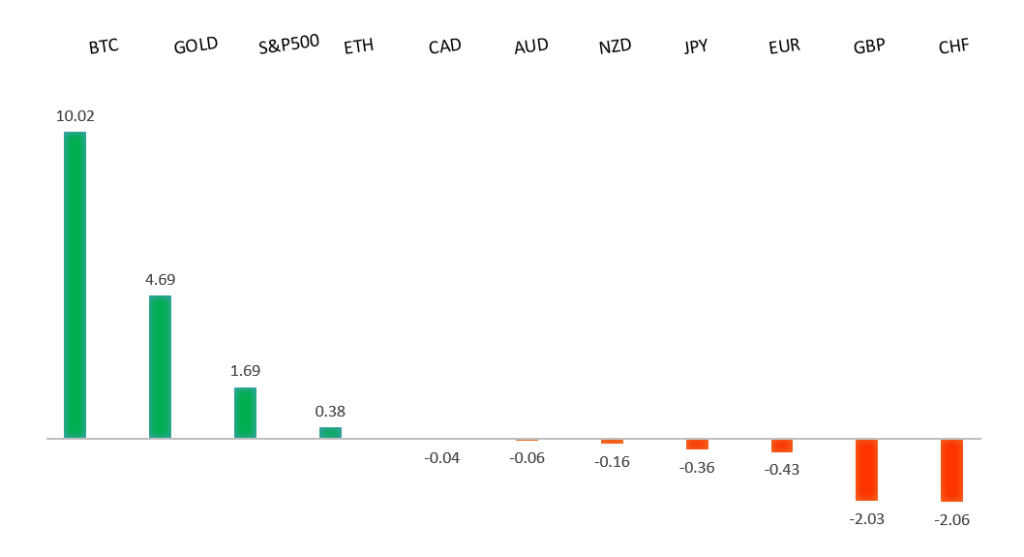
Peformance chart: 30-Day Performance vs. US dollar (%)
Suggested reading
- Artificial Intelligence Gold Rush Hinges On This Stock, S. McBride, RiskHedge (January 20, 2025)
- An Investor’s Guide to the Next Trump Administration, L. Mitchell, Morningstar (January 20, 2025)
Chart talk: Technical & fundamental highlights
Choose pair:
EURUSD – technical overview
The Euro has been in a multi-month consolidation since bottoming out in 2022. Setbacks have since been exceptionally well supported on dips towards parity, with a higher platform sought out ahead of the next major upside extension. Look for a major bounce in the days ahead and the start to a push back towards the 2023 high at 1.1276. Only a monthly close below 1.0000 negates.EURUSD – fundamental overview
The Euro has managed to rally despite dovish comments from ECB's Nagel and Villeroy. It seems most of the demand has come from the US Dollar side, where market participants have been selling the Buck on the view President Trump will take a more moderate approach to tariff policy. Tuesday's better EU and German ZEW reads have also helped the single currency. Key standouts on Wednesday’s calendar come from UK public borrowing, Canada producer prices, and an ECB Lagarde speech.EURUSD - Technical charts in detail
GBPUSD – technical overview
Signs have emerged of the market wanting to put in a longer-term base after collapsing to a record low in September 2022. The door is now open for the next major upside extension towards the 2018 high at 1.4377. Setbacks should be well supported above 1.2000 on a monthly close basis.GBPUSD – fundamental overview
The Pound has been relatively outperforming as GILTS are the more attractive choice relative to EGBs. It seems a round of dovish ECB comments and softer Euro area data have also factored into some of the relative strength. UK employment data was softer this week, though the earnings component remains elevated. Key standouts on Wednesday’s calendar come from UK public borrowing, Canada producer prices, and an ECB Lagarde speech.USDJPY – technical overview
The market is looking to resume the longer-term uptrend after an intense correction in 2024. A higher low is ideally sought out above 140.00 in favor of a bullish continuation. The October monthly close back above 150.00 strengthens the case for longer-term uptrend resumption.USDJPY – fundamental overview
Expectations for a BOJ rate hike this week have been supporting the Yen, though we are seeing some US Dollar demand creep in on Trump trade policy fears. Key standouts on Wednesday’s calendar come from UK public borrowing, Canada producer prices, and an ECB Lagarde speech.AUDUSD – technical overview
There are signs of the potential formation of a longer-term base with the market trading down into a meaningful longer-term support zone. Only a monthly close below 0.6000 would give reason for rethink. A monthly close back above 0.7000 will take the big picture pressure off the downside and strengthen case for a bottom.AUDUSD – fundamental overview
The Australian Dollar has been better supported in recent sessions as the worst fears around Trump tariff policies are put to rest. Key standouts on Wednesday’s calendar come from UK public borrowing, Canada producer prices, and an ECB Lagarde speech.USDCAD – technical overview
A sustained hold above 1.3000 over the past several months signals an end to a period of longer-term bearish consolidation and suggests the market is in the process of carving out a more significant longer-term base. Next key resistance now comes in up into the 1.4500-1.5000 area, exposing a retest of the 2020 high just ahead of 1.4700. Setbacks should be very well supported ahead of 1.3500.USDCAD – fundamental overview
The threat around tariffs has become less severe over the past 24 hours, which has invited some welcome relief to the Canadian Dollar. At the same time, the February 1 deadline is still something to worry about, while falling oil has also kept the Loonie from wanting to run too far and fast. Key standouts on Wednesday’s calendar come from UK public borrowing, Canada producer prices, and an ECB Lagarde speech.NZDUSD – technical overview
Overall pressure remains on the downside with the market continuing to stall out on runs up into the 0.6500 area. At the same time, there are some signs of the market wanting to put in a longer-term base. Ultimately, a break back above 0.6500 would be required to take the medium-term pressure off the downside and encourage this prospect. A monthly close below 0.5500 will intensify bearish price action.NZDUSD – fundamental overview
The New Zealand Dollar hasn't been able to do much with a slightly hotter than expected CPI print earlier today. The market doesn't believe this will be enough to remove the probability for another 50 basis point RBNZ rate cut at the upcoming meeting. Key standouts on Wednesday’s calendar come from UK public borrowing, Canada producer prices, and an ECB Lagarde speech.US SPX 500 – technical overview
The longer term uptrend remains intact and dips continue to be exceptionally well supported. Critical support comes in at 5679, with only a break back below this level to compromise the structure and open the door for a more significant corrective decline. Until then, the focus remains on a continued push to fresh record highs.US SPX 500 – fundamental overview
Investors are feeling better about a soft landing in the US economy. Moreover, there has been a fresh wave of market optimism in anticipation of a market bullish Trump presidency. It will however be important to keep an eye on inflation, bigger picture economic data and the latest shift in the Fed dot plot. Any of these variables are capable of easily ruffling some feathers and we've already seen a little of this in the aftermath of the latest Fed decision.GOLD (SPOT) – technical overview
The 2019 breakout above the 2016 high at 1375 was a significant development, opening the door for fresh record highs and this next major upside extension into the 3000 area. Setbacks should now be well supported above 2500 on a monthly close basis.GOLD (SPOT) – fundamental overview
The yellow metal has pushed record highs in recent months with solid demand from medium and longer-term accounts. These players are more concerned about inflation, geopolitical risk and a less upbeat global growth outlook. All of this should keep the commodity well supported over the coming months.