


Today’s report: Dollar recovers on strong US economic data
Last Friday’s US jobs report sent a message to the currency market that it shouldn’t be so sure about where the Fed is headed next. We’ve seen a lot of pricing in of peak rates and the start to rate cuts and yet, Friday’s strong US data would argue the Fed still needs to be leaning more hawkish.
Wake-up call
- US data
- inflation outlook
- BOJ odds
- diverging flow
- oil surge
- manufacturing data
- Economic outlook
- Macro themes
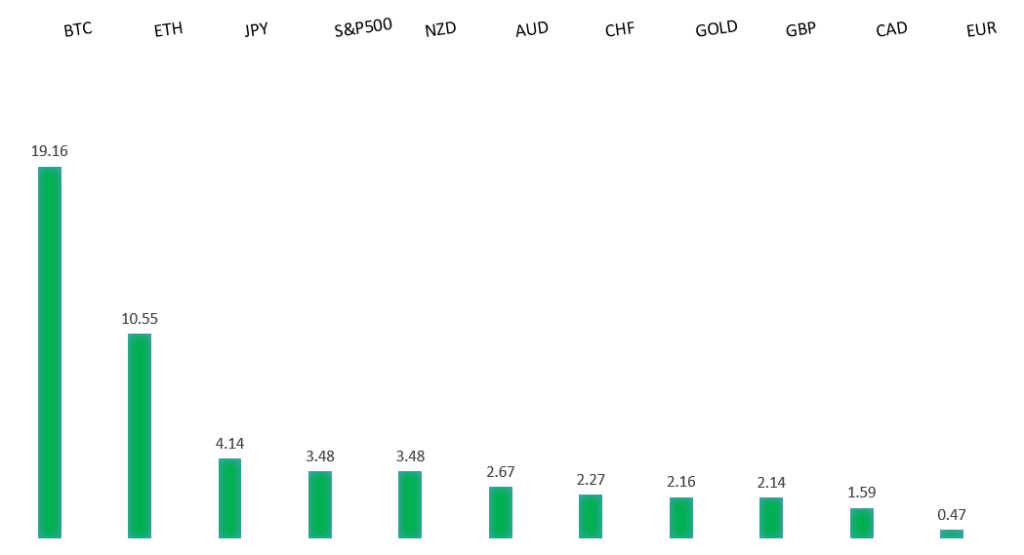
Peformance chart: 30 Day Performance vs. US dollar (%)
Suggested reading
- A Singular Lesson From Last Year’s Oil Price Cap, Fisher Investments (December 7, 2023)
- Things You Don’t See in A Recession, Carson Group (December 6, 2023)
Chart talk: Technical & fundamental highlights
Choose pair:
EURUSD – technical overview
The Euro has been in a multi-month consolidation since bottoming out in 2022. Setbacks have since been exceptionally well supported on dips below 1.0500, with a higher platform sought out ahead of the next major upside extension. Look for a push through the yearly high at 1.1276 to strengthen the constructive outlook and extend the recovery run towards 1.2000. Only back below 1.0400 negates.EURUSD – fundamental overview
The strong US jobs report and blowout Michigan sentiment data have forced currency traders to reconsider dovish Fed bets, with the US Dollar rallying across the board as a consequence. Looking ahead, Monday’s economic calendar is exceptionally thin with no first-tier economic data of note. US consumer inflation expectations is the only notable standout.EURUSD - Technical charts in detail
GBPUSD – technical overview
Signs have emerged of the market wanting to put in a longer-term base after collapsing to a record low in September 2022. The November 2022 monthly close back above 1.2000 strengthens this prospect. Any setbacks should now be well supported ahead of 1.2000. Next key resistance comes in at 1.2818.GBPUSD – fundamental overview
The Pound came under some pressure into the end of last week after the UK inflation outlook was lowered. The BOE survey of year-ahead inflation expectations declined to 3.3%, the slowest since October 2021 . Looking ahead, Monday’s economic calendar is exceptionally thin with no first-tier economic data of note. US consumer inflation expectations is the only notable standout.USDJPY – technical overview
The market remains confined to a strong uptrend, with sights set on a retest and break of the multi-year high from 2022 at 151.95. A push through this level will open the next major upside extension towards 155.00. Key support comes in at 141.61, with only a weekly close below to delay the constructive outlook.USDJPY – fundamental overview
We had warned the market was probably getting ahead of itself in expecting any changes from the BOJ this week. Indeed, that pricing has responded as such, with odds for a rate hike this week already cut to just 15% from what had been nearly 50% on Thursday. Solid US economic data has also factored into the flow. Looking ahead, Monday’s economic calendar is exceptionally thin with no first-tier economic data of note. US consumer inflation expectations is the only notable standout.AUDUSD – technical overview
There are signs of the potential formation of a longer-term base with the market trading down into a meaningful longer-term support zone. Only a monthly close below 0.6200 would give reason for rethink. Back above 0.6900 will take the big picture pressure off the downside and strengthen case for a bottom.AUDUSD – fundamental overview
The Australian Dollar was caught between demand from higher equities and selling from broad based US Dollar strength. In the end, Aussie was more offered than not on Friday, as yield differentials moved back towards the US Dollar after a solid round of US jobs and Michigan sentiment data. Looking ahead, Monday’s economic calendar is exceptionally thin with no first-tier economic data of note. US consumer inflation expectations is the only notable standout.USDCAD – technical overview
Above 1.3000 signals an end to a period of longer-term bearish consolidation and suggests the market is in the process of carving out a more significant longer-term base. Next key resistance now comes in up into the 1.4000 area. Setbacks should be very well supported down into the 1.3000 area.USDCAD – fundamental overview
The Canadian Dollar held up relatively well on Friday when considering the wave of broad based US Dollar demand from the US jobs report and Michigan sentiment reads. It seems most of this relative strength came from a resurgence in demand for oil. Looking ahead, Monday’s economic calendar is exceptionally thin with no first-tier economic data of note. US consumer inflation expectations is the only notable standout.NZDUSD – technical overview
Overall pressure remains on the downside with the market continuing to stall out on runs up into the 0.6500 area. At the same time, there are some signs of the market wanting to put in a longer-term base. Ultimately, a break back above 0.6500 would be required to take the medium-term pressure off the downside and encourage this prospect. A monthly close below 0.5800 will intensify bearish price action.NZDUSD – fundamental overview
The New Zealand Dollar was an underperformer into the end of last week, taking hits from weak New Zealand manufacturing data and stronger US data in the form of the jobs report and Michigan sentiment. Looking ahead, Monday’s economic calendar is exceptionally thin with no first-tier economic data of note. US consumer inflation expectations is the only notable standout.US SPX 500 – technical overview
Longer-term technical studies are in the process of unwinding from extended readings off record highs. Look for rallies to be well capped in favor of lower tops and lower lows. A monthly close back above 4600 will be required to take the immediate pressure off the downside. Next key support comes in at 4536.US SPX 500 – fundamental overview
Investors continue to struggle with the reality of a higher for longer Fed policy track in the face of ongoing worry around inflation. Overall, we expect inflation to continue to be a problem in 2023 that results in downside pressure into rallies despite recent data and market expectations that would argue otherwise. Economic data out of the US has been solid on the whole, which further supports the Fed keeping with a more hawkish stance than the market would like to see.GOLD (SPOT) – technical overview
The 2019 breakout above the 2016 high at 1375 was a significant development, opening the door for fresh record highs. Setbacks should now be well supported above 1900 on a monthly close basis ahead of the next major upside extension towards 2500.GOLD (SPOT) – fundamental overview
The yellow metal continues to be well supported on dips with solid demand from medium and longer-term accounts. These players are more concerned about inflation risk and a less stable and upbeat global growth outlook. All of this should keep the commodity well supported, with many market participants also fleeing to the hard asset as the grand dichotomy of record high equities and record low yields comes to an unnerving climax.