


Today’s report: US jobs report stands out
As we come into the weekly close, we’re looking at one currency standing way above the rest. That currency isn’t one that is accustomed to taking this slot on the chart, especially with risk sentiment looking quite healthy. We’re talking about the Yen, up over 2% against the Buck on the week.
Wake-up call
- losing streak
- USD weakness
- BOJ Ueda
- trade surplus
- Subdued commodities
- sentiment uptick
- Inflation risk
- Global outlook
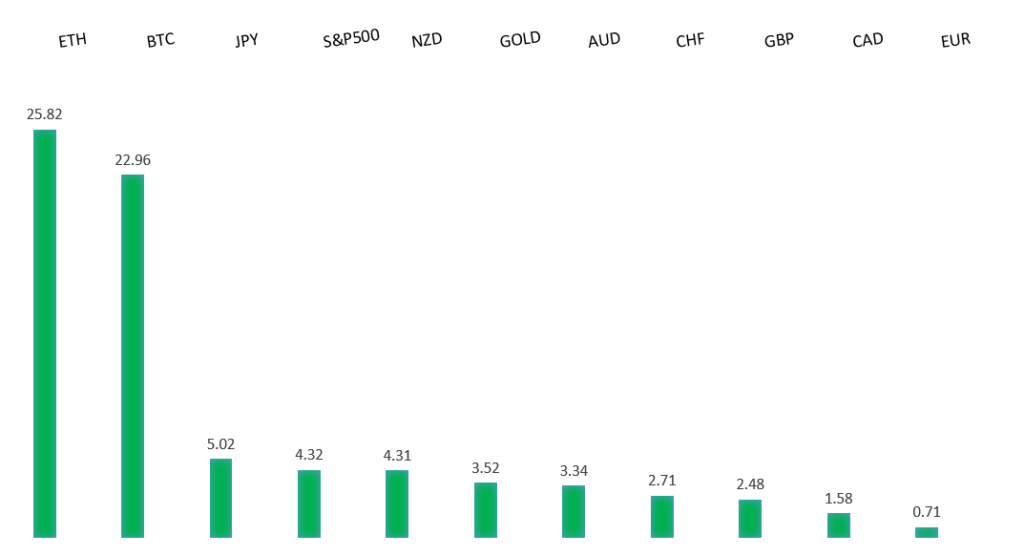
Peformance chart: 30 Day Performance vs. US dollar (%)
Suggested reading
- Why Bonds Are Making a Huge Comeback, Morningstar (December 5, 2023)
- How Biden's Inflation Reduction Act Changed the World, Financial Times (December 6, 2023)
Chart talk: Technical & fundamental highlights
Choose pair:
EURUSD – technical overview
The Euro has been in a multi-month consolidation since bottoming out in 2022. Setbacks have since been exceptionally well supported on dips below 1.0500, with a higher platform sought out ahead of the next major upside extension. Look for a push through the yearly high at 1.1276 to strengthen the constructive outlook and extend the recovery run towards 1.2000. Only back below 1.0400 negates.EURUSD – fundamental overview
The Euro finally rebounded after a six day losing streak. The price action was more a function of US Dollar dynamics than anything else, particularly in light of another round of discouraging economic data out of the Zone by way of German and Italian industrial production. Key standouts on Friday’s calendar come from German inflation data, the US jobs report, and Michigan sentiment.EURUSD - Technical charts in detail
GBPUSD – technical overview
Signs have emerged of the market wanting to put in a longer-term base after collapsing to a record low in September 2022. The November 2022 monthly close back above 1.2000 strengthens this prospect. Any setbacks should now be well supported ahead of 1.2000. Next key resistance comes in at 1.2818.GBPUSD – fundamental overview
The Pound has recovered into Friday, though the Thursday rebound was less a function of UK fundamentals and more about broad based US Dollar weakness. Key standouts on Friday’s calendar come from German inflation data, the US jobs report, and Michigan sentiment.USDJPY – technical overview
The market remains confined to a strong uptrend, with sights set on a retest and break of the multi-year high from 2022 at 151.95. A push through this level will open the next major upside extension towards 155.00. Key support comes in at 141.61, with only a weekly close below to delay the constructive outlook.USDJPY – fundamental overview
The Yen has been able to shrug off weak growth and wages reports on account of the big news from Thursday. On Thursday, BOJ Governor Ueda added to speculation the central bank may exit from its negative interest rate policy. Key standouts on Friday’s calendar come from German inflation data, the US jobs report, and Michigan sentiment.AUDUSD – technical overview
There are signs of the potential formation of a longer-term base with the market trading down into a meaningful longer-term support zone. Only a monthly close below 0.6200 would give reason for rethink. Back above 0.6900 will take the big picture pressure off the downside and strengthen case for a bottom.AUDUSD – fundamental overview
The Australian Dollar has done a good job finding some relative strength into the end of the week, getting help from a widening Aussie trade surplus from higher exports, and from impressive rallies in iron ore and coal. Key standouts on Friday’s calendar come from German inflation data, the US jobs report, and Michigan sentiment.USDCAD – technical overview
Above 1.3000 signals an end to a period of longer-term bearish consolidation and suggests the market is in the process of carving out a more significant longer-term base. Next key resistance now comes in up into the 1.4000 area. Setbacks should be very well supported down into the 1.3000 area.USDCAD – fundamental overview
Subdued commodities prices have left the Canadian Dollar relatively underperforming into Friday. A rebound in Canada building permits has done nothing to help the Loonie. Key standouts on Friday’s calendar come from German inflation data, the US jobs report, and Michigan sentiment.NZDUSD – technical overview
Overall pressure remains on the downside with the market continuing to stall out on runs up into the 0.6500 area. At the same time, there are some signs of the market wanting to put in a longer-term base. Ultimately, a break back above 0.6500 would be required to take the medium-term pressure off the downside and encourage this prospect. A monthly close below 0.5800 will intensify bearish price action.NZDUSD – fundamental overview
Thursday's round of risk on flow reflected through higher US equities and broad based US Dollar weakness has been the type of flow to prop up the risk correlated New Zealand Dollar. Key standouts on Friday’s calendar come from German inflation data, the US jobs report, and Michigan sentiment.US SPX 500 – technical overview
Longer-term technical studies are in the process of unwinding from extended readings off record highs. Look for rallies to be well capped in favor of lower tops and lower lows. A monthly close back above 4600 will be required to take the immediate pressure off the downside. Next key support comes in at 4308.US SPX 500 – fundamental overview
Investors continue to struggle with the reality of a higher for longer Fed policy track in the face of ongoing worry around inflation, while also contending with geopolitical risk in 2023. Overall, we expect inflation to continue to be a problem in 2023 that results in downside pressure into rallies despite recent data and market expectations that would argue otherwise.GOLD (SPOT) – technical overview
The 2019 breakout above the 2016 high at 1375 was a significant development, opening the door for fresh record highs. Setbacks should now be well supported above 1900 on a monthly close basis ahead of the next major upside extension towards 2500.GOLD (SPOT) – fundamental overview
The yellow metal continues to be well supported on dips with solid demand from medium and longer-term accounts. These players are more concerned about inflation risk and a less stable and upbeat global growth outlook. All of this should keep the commodity well supported, with many market participants also fleeing to the hard asset as the grand dichotomy of record high equities and record low yields comes to an unnerving climax.