


Next 24 hours: Euro collapses in US election aftermath
Today’s report: Dollar rockets higher as election results come in
Markets are all about US election results as we come into the European open on this Wednesday. At the time of this update, there is an overwhelming expectation Donald Trump will be the next President of the United States.
Wake-up call
- producer prices
- services PMIs
- intervention calls
- US election
- Ivey PMIs
- employment data
- accommodative policy
- Macro themes
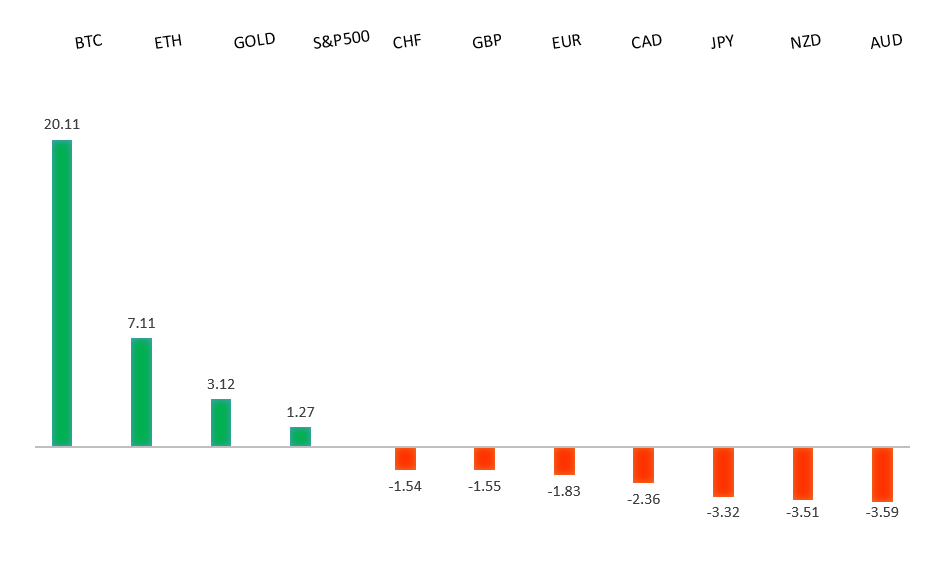
Peformance chart: 30-Day Performance vs. US dollar (%)
Suggested reading
- The Economy and Market Do Well Regardless, J. Calhoun, Alhambra (November 4, 2024)
- Artificial Intelligence Undermining Google's Monopoly, S. McBride, RiskHedge (November 4, 2024)
Chart talk: Technical & fundamental highlights
Choose pair:
EURUSD – technical overview
The Euro has been in a multi-month consolidation since bottoming out in 2022. Setbacks have since been exceptionally well supported on dips below 1.0500, with a higher platform sought out ahead of the next major upside extension. Look for a push through the 2023 high at 1.1276 to strengthen the constructive outlook and extend the recovery run towards 1.2000. Only back below 1.0400 negates.EURUSD – fundamental overview
Price action is all about the US election results on this Wednesday, with the Euro selling off hard on the expectation for a Trump presidency. Key standouts on Wednesday’s calendar come from Eurozone, German, and UK services PMIs, Eurozone producer prices, an ECB Lagarde speech, and Canada Ivey PMIs.EURUSD - Technical charts in detail
GBPUSD – technical overview
Signs have emerged of the market wanting to put in a longer-term base after collapsing to a record low in September 2022. The door is now open for the next major upside extension towards the 2018 high at 1.4377. Any setbacks should be well supported ahead of 1.2500.GBPUSD – fundamental overview
Price action is all about the US election results on this Wednesday, with the Pound selling off hard on the expectation for a Trump presidency. Key standouts on Wednesday’s calendar come from Eurozone, German, and UK services PMIs, Eurozone producer prices, an ECB Lagarde speech, and Canada Ivey PMIs.USDJPY – technical overview
The market is looking to resume the longer-term uptrend after an intense correction in 2024. A higher low is ideally sought out above 140.00 in favor of a bullish continuation. A weekly close back above 150.00 will hint at the start to longer-term uptrend resumption.USDJPY – fundamental overview
Price action is all about the US election results on this Wednesday, with the Yen selling off hard on the expectation for a Trump presidency. There is elevated chatter around the possibility for a fresh round of MOF intervention in light of the latest Yen weakness. Key standouts on Wednesday’s calendar come from Eurozone, German, and UK services PMIs, Eurozone producer prices, an ECB Lagarde speech, and Canada Ivey PMIs.AUDUSD – technical overview
There are signs of the potential formation of a longer-term base with the market trading down into a meaningful longer-term support zone. Only a monthly close below 0.6200 would give reason for rethink. A monthly close back above 0.7000 will take the big picture pressure off the downside and strengthen case for a bottom.AUDUSD – fundamental overview
Price action is all about the US election results on this Wednesday, with the Australian Dollar selling off hard on the expectation for a Trump presidency. Key standouts on Wednesday’s calendar come from Eurozone, German, and UK services PMIs, Eurozone producer prices, an ECB Lagarde speech, and Canada Ivey PMIs.USDCAD – technical overview
A sustained hold above 1.3000 over the past several months signals an end to a period of longer-term bearish consolidation and suggests the market is in the process of carving out a more significant longer-term base. Next key resistance now comes in up into the 1.4000 area, with a break to open a retest of the 2020 high just ahead of 1.4700. Setbacks should be very well supported down into the 1.3000 area.USDCAD – fundamental overview
Price action is all about the US election results on this Wednesday, with the Canadian Dollar selling off hard on the expectation for a Trump presidency. Key standouts on Wednesday’s calendar come from Eurozone, German, and UK services PMIs, Eurozone producer prices, an ECB Lagarde speech, and Canada Ivey PMIs.NZDUSD – technical overview
Overall pressure remains on the downside with the market continuing to stall out on runs up into the 0.6500 area. At the same time, there are some signs of the market wanting to put in a longer-term base. Ultimately, a break back above 0.6500 would be required to take the medium-term pressure off the downside and encourage this prospect. A monthly close below 0.5800 will intensify bearish price action.NZDUSD – fundamental overview
Price action is all about the US election results on this Wednesday, with the New Zealand Dollar selling off hard on the expectation for a Trump presidency. The New Zealand Dollar is also contending with a round of weaker than expected New Zealand employment data. Key standouts on Wednesday’s calendar come from Eurozone, German, and UK services PMIs, Eurozone producer prices, an ECB Lagarde speech, and Canada Ivey PMIs.US SPX 500 – technical overview
The longer term uptrend remains intact and dips continue to be exceptionally well supported. Critical support comes in at 5093, with only a break back below this level to compromise the structure and open the door for a more significant corrective decline. Until then, the focus remains on a continued push to fresh record highs.US SPX 500 – fundamental overview
The US equities market remains exceptionally well supported in 2024 on the back of an ongoing expectation for more rate cuts than less going forward. Investors are feeling better about a soft landing in the US economy and this has also been accompanied by an accommodative adjustment of Fed policy. It will however be important to keep an eye on inflation, bigger picture economic data, and geopolitical risk in the weeks and months ahead.GOLD (SPOT) – technical overview
The 2019 breakout above the 2016 high at 1375 was a significant development, opening the door for fresh record highs and this next major upside extension into the 3000 area. Setbacks should now be well supported above 2500 on a monthly close basis.GOLD (SPOT) – fundamental overview
The yellow metal has pushed record highs in 2024 with solid demand from medium and longer-term accounts. These players are more concerned about inflation, geopolitical risk and a less upbeat global growth outlook. All of this should keep the commodity well supported over the coming months.