


 | ||
| 22nd July 2026 | view in browser | ||
| Stocks rally through geopolitical uncertainty while dollar holds firm | ||
| The US dollar remains supported by higher Treasury yields and escalating Middle East tensions, while resilient equity markets, elevated oil prices and widening policy divergence—particularly between the Fed and the BoJ—continue to shape global market sentiment. | ||
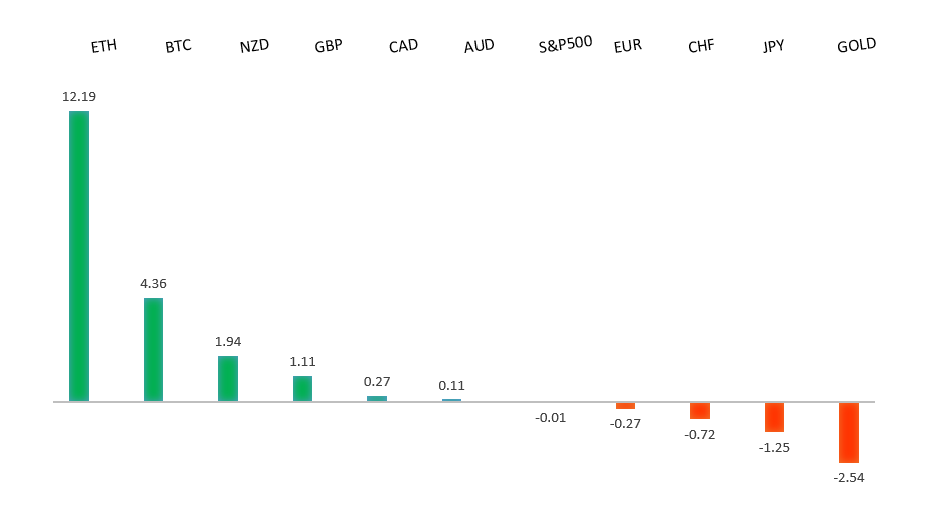
| Performance chart 30day v. USD (%) | ||
 | ||
| Technical & fundamental highlights | ||
| EURUSD: technical overview | ||
| The Euro outlook remains constructive with higher lows sought out on dips in favor of the next major upside extension targeting the 2021 high at 1.2350. Setbacks should be exceptionally well supported ahead of 1.1300. | ||
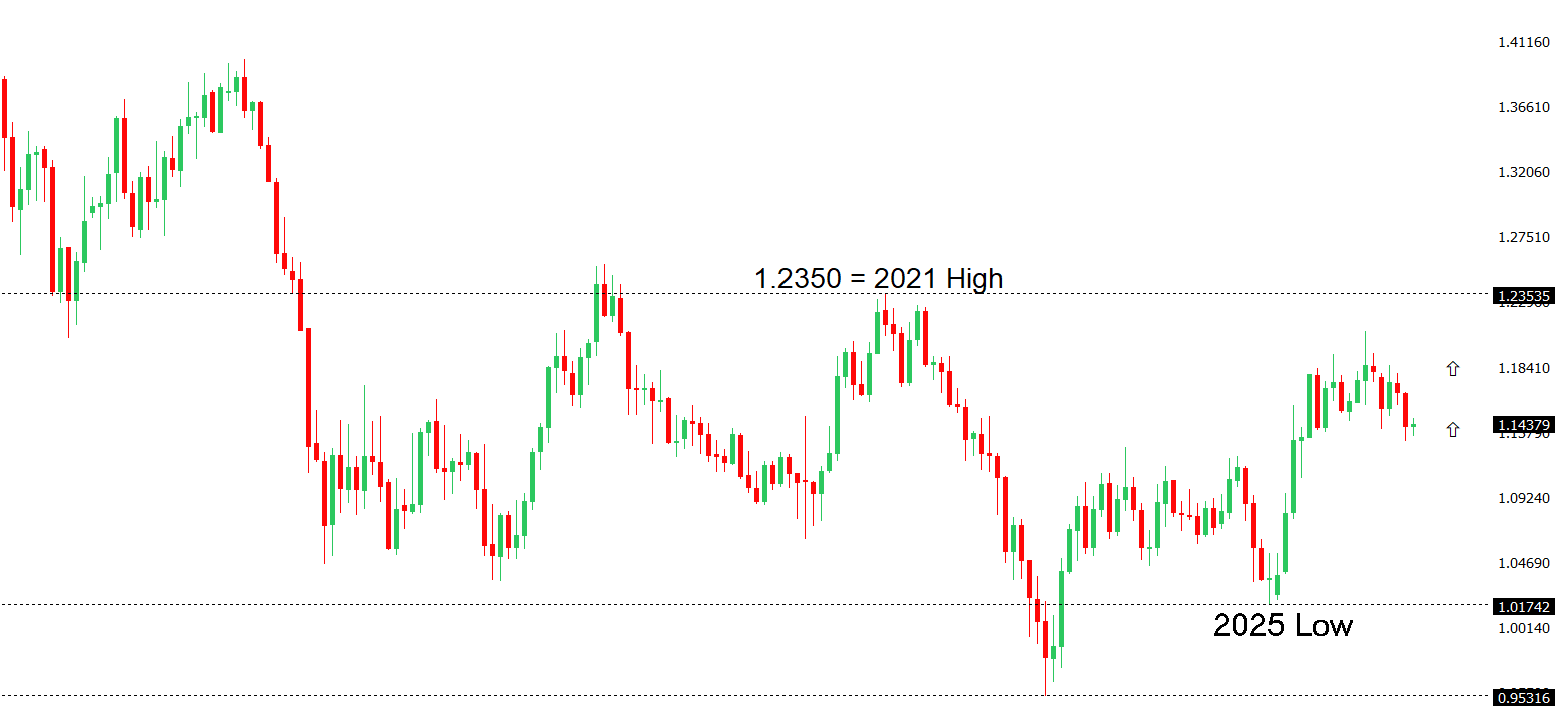 | ||
| R2 1.1529 - 18 June high - Medium R1 1.1483 - 15 July high - Medium S1 1.1325 - 24 June/2026 low - Medium S2 1.1300 - Figure - Medium | ||
| EURUSD: fundamental overview | ||
| The euro remains under pressure as renewed US Dollar strength, driven by escalating US-Iran tensions and rising safe-haven demand, pushes EURUSD back toward the 1.1400 area. Concerns that the conflict could disrupt energy supplies through the Strait of Hormuz have lifted oil prices and revived inflation fears, reinforcing expectations that both the Federal Reserve and the European Central Bank will need to keep policy restrictive for longer. While July’s German and Eurozone ZEW economic sentiment surveys surprised to the upside, pointing to improving confidence and supporting the broader Eurozone recovery narrative, the positive data has been overshadowed by geopolitical developments and the stronger dollar. Markets broadly expect the ECB to leave rates unchanged this week, but continue to price in additional tightening later this year if inflation pressures persist, helping prevent a deeper euro selloff even as risk-off sentiment continues to dominate near-term price action. | ||
| GBPUSD: technical overview | ||
| The Pound remains exceptionally well supported on dips into the 1.3000 area, with the price largely consolidating above the psychological barrier and previous resistance turned support in the form of the 2023 high. Look for the market to continue be well supported on dips ahead of the next major upside extension through the yearly high at 1.3870 and towards a retest of the 2018 high at 1.4377 further up. Only a monthly close below 1.3000 negates. | ||
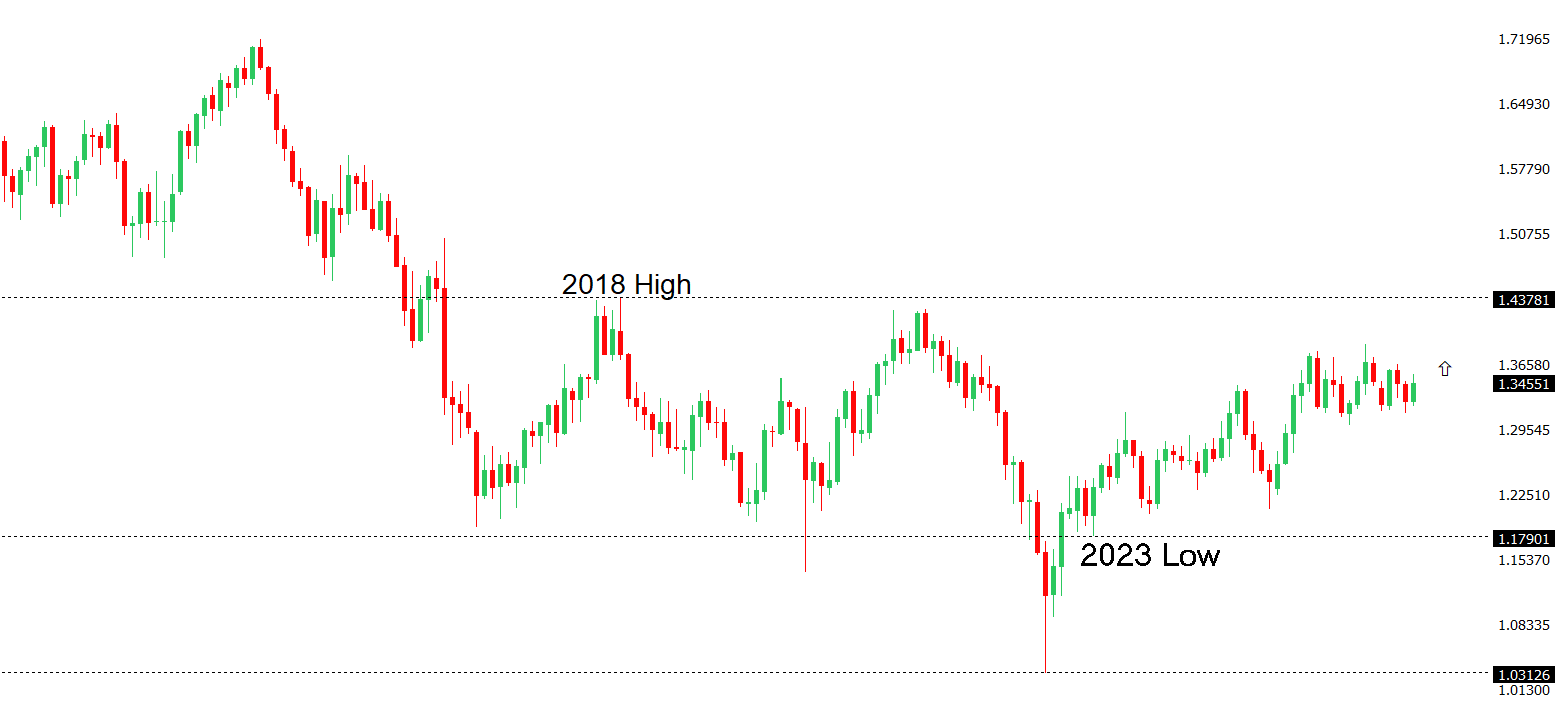 | ||
| R2 1.3658 - 1 May high - Strong R1 1.3558 - 15 July high - Medium S1 1.3360 - 21 July low - Medium S2 1.3322 - 8 July low - Strong | ||
| GBPUSD: fundamental overview | ||
| The Pound remains under pressure as a stronger US Dollar, supported by safe-haven demand amid the escalating US-Iran conflict and firmer expectations that the Federal Reserve could keep policy restrictive for longer, weighs on GBPUSD. Domestically, UK labor market data sent mixed signals, with stronger-than-expected employment growth and a lower unemployment rate offset by softer wage growth, reinforcing expectations that underlying inflation pressures are gradually easing and reducing the urgency for further Bank of England tightening. Markets are now firmly focused on the upcoming UK inflation report, where another moderation in headline and core CPI could further dampen BoE rate hike expectations, while an upside surprise would likely revive hawkish pricing. Political developments are also influencing sentiment after Prime Minister Andy Burnham announced the removal of VAT on household electricity bills as part of a broader cost-of-living package. Although the measure offers modest support to consumers and may trim headline inflation slightly, investors remain cautious over the fiscal implications, with sterling and UK gilts weakening on concerns that any perception of unfunded fiscal easing could undermine confidence in the UK’s policy credibility. Looking ahead, alongside inflation data, retail sales and preliminary PMIs later this week will be key gauges of whether the UK economy is slowing enough to justify a more cautious BoE stance or whether sticky inflation risks continue to support higher interest rates. | ||
| USDJPY: technical overview | ||
| The major pair has extended its run to fresh multi-decade highs, with the latest push through 160.00 opening the door for further upside towards 165.00-170.00. At the same time, daily studies are looking quite stretched, suggesting we could see a healthy correction on the horizon. A break back below 160.48 would now strengthen the case for a larger pullback. Until then, the market will continue to be focused on additional gains. | ||
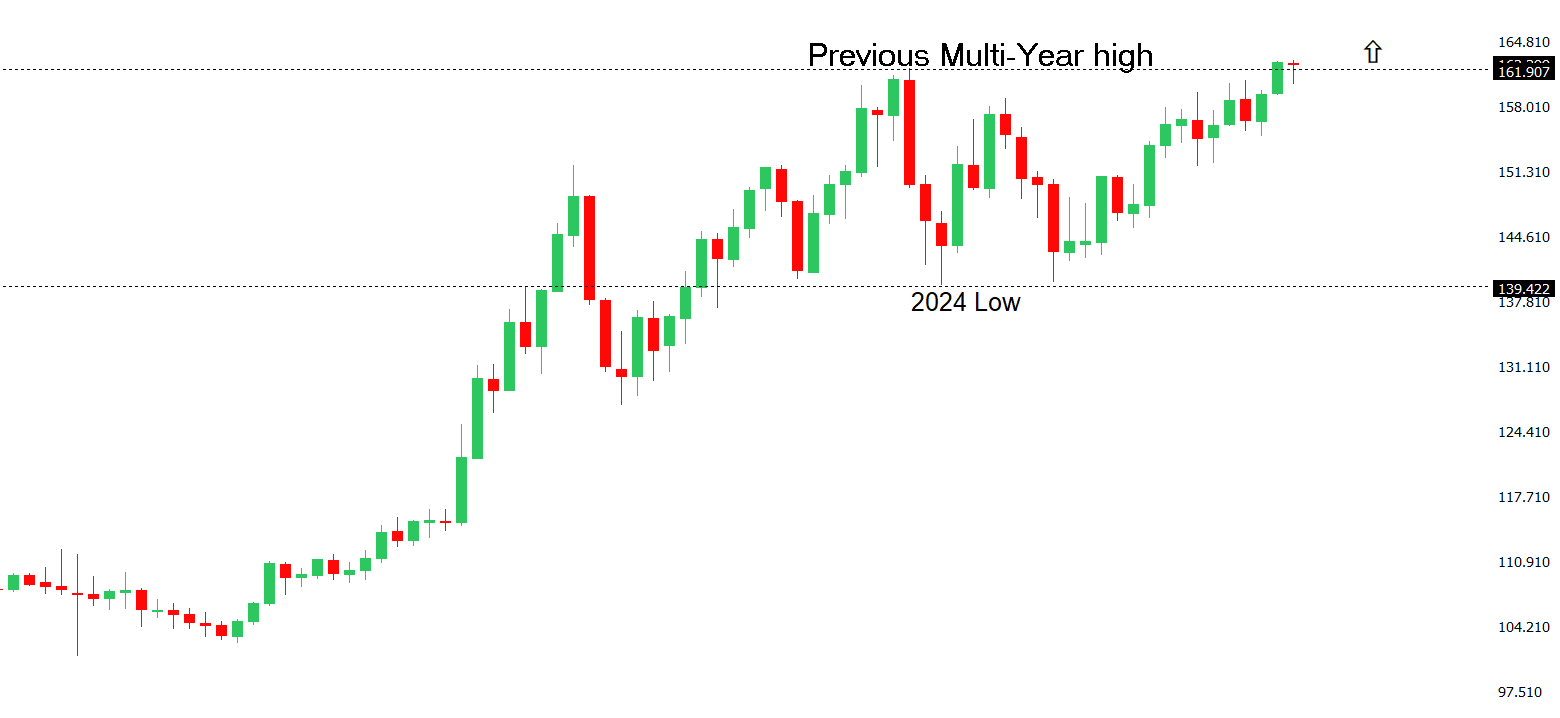 | ||
| R2 164.00 - Figure - Medium R1 163.25 - Multi-Year high/21 July 2026 - Strong S1 162.20 - 20 July low - Medium S2 161.28 - 10 July low - Medium | ||
| USDJPY: fundamental overview | ||
| The Yen remains under heavy pressure as USDJPY trades into fresh multi-decade high territory above 163.00, with the wide US-Japan interest rate differential continuing to fuel carry trade demand while renewed geopolitical tensions in the Middle East boost safe-haven flows into the US Dollar. Rising oil prices have also added to concerns that higher energy costs will keep global inflation elevated, supporting expectations that the Federal Reserve may need to maintain a restrictive policy stance even as markets remain doubtful the Bank of Japan will raise rates aggressively beyond current expectations due to concerns over Japan’s fragile economic recovery. While Japanese officials continue to signal a willingness to tighten policy further, investors remain skeptical that the BoJ can meaningfully narrow the yield gap, leaving the Yen vulnerable despite growing speculation that authorities could intervene to curb excessive currency weakness as USDJPY trades well above levels previously associated with intervention risk. | ||
| AUDUSD: technical overview | ||
| There are signs of the formation of a longer-term base with the market recovering out from a meaningful longer-term support zone. The latest monthly close back above 0.7000 takes the big picture pressure off the downside and strengthens the case for a bottom, with the focus now on a push towards 0.8000. Setbacks should now be well supported ahead of 0.6700. | ||
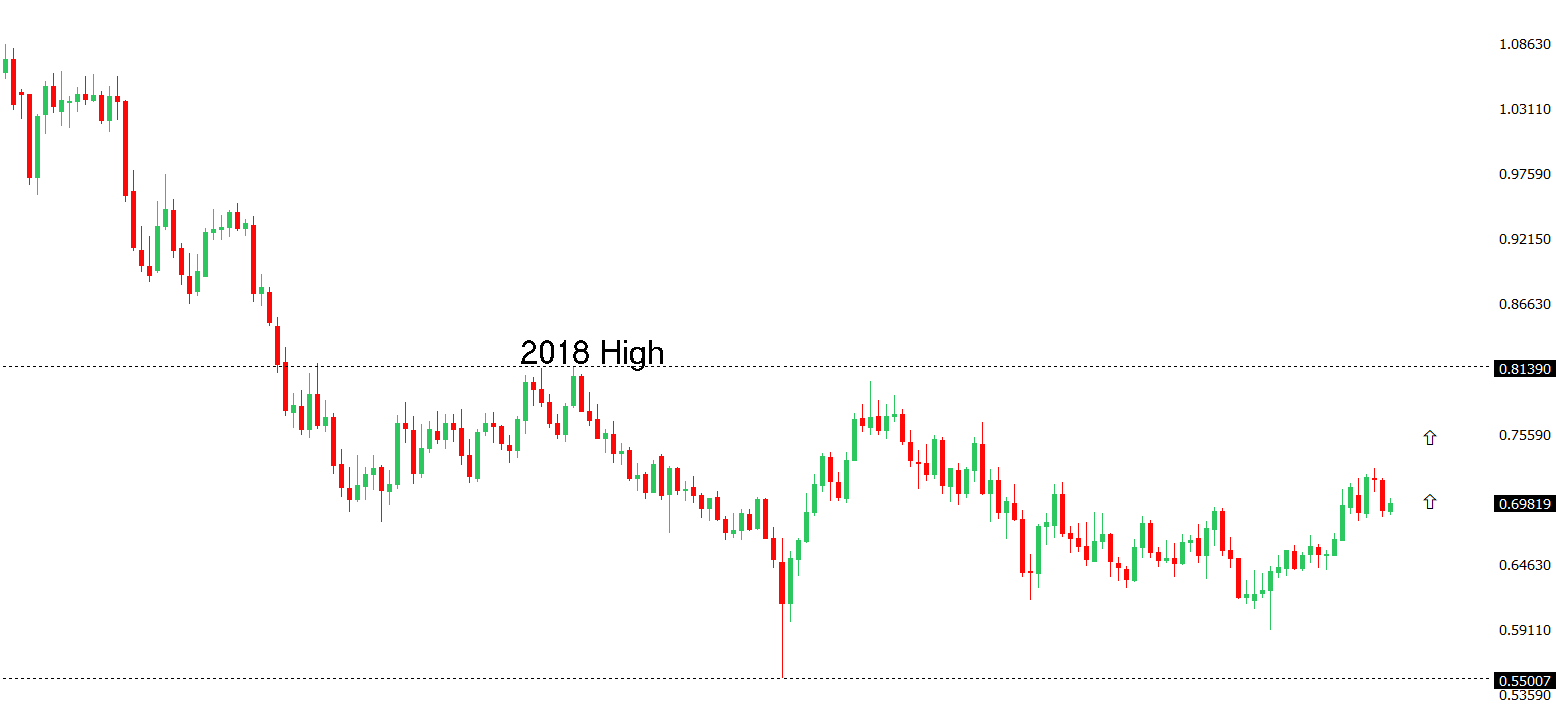 | ||
| R2 0.7089 - 15 June high - Strong R1 0.7027 - 21 July high - Medium S1 0.6912 - 14 July low - Medium S2 0.6865 - 30 June low - Strong | ||
| AUDUSD: fundamental overview | ||
| The Australian Dollar remains supported near the 0.7000 level as investors continue to balance competing domestic and global forces. The Reserve Bank of Australia’s still-hawkish policy stance, resilient labor market and sticky underlying inflation continue to underpin expectations that further policy tightening remains possible, although markets are waiting for this week’s employment report and next week’s June CPI release before reassessing the August meeting. At the same time, the US Dollar has remained firm as Middle East tensions, higher energy prices and lingering Federal Reserve tightening expectations have prevented the Aussie from establishing a meaningful rate advantage, leaving AUDUSD largely rangebound. External fundamentals have also been mixed, with subdued iron ore prices and uncertainty over global trade weighing on Australia’s export outlook, while China’s steady but unspectacular economic performance has provided stability without generating a strong tailwind for commodity-linked currencies. Looking ahead, Australia’s labor market data, preliminary PMIs and next week’s inflation report, alongside the Federal Reserve’s policy decision, represent the key catalysts that could determine whether the Aussie can sustain a break above 0.7000 or remain trapped within its recent range. | ||
| Suggested reading | ||
| Cleaning up farm emissions, Andrew Bounds, Financial Times (July 21, 2026) Fed’s Hawkish Tone Doesn’t Signal Rate Increases—at Least Not Yet, M. Leonhardt, Barron’s (July 20, 2026) | ||