


 | ||
| 23rd July 2026 | view in browser | ||
| Markets brace for ECB under shadow of conflict | ||
| Markets head into Thursday with investors balancing escalating Middle East tensions, rising oil prices and higher US Treasury yields against the ECB decision, corporate earnings and evolving North American trade negotiations, keeping the dollar supported and broader risk sentiment cautious. | ||
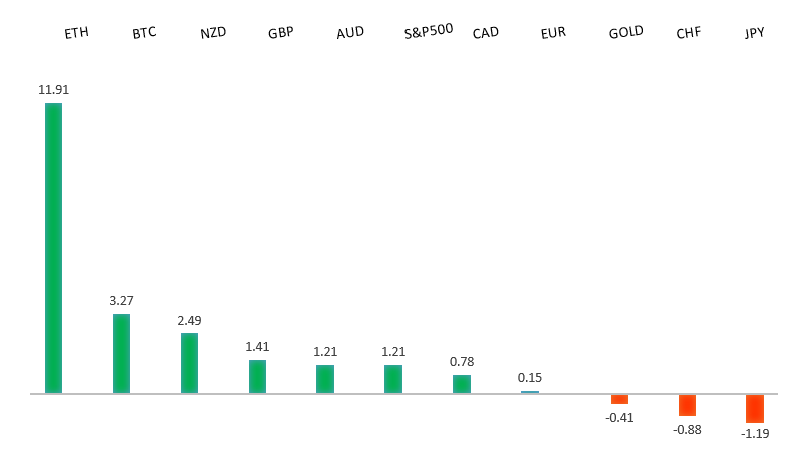
| Performance chart 30day v. USD (%) | ||
 | ||
| Technical & fundamental highlights | ||
| EURUSD: technical overview | ||
| The Euro outlook remains constructive with higher lows sought out on dips in favor of the next major upside extension targeting the 2021 high at 1.2350. Setbacks should be exceptionally well supported ahead of 1.1300. | ||
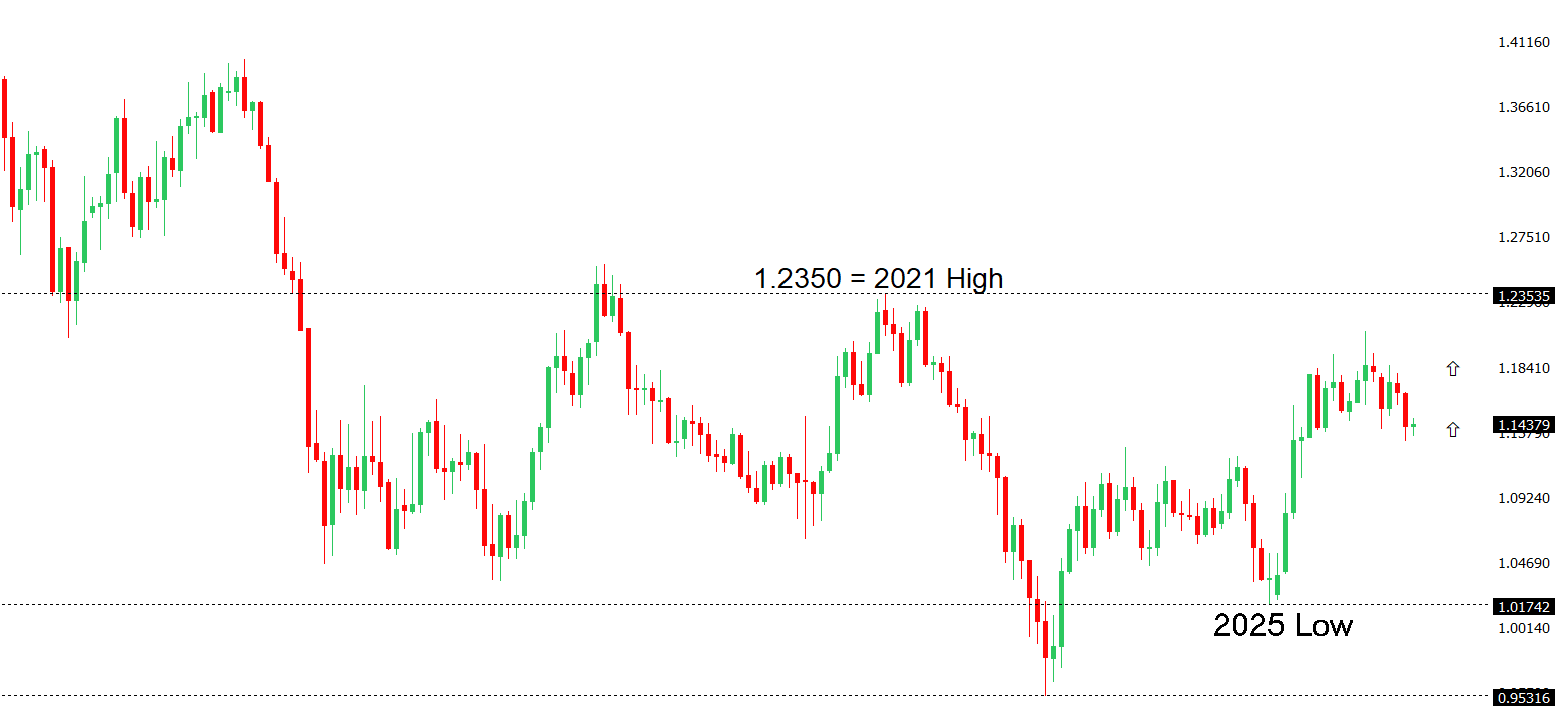 | ||
| R2 1.1529 - 18 June high - Medium R1 1.1483 - 15 July high - Medium S1 1.1325 - 24 June/2026 low - Medium S2 1.1300 - Figure - Medium | ||
| EURUSD: fundamental overview | ||
| The euro remains pinned near the 1.1400 level against the dollar as markets balance a more hawkish European Central Bank outlook against renewed safe-haven demand for the US dollar driven by escalating Middle East tensions. The ECB is widely expected to leave its deposit rate unchanged at 2.25% on Thursday, but investors continue to price a further tightening cycle, with money markets fully discounting a September rate hike and expecting rates to finish the year well above current levels. As a result, President Lagarde’s guidance on inflation, growth and the policy outlook will be the key driver for the single currency. At the same time, the euro has struggled to capitalize on broader dollar softness as rising oil prices, fueled by the ongoing US-Iran conflict and attacks on shipping in the Red Sea, have reinforced expectations that higher energy costs could keep global inflation elevated and limit the scope for central bank easing. Those dynamics have also supported US yields and the dollar, leaving EURUSD trapped between ECB hawkishness on one side and geopolitical risk alongside Fed tightening expectations on the other, with US jobless claims the main data point ahead of the ECB decision. | ||
| GBPUSD: technical overview | ||
| The Pound remains exceptionally well supported on dips into the 1.3000 area, with the price largely consolidating above the psychological barrier and previous resistance turned support in the form of the 2023 high. Look for the market to continue be well supported on dips ahead of the next major upside extension through the yearly high at 1.3870 and towards a retest of the 2018 high at 1.4377 further up. Only a monthly close below 1.3000 negates. | ||
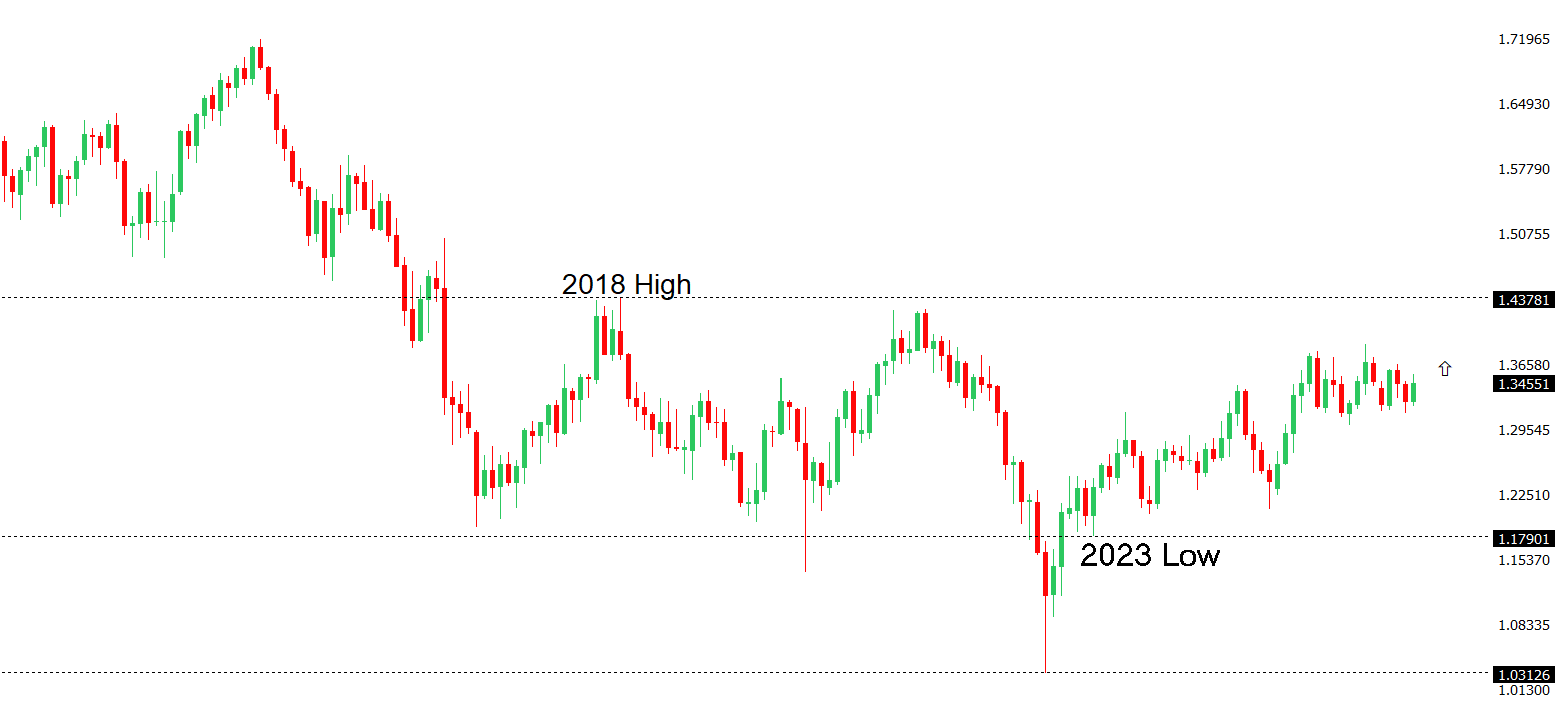 | ||
| R2 1.3658 - 1 May high - Strong R1 1.3558 - 15 July high - Medium S1 1.3354 - 22 July low - Medium S2 1.3322 - 8 July low - Strong | ||
| GBPUSD: fundamental overview | ||
| The Pound remains under pressure as a softer-than-expected June inflation report reinforces expectations that the Bank of England can afford to be more patient on further tightening. Headline CPI slowed to 2.6% year-on-year from 2.8%, while easing services inflation has tempered near-term rate hike expectations, although sticky core inflation continues to argue against an aggressive easing of policy. Sterling is also facing headwinds from renewed uncertainty over the UK’s fiscal outlook, with investors awaiting Prime Minister Andy Burnham’s medium-term fiscal plans amid concerns that greater flexibility around fiscal rules could leave the UK’s debt market vulnerable given its large current account deficit and relatively low domestic savings rate. At the same time, heightened geopolitical tensions in the Middle East continue to underpin the US Dollar through safe-haven demand and persistent energy-driven inflation risks, limiting upside for GBPUSD despite intermittent optimism surrounding US-Iran diplomacy. Looking ahead, markets will closely watch UK retail sales and flash PMI data for fresh evidence on the strength of domestic demand and economic activity ahead of next week’s Bank of England policy decision, with incoming data likely to determine whether the recent repricing of BoE expectations extends further. | ||
| USDJPY: technical overview | ||
| The major pair has extended its run to fresh multi-decade highs, with the latest push through 160.00 opening the door for further upside towards 165.00-170.00. At the same time, daily studies are looking quite stretched, suggesting we could see a healthy correction on the horizon. A break back below 160.48 would now strengthen the case for a larger pullback. Until then, the market will continue to be focused on additional gains. | ||
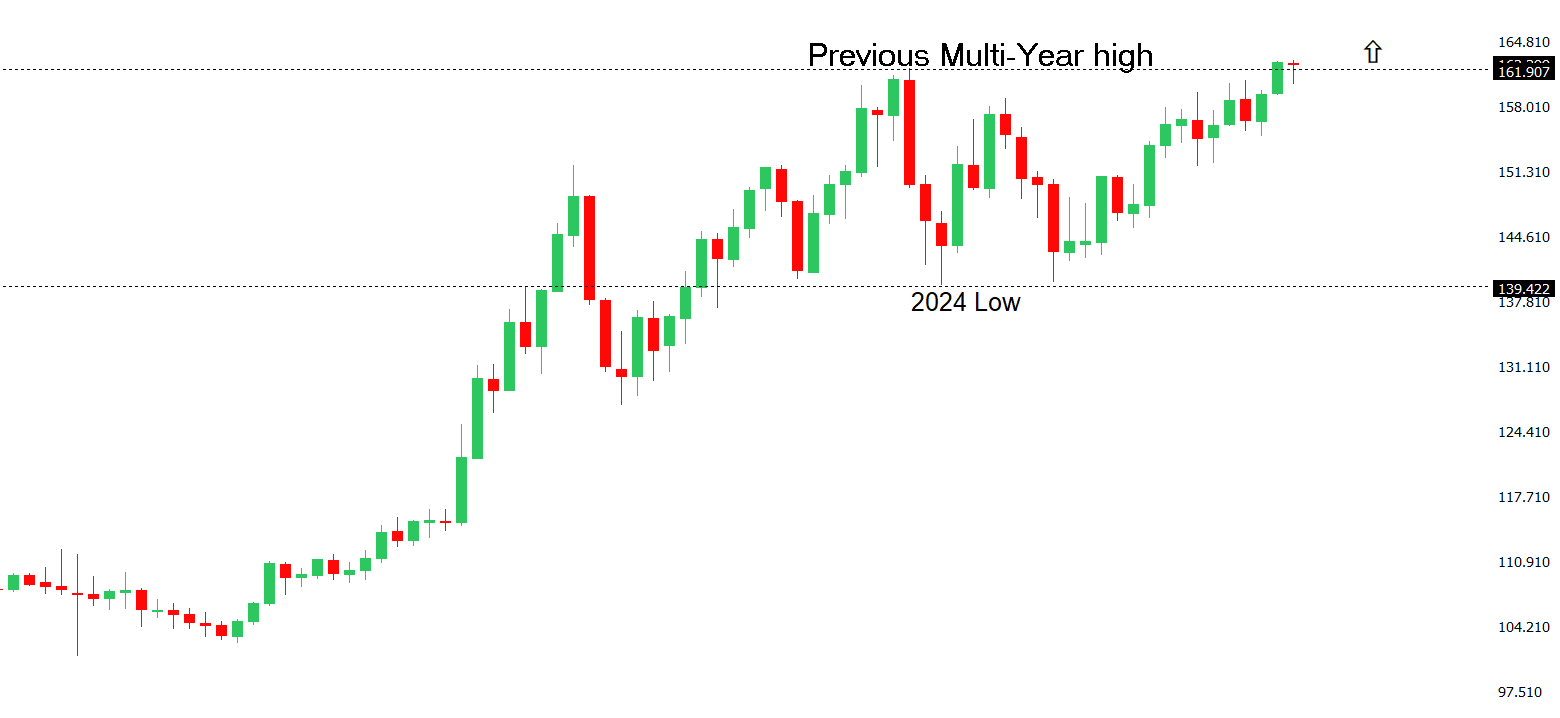 | ||
| R2 164.00 - Figure - Medium R1 163.25 - Multi-Year high/21 July 2026 - Strong S1 162.20 - 20 July low - Medium S2 161.28 - 10 July low - Medium | ||
| USDJPY: fundamental overview | ||
| The Yen remains under sustained pressure, with USDJPY holding above 163.00 at its strongest levels since 1986 as the wide US-Japan interest rate differential continues to fuel carry trade demand despite persistent intervention warnings from Japanese authorities. Safe-haven demand for the Yen has been outweighed by rising US Treasury yields, elevated oil prices and renewed geopolitical tensions in the Middle East, with Japan’s heavy reliance on imported energy adding to concerns that higher energy costs will keep inflation elevated without materially improving the BoJ’s ability to tighten policy aggressively. While BoJ officials have recently signaled greater openness to raising interest rates more frequently and acknowledged that prolonged Yen weakness poses an upside inflation risk, markets remain skeptical the policy rate can rise much beyond current expectations without damaging economic growth. That leaves traders focused on this week’s national CPI report for evidence that domestic inflation is strengthening enough to justify a more hawkish BoJ, even as speculation over potential Japanese FX intervention continues to temper further Yen losses rather than reverse the broader bearish trend. | ||
| AUDUSD: technical overview | ||
| There are signs of the formation of a longer-term base with the market recovering out from a meaningful longer-term support zone. The latest monthly close back above 0.7000 takes the big picture pressure off the downside and strengthens the case for a bottom, with the focus now on a push towards 0.8000. Setbacks should now be well supported ahead of 0.6700. | ||
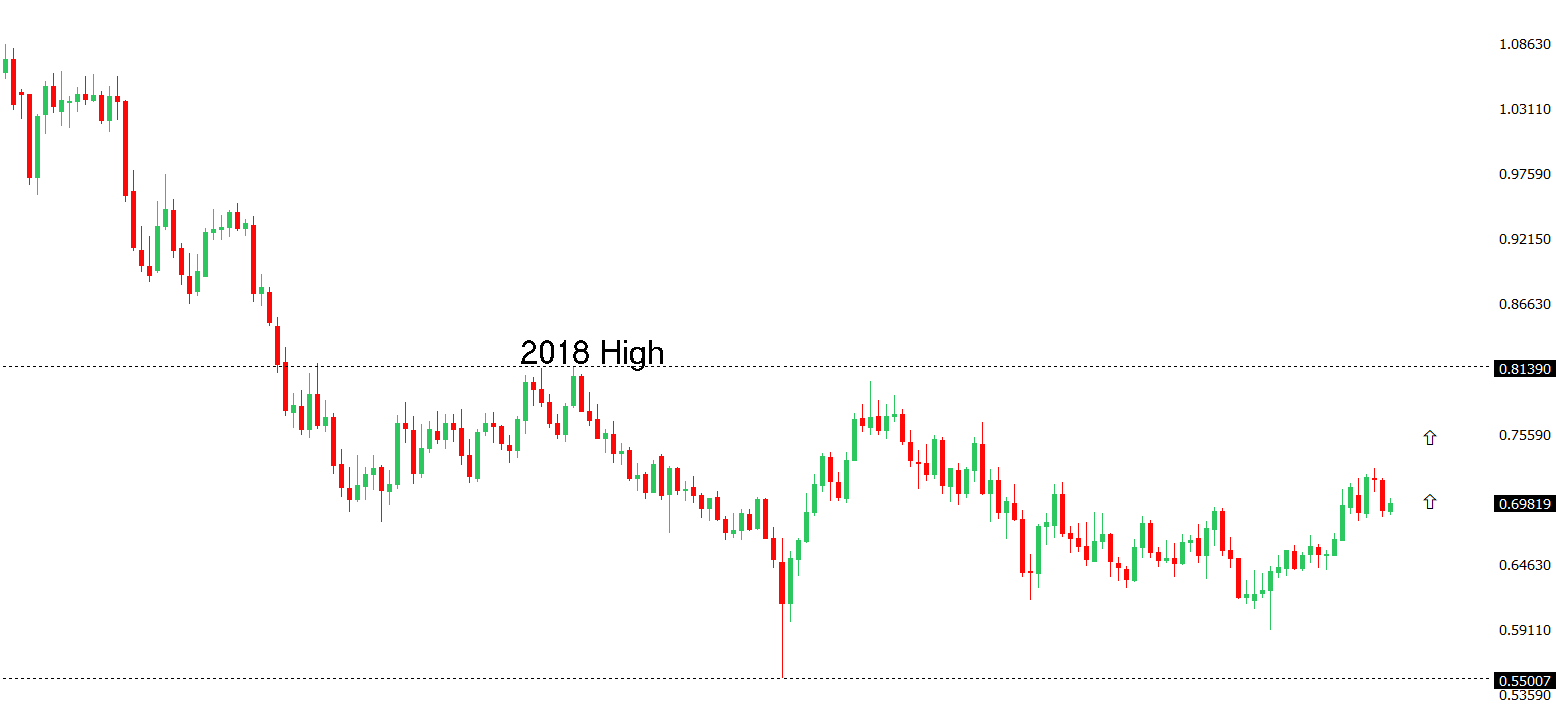 | ||
| R2 0.7089 - 15 June high - Strong R1 0.7027 - 21 July high - Medium S1 0.6912 - 14 July low - Medium S2 0.6865 - 30 June low - Strong | ||
| AUDUSD: fundamental overview | ||
| The Australian dollar strengthened after Australia’s June labor market report smashed expectations, reinforcing the view that the Reserve Bank of Australia could keep a hawkish bias despite having paused at its June meeting. Employment surged by 76,300, far above the 15,000 expected, while the unemployment rate held steady at 4.4% and participation climbed to a record 67.0%, prompting a rally in the Australian dollar and a rise in short-dated Australian bond yields as markets modestly repriced the risk of an August rate hike. Even so, the details of the report paint a more balanced picture, with quarterly unemployment still above the RBA’s own forecast and underemployment and underutilization remaining elevated, suggesting there is still underlying slack in the labor market. As a result, while the blowout jobs report keeps an August rate increase firmly on the table, it is not yet enough to make another RBA hike the base case. Beyond domestic data, broader moves in the Australian dollar continue to be influenced by US dollar strength, global risk sentiment and geopolitical developments in the Middle East. | ||
| Suggested reading | ||
| Is the Equity Risk Premium Dead?, A. Roth, Morningstar (July 21, 2026) Does The Financing For The AI Buildout Compute?, D. Painter, Palladium (July 20, 2026) | ||