


 | ||
| 1st October 2026 | view in browser | ||
| Yields refuse to read the inflation memo | ||
| The dollar remains supported by elevated US yields, technology earnings are lifting equities selectively, and stalled US-Iran talks keep energy risks in focus ahead of key US data and central bank commentary. | ||
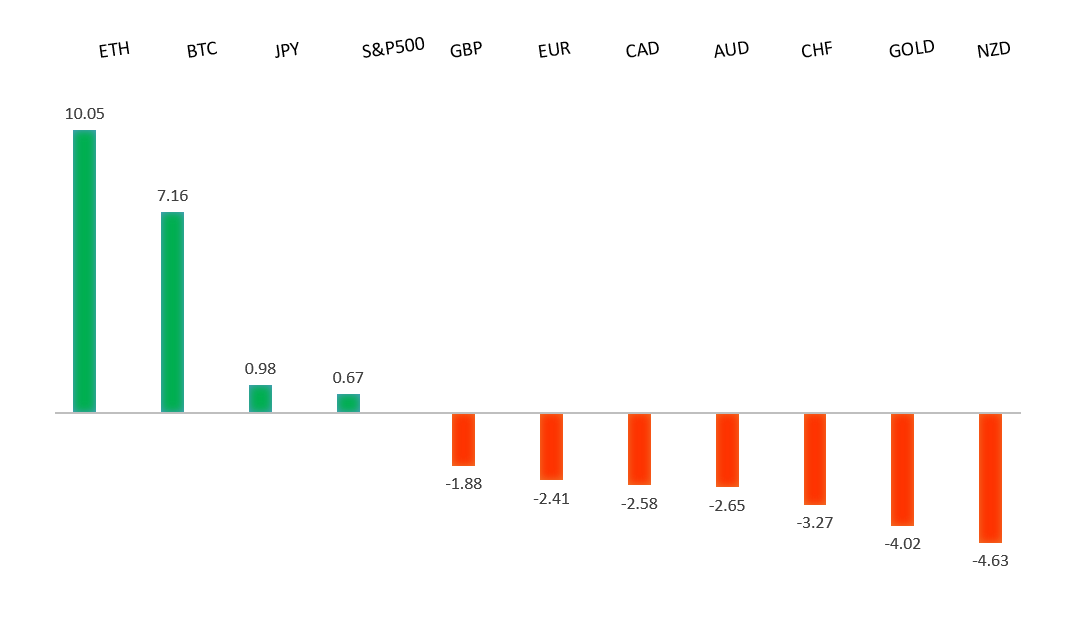
| Performance chart 30day v. USD (%) | ||
 | ||
| Technical & fundamental highlights | ||
| EURUSD: technical overview | ||
| The Euro outlook remains constructive with higher lows sought out on dips in favor of the next major upside extension targeting the 2021 high at 1.2350. Setbacks should be exceptionally well supported ahead of 1.1300. | ||
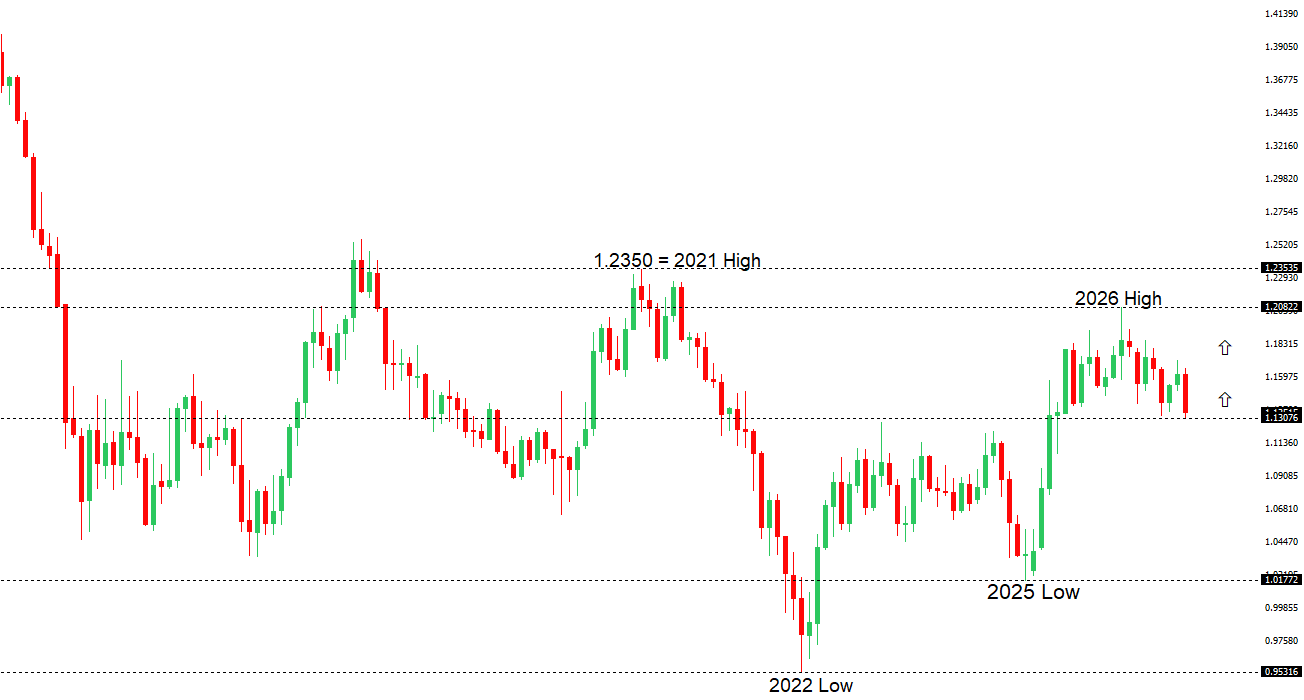 | ||
| R2 1.1498 - 17 September high - Medium R1 1.1412 - 25 September high - Medium S1 1.1312 - 29 September/2026 low - Strong S2 1.1300 - Figure - Strong | ||
| EURUSD: fundamental overview | ||
| The euro remains under pressure as elevated US Treasury yields support the dollar, despite softer US inflation reducing expectations for an immediate Fed rate hike. Longer-term borrowing costs remain high, while hawkish Fed commentary keeps further tightening in play. On the European side, Lagarde’s call for a measured response to energy-driven inflation has tempered expectations for aggressive ECB action, particularly as higher bond yields already threaten growth and there is little evidence of broader second-round price pressures. We see this relative policy backdrop continuing to weigh on the euro, with US jobless claims, manufacturing data and Fed commentary the next catalysts for shifts in dollar demand. | ||
| GBPUSD: technical overview | ||
| The Pound remains exceptionally well supported on dips into the 1.3000 area, with the price largely consolidating above the psychological barrier and previous resistance turned support in the form of the 2023 high. Look for the market to continue be well supported on dips ahead of the next major upside extension through the yearly high at 1.3870 and towards a retest of the 2018 high at 1.4377 further up. Only a monthly close below 1.3000 negates. | ||
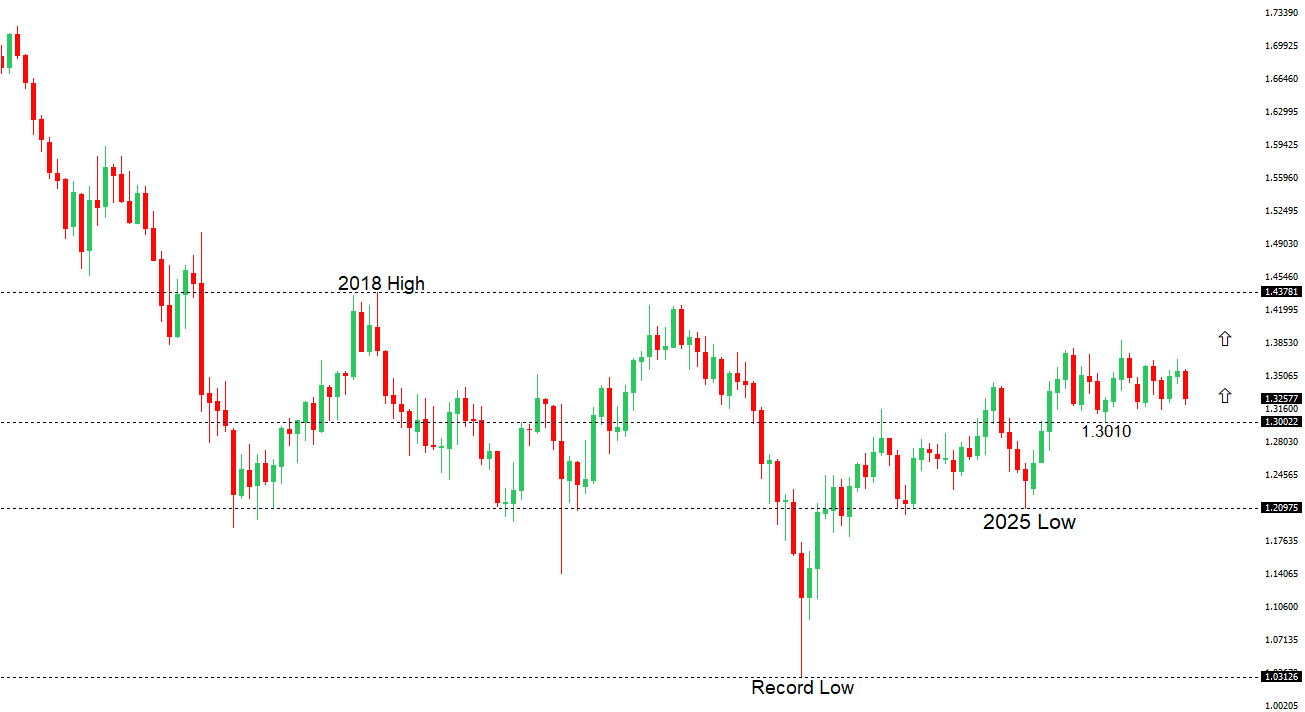 | ||
| R2 1.3407 - 17 September high - Medium R1 1.3312 - 30 September high - Medium S1 1.3202 - 29 September low - Medium S2 1.3140 - 24 June/2026 low - Strong | ||
| GBPUSD: fundamental overview | ||
| Sterling is edging lower against the dollar as hawkish Federal Reserve signals temper the relief from softer US PCE inflation, with Kashkari continuing to favor further rate increases. The UK backdrop has nevertheless improved, with an upward revision to second-quarter growth reinforcing expectations for a Bank of England hike and helping the pound outperform the euro. However, Alan Taylor’s view that tightening is not yet compelling without clearer evidence of energy inflation spreading through the economy highlights uncertainty over how much tightening the BoE will ultimately deliver. US jobless claims and further Fed commentary are the next catalysts for dollar sentiment and relative rate expectations. | ||
| USDJPY: technical overview | ||
| The recent breakdown below 155.00 suggests the market could be on the verge of a bigger structural shift, with the possibility for an end to a longer-term uptrend and the start to a period of persistent weakness. Critical support now comes in the form of the 2026 low from January at 151.97, with a drop below to strengthen the bearish outlook and open the door for a major downside extension targeting the 2024 low at 139.58. The market would need to get back above 160.00 to take the immediate pressure off the downside. | ||
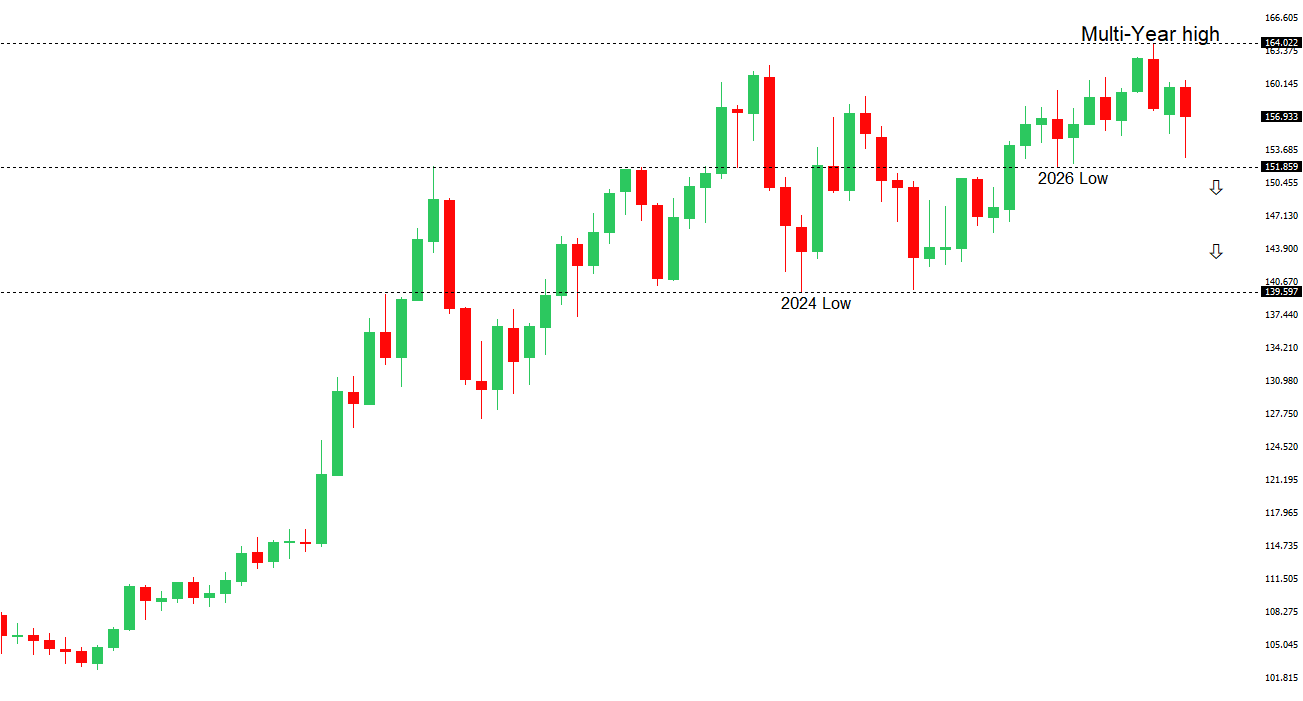 | ||
| R2 159.04 - 24 September high - Strong R1 158.40 - 1 October high - Medium S1 156.37 - 30 September low - Medium S2 155.33 - 17 September low - Medium | ||
| USDJPY: fundamental overview | ||
| The yen remains under pressure as elevated US Treasury yields and broad dollar demand outweigh increasingly hawkish signals from the Bank of Japan. Softer US PCE inflation has tempered expectations for another Fed hike in October, but has provided little relief from the global bond sell-off as energy-related inflation risks and fiscal concerns keep yields elevated. Meanwhile, the BoJ’s September Summary of Opinions showed some policymakers favoring faster tightening, while stronger Japanese business confidence reinforced the case for further rate increases. However, uncertainty over an immediate follow-up hike in October has limited support for the yen, leaving the US yield backdrop as the dominant near-term driver. | ||
| AUDUSD: technical overview | ||
| There are signs of the formation of a longer-term base with the market recovering out from a meaningful longer-term support zone. The latest monthly close back above 0.7000 takes the big picture pressure off the downside and strengthens the case for a bottom, with the focus now on a push towards 0.8000. Setbacks should now be well supported ahead of 0.6700. | ||
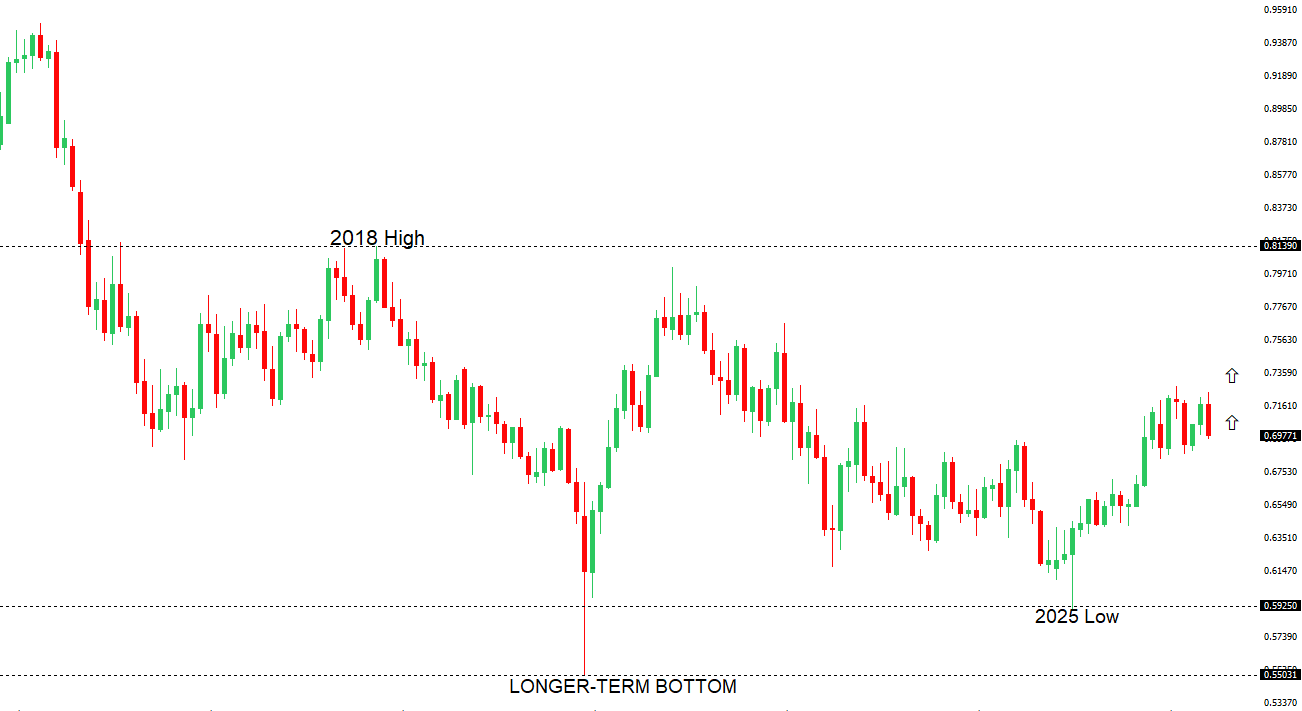 | ||
| R2 0.7142 - 15 September high - Strong R1 0.7046 - 24 September high - Medium S1 0.6940 - 1 October low - Medium S2 0.6922 - 29 July low - Strong | ||
| AUDUSD: fundamental overview | ||
| The Australian dollar is outperforming most major peers as elevated domestic interest rates provide support, following the RBA’s fourth hike of the year to 4.60%. Persistent inflation keeps further tightening on the table, although Governor Bullock’s more cautious tone has encouraged some analysts to anticipate an extended pause as earlier hikes work through the economy. RBA Australia’s sharply narrower August trade surplus of A$495 million adds a softer domestic signal, while broad US dollar strength and elevated Treasury yields continue to limit gains against the greenback. Attention now turns to September’s US ISM manufacturing report, particularly its activity and prices components, for the next steer on Federal Reserve expectations and the direction of the dollar. | ||
| Suggested reading | ||
| Political Fix from the Labour Party conference, L. Fisher, Financial Times (September 30, 2026) Gathering Clouds over the Eurozone Economy, D. Lachman, AEI (September 28, 2026) | ||