


Next 24 hours: Don't forget about month end flow
Today’s report: Don't fight the Fed Chair
We saw a lot of muscle flexing last week, a lot of that flexing to offset worry about the need for monetary policy to be tightening up. And that flexing came from opposite sides of the world, with both the Fed and PBOC letting financial markets know that conditions would remain favorable for investors.
Wake-up call
- import prices
- USD retreat
- Japanese inflation
- Record stocks
- soft data
- Macro themes
- Stocks vulnerable
- Dealers report
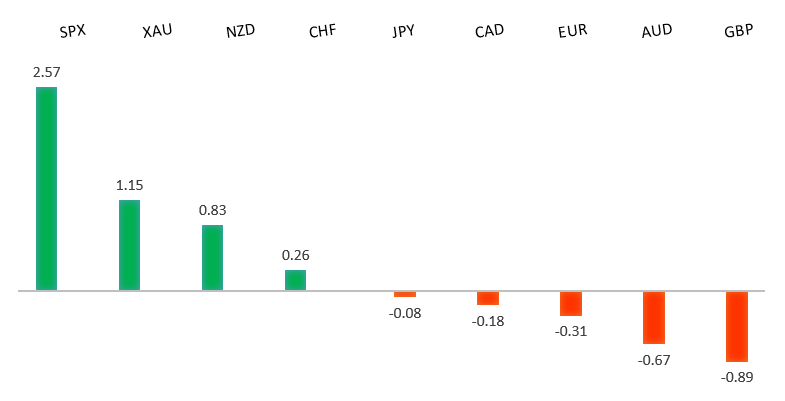
Peformance chart: 30 Day Performance vs. US dollar (%)
Suggested reading
- The Communist Dotcom Bubble Is a Dead Giveaway, M. Brooker, Bloomberg (August 26, 2021)
- Highlights of a Webinar on Afghanistan, K. Manson, Financial Times (August 26, 2021)
Chart talk: Technical & fundamental highlights
Choose pair:
EURUSD – technical overview
The market has been looking for a higher low since topping out in 2021 up at 1.2350. Ideally, setbacks continue to be well supported down towards 1.1600 in favour of the next major upside extension back through 1.2350 and towards a retest of the 2018 high at 1.2555 further up. Only a weekly close below 1.1600 would force a rethink.EURUSD – fundamental overview
German import prices were up 15% in July, the most in 40 years. This along with the ongoing surge in investor risk appetite helped to support the Euro into last week's close. Key standouts on Monday’s calendar come in the form of Aussie business inventories, Eurozone sentiment, German inflation, the Canada current account, US pending home sales, and Dallas Fed manufacturing.EURUSD - Technical charts in detail
GBPUSD – technical overview
The market is in a corrective phase in the aftermath of the run to fresh 2021 and multi-month highs. At this stage, additional setbacks should be limited to the 1.3500 area ahead of the next major upside extension towards a retest and break of critical resistance in the form of the 2018 high.GBPUSD – fundamental overview
All of that strong demand for the Pound into the end of last week was more about broad based US Dollar weakness than anything else. Key standouts on Monday’s calendar come in the form of Aussie business inventories, Eurozone sentiment, German inflation, the Canada current account, US pending home sales, and Dallas Fed manufacturing.USDJPY – technical overview
The longer-term trend is bearish despite the recent run higher. Look for additional upside to be limited, with scope for a topside failure and bearish resumption back down towards the 100.00 area. It would take a clear break back above 113.00 to negate the outlook.USDJPY – fundamental overview
The was in demand as the week closed out, despite the extended record run in US equities. A lot of the move was attributed to broad based US Dollar selling, while some assigned the price action to above forecast Japanese inflation data. Key standouts on Monday’s calendar come in the form of Japan retail sales, Aussie business inventories, Eurozone sentiment, German inflation, the Canada current account, US pending home sales, and Dallas Fed manufacturing.AUDUSD – technical overview
The Australian Dollar has been in the process of a healthy correction following the impressive run towards a retest of the 2018 high earlier this year. At this stage, there is risk for additional declines, though setbacks are expected to be well supported down into the 0.7000 area.AUDUSD – fundamental overview
US equities extended their record run, the PBOC and Fed flexed their dovish policies and iron ore was up 5%. All of this helped to drive the strong Aussie rebound into the weekly close. Key standouts on Monday’s calendar come in the form of Aussie business inventories, Eurozone sentiment, German inflation, the Canada current account, US pending home sales, and Dallas Fed manufacturing.USDCAD – technical overview
Finally signs of a major bottom in the works after a severe decline from the 2020 high. A recent weekly close back above 1.2500 encourages the constructive outlook and opens the door for a push back towards next critical resistance in the 1.3000 area. Any setbacks should be well supported into the 1.2200s.USDCAD – fundamental overview
The Canadian Dollar recovered into the weekly close on the back of the broad based selling in the US Dollar. However, a drop in Canada industrial product prices did result in some Loonie underperformance relative to its peers. Key standouts on Monday’s calendar come in the form of Aussie business inventories, Eurozone sentiment, German inflation, the Canada current account, US pending home sales, and Dallas Fed manufacturing.NZDUSD – technical overview
The market has entered a period of consolidation after running up to a yearly and multi-month high. At this stage, there is still room for deeper setbacks into the 0.6500-0.6800 area before we see an attempt at a higher low and resumption of upside pressure.NZDUSD – fundamental overview
An extended lockdown in New Zealand didn't hurt the Kiwi rate on Friday, with the currency paying more attention to the record run in US stocks and broad based declines in the US Dollar. Key standouts on Monday’s calendar come in the form of Aussie business inventories, Eurozone sentiment, German inflation, the Canada current account, US pending home sales, and Dallas Fed manufacturing.US SPX 500 – technical overview
Longer-term technical studies are looking quite exhausted and the market is showing signs of wanting to roll over after racing to another record high. Look for rallies to be well capped above 4500, with a break back below 4353 to strengthen the outlook.US SPX 500 – fundamental overview
We're trading just off fresh record highs, and yet, with so little room for additional central bank accommodation, given an already depressed interest rate environment, the prospect for sustainable runs to the topside on easy money policy incentives and government stimulus, should no longer be as enticing to investors. Meanwhile, ongoing worry associated with coronavirus fallout and risk of rising inflation should weigh more heavily on investor sentiment into the second half of 2021.GOLD (SPOT) – technical overview
The 2019 breakout above the 2016 high at 1375 was a significant development, opening the door for fresh record highs and an acceleration beyond the next major psychological barrier at 2000. Setbacks should now be well supported above 1600.GOLD (SPOT) – fundamental overview
The yellow metal continues to be well supported on dips with solid demand from medium and longer-term accounts. These players are more concerned about exhausted monetary policy, extended global equities, and coronavirus fallout. All of this should keep the commodity well supported, with many market participants also fleeing to the hard asset as the grand dichotomy of record high equities and record low yields comes to an unnerving climax.