


Today’s report: What will Jerome say?
On Thursday, we had highlighted the slowdown in bullish momentum. And as things played out, this slowdown triggered a round of profit taking and risk off flow.
Wake-up call
- confidence dip
- auto production
- two-way flow
- extended lockdown
- commodities complex
- risk off
- Stocks vulnerable
- Dealers report
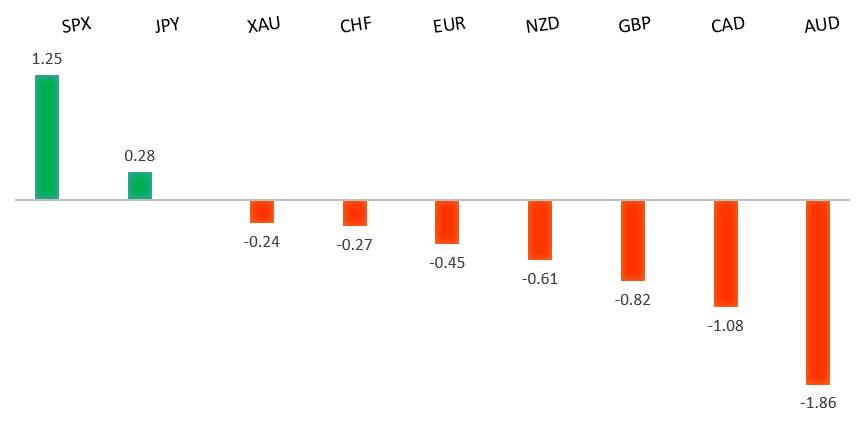
Peformance chart: 30 Day Performance vs. US dollar (%)
Suggested reading
- Even Covid Can’t Stop Qantas Flying Too Close to the Sun, D. Fickling, Bloomberg (August 26, 2021)
- Skin in the Game: Jerome Powell's Portfolio Incentives, D. Grice, The Market (August 25, 2021)
Chart talk: Technical & fundamental highlights
Choose pair:
EURUSD – technical overview
The market has been looking for a higher low since topping out in 2021 up at 1.2350. Ideally, setbacks continue to be well supported down towards 1.1600 in favour of the next major upside extension back through 1.2350 and towards a retest of the 2018 high at 1.2555 further up. Only a weekly close below 1.1600 would force a rethink.EURUSD – fundamental overview
The Euro was in mild retreat mode on Thursday. A combination of risk off flow and softer German confidence reads factored into the price action. The ECB Minutes showed a revision to rate guidance but didn't have any impact on price. Key standouts on today’s calendar come in the form of Aussie retail sales, German import prices, Canada producer prices, US personal income and spending, US core PCE, Michigan sentiment, and a Jerome Powell speech from Jackson Hole.EURUSD - Technical charts in detail
GBPUSD – technical overview
The market is in a corrective phase in the aftermath of the run to fresh 2021 and multi-month highs. At this stage, additional setbacks should be limited to the 1.3500 area ahead of the next major upside extension towards a retest and break of critical resistance in the form of the 2018 high.GBPUSD – fundamental overview
UK auto production data was a scare for the Pound on Thursday, coming in at its lowest levels in 65 years. This along with risk off flow factored into Sterling offers. Key standouts on today’s calendar come in the form of Aussie retail sales, German import prices, Canada producer prices, US personal income and spending, US core PCE, Michigan sentiment, and a Jerome Powell speech from Jackson Hole.USDJPY – technical overview
The longer-term trend is bearish despite the recent run higher. Look for additional upside to be limited, with scope for a topside failure and bearish resumption back down towards the 100.00 area. It would take a clear break back above 113.00 to negate the outlook.USDJPY – fundamental overview
The Yen has been mildly offered of late, though we haven't seen much in the way of movement. On the one side, we've seen Yen selling as the Japanese government maintains its economic assessment. On the other side, setbacks have been mild with risk off flow playing into some Yen demand into dips on Thursday. Key standouts on today’s calendar come in the form of Aussie retail sales, German import prices, Canada producer prices, US personal income and spending, US core PCE, Michigan sentiment, and a Jerome Powell speech from Jackson Hole.AUDUSD – technical overview
The Australian Dollar has been in the process of a healthy correction following the impressive run towards a retest of the 2018 high earlier this year. At this stage, there is risk for additional declines, though setbacks are expected to be well supported down into the 0.7000 area.AUDUSD – fundamental overview
The Australian Dollar took a hit on Thursday, partially from the news of the virus spread in Australia and extension of the lockdown through September 10th, and partially because of broader risk off flow. Key standouts on today’s calendar come in the form of Aussie retail sales, German import prices, Canada producer prices, US personal income and spending, US core PCE, Michigan sentiment, and a Jerome Powell speech from Jackson Hole.USDCAD – technical overview
Finally signs of a major bottom in the works after a severe decline from the 2020 high. A recent weekly close back above 1.2500 encourages the constructive outlook and opens the door for a push back towards next critical resistance in the 1.3000 area. Any setbacks should be well supported into the 1.2200s.USDCAD – fundamental overview
The Canadian Dollar was sold on Thursday as it tracked lower with the commodities complex and felt the heat from a downturn in risk sentiment. Canada data was also soft as reflected through the CFIB business barometer. Key standouts on today’s calendar come in the form of Aussie retail sales, German import prices, Canada producer prices, US personal income and spending, US core PCE, Michigan sentiment, and a Jerome Powell speech from Jackson Hole.NZDUSD – technical overview
The market has entered a period of consolidation after running up to a yearly and multi-month high. At this stage, there is still room for deeper setbacks into the 0.6500-0.6800 area before we see an attempt at a higher low and resumption of upside pressure.NZDUSD – fundamental overview
Selling kicked back into the New Zealand Dollar after an impressive rebound from some more hawkish expectations for the RBNZ outlook. And while Kiwi did outperform relative to the other commodity currencies, it couldn't avoid weakness from broad based risk off flow. Key standouts on today’s calendar come in the form of Aussie retail sales, German import prices, Canada producer prices, US personal income and spending, US core PCE, Michigan sentiment, and a Jerome Powell speech from Jackson Hole.US SPX 500 – technical overview
Longer-term technical studies are looking quite exhausted and the market is showing signs of wanting to roll over after racing to another record high. Look for rallies to be well capped above 4500, with a break back below 4353 to strengthen the outlook.US SPX 500 – fundamental overview
We're trading just off fresh record highs, and yet, with so little room for additional central bank accommodation, given an already depressed interest rate environment, the prospect for sustainable runs to the topside on easy money policy incentives and government stimulus, should no longer be as enticing to investors. Meanwhile, ongoing worry associated with coronavirus fallout and risk of rising inflation should weigh more heavily on investor sentiment into the second half of 2021.GOLD (SPOT) – technical overview
The 2019 breakout above the 2016 high at 1375 was a significant development, opening the door for fresh record highs and an acceleration beyond the next major psychological barrier at 2000. Setbacks should now be well supported above 1600.GOLD (SPOT) – fundamental overview
The yellow metal continues to be well supported on dips with solid demand from medium and longer-term accounts. These players are more concerned about exhausted monetary policy, extended global equities, and coronavirus fallout. All of this should keep the commodity well supported, with many market participants also fleeing to the hard asset as the grand dichotomy of record high equities and record low yields comes to an unnerving climax.