


Today’s report: End of week reflections
We’re set to close out the final week of full trade for 2021 and we’ve just come through some major central bank decisions from the Fed, BOE, ECB and BOJ. The Fed set the tone early in the week with its hawkish leaning communication.
Wake-up call
- ECB holds
- BOE surprises
- BOJ decision
- Dovish comments
- Trade data
- NZDUSDOffers return as risk comes off
- Stocks vulnerable
- Dealers report
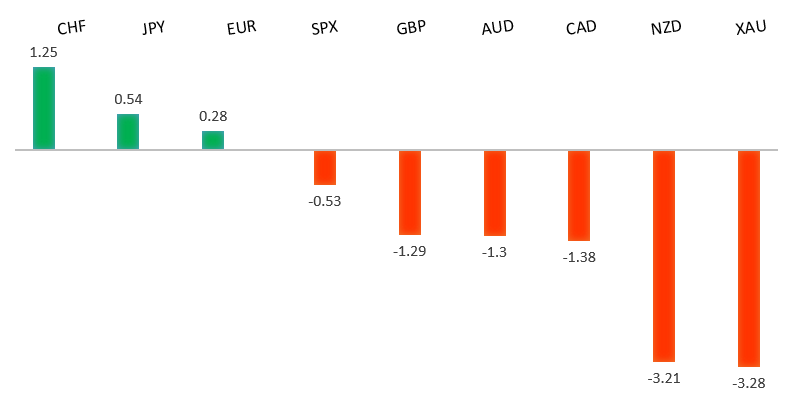
Peformance chart: 30 Day Performance vs. US dollar (%)
Suggested reading
- Adding in Inflation, 2021 Is Ending Much as 2020 Began, J. Authers, Bloomberg (December 17, 2021)
- Nick Clegg's First Interview in the Metaverse, H. Mance, Financial Times (December 16, 2021)
Chart talk: Technical & fundamental highlights
Choose pair:
EURUSD – technical overview
Setbacks have extended to retest the critical 61.8% fib retrace off the 2020 low to 2021 high move. Technical studies are now tracking in extended territory on the weekly chart, warning of the need for a corrective bounce ahead. Look for the market to hold up on a weekly close basis above the 61.8% fib retrace around 1.1275. Back above 1.1465 strengthens outlook. Weekly close below 1.1275 negates.EURUSD – fundamental overview
The net outcome of the ECB decision was that the central bank held steady on rates while maintaining an accommodative bias. Key standouts on today’s calendar include German producer prices, UK retail sales, German Ifo reads, Eurozone construction output, Eurozone inflation, and the BOE quarterly bulletin.EURUSD - Technical charts in detail
GBPUSD – technical overview
The market is in a correction phase in the aftermath of the run to fresh multi-month highs earlier this year. At this stage, additional setbacks should be limited to the 1.3000 area ahead of the next major upside extension towards a retest and break of critical resistance in the form of the 2018 high.GBPUSD – fundamental overview
The Pound has rallied in the aftermath of the BOE decision in which the central bank surprised many with a 15bp hike. Key standouts on today’s calendar include German producer prices, UK retail sales, German Ifo reads, Eurozone construction output, Eurozone inflation, and the BOE quarterly bulletin.USDJPY – technical overview
The longer-term trend is bearish despite the recent run higher. Look for additional upside to be limited, with scope for a topside failure and bearish resumption back down towards the 100.00 area. It would take a clear break back above 116.00 to negate the outlook.USDJPY – fundamental overview
No major surprises from the BOJ on Friday. In contrast to the surprise BOE hike, and hawkish intentions of the Fed, the Japanese central bank kept policy on hold. Key standouts on today’s calendar include German producer prices, UK retail sales, German Ifo reads, Eurozone construction output, Eurozone inflation, and the BOE quarterly bulletin.AUDUSD – technical overview
The Australian Dollar has been in the process of a healthy correction following the impressive run towards a retest of the 2018 high earlier this year. At this stage, the correction is starting to look stretched and setbacks should be well supported above 0.7000 on a weekly close basis. A weekly close below 0.7000 will force a bearish shift.AUDUSD – fundamental overview
Strong Aussie jobs data has been offset by dovish comments from RBA Orr who said the base case outlook did not project rate hikes next year. Meanwhile, risk assets have come back under pressure into Friday. Key standouts on today’s calendar include German producer prices, UK retail sales, German Ifo reads, Eurozone construction output, Eurozone inflation, and the BOE quarterly bulletin.USDCAD – technical overview
Finally signs of a major bottom in the works after a severe decline from the 2020 high. A recent weekly close back above 1.2500 encourages the constructive outlook and opens the door for a push back towards next critical resistance in the 1.3000 area. Any setbacks should be well supported into the 1.2200s.USDCAD – fundamental overview
The Canadian Dollar is coming off a solid Thursday session in which it rallied on the back of impressive trade data and rallying oil. Key standouts on today’s calendar include German producer prices, UK retail sales, German Ifo reads, Eurozone construction output, Eurozone inflation, and the BOE quarterly bulletin.NZDUSD – technical overview
The market has entered a period of intense correction after running up to a yearly and multi-month high. Back below 0.6700 would suggest a more significant bearish structural shift.NZDUSD – fundamental overview
The New Zealand Dollar has been a laggard on the combination of a less hawkish RBNZ trajectory and some soft local data. But we have seen some demand into latter half of the week on post FOMC USD selling and after New Zealand GDP data wasn't as bad as expected. Still with risk assets under pressure into Friday, offers have worked their way back in. Key standouts on today’s calendar include German producer prices, UK retail sales, German Ifo reads, Eurozone construction output, Eurozone inflation, and the BOE quarterly bulletin.US SPX 500 – technical overview
Longer-term technical studies are looking quite exhausted and the market is showing signs of wanting to roll over after racing to another record high. At the same time, the latest breakout above 4600 introduces the possibility for the next major upside extension through 4800. At this stage, it will take a break back below 4500 to take the immediate pressure off the topside.US SPX 500 – fundamental overview
We're trading just off fresh record highs, and yet, with so little room for additional central bank accommodation, given an already depressed interest rate environment, the prospect for sustainable runs to the topside on easy money policy incentives and government stimulus, should no longer be as enticing to investors. Meanwhile, ongoing worry associated with coronavirus fallout and risk of rising inflation should weigh more heavily on investor sentiment into Q1 2022.GOLD (SPOT) – technical overview
The 2019 breakout above the 2016 high at 1375 was a significant development, opening the door for fresh record highs and an acceleration beyond the next major psychological barrier at 2000. Setbacks should now be well supported above 1600.GOLD (SPOT) – fundamental overview
The yellow metal continues to be well supported on dips with solid demand from medium and longer-term accounts. These players are more concerned about exhausted monetary policy, extended global equities, and coronavirus fallout. All of this should keep the commodity well supported, with many market participants also fleeing to the hard asset as the grand dichotomy of record high equities and record low yields comes to an unnerving climax.