


Next 24 hours: Euro closing in on yearly low
Today’s report: Euro at lowest levels since early April
There was some early Monday fallout in commodities on carryover from Friday’s US jobs report, but things stabilized rather quickly with these markets consolidating for the remainder of the day off their lows.
Wake-up call
- investor confidence
- business closures
- holiday trade
- Commodities decline
- Oil slide
- rate expectations
- Stocks vulnerable
- Dealers report
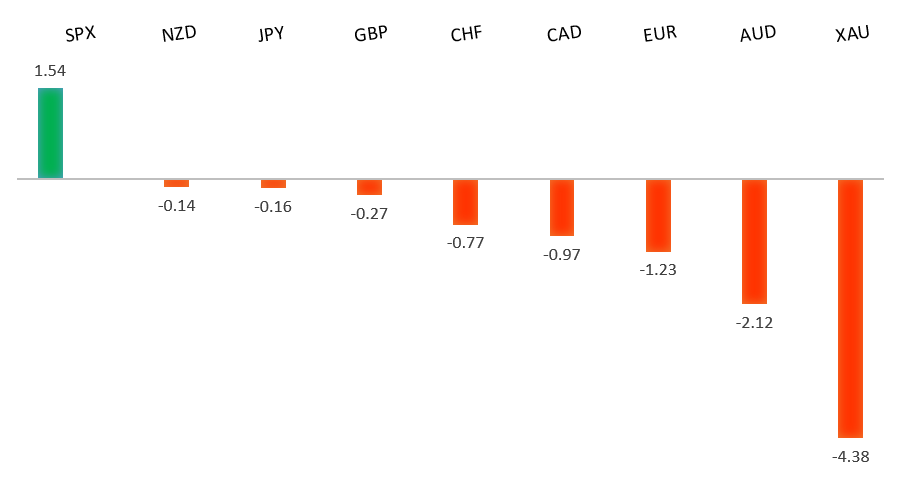
Peformance chart: 30 Day Performance vs. US dollar (%)
Suggested reading
- Diversifying Your Portfolio Isn't Zesty, But It Works, N. Kaissar, Bloomberg (August 9, 2021)
- What Investors Can Learn From 2021’s Frothy Pockets, Fisher Investments (August 6, 2021)
Chart talk: Technical & fundamental highlights
Choose pair:
EURUSD – technical overview
The market has been looking for a higher low since topping out in 2021 up at 1.2350. Ideally, setbacks continue to be well supported down towards 1.1600 in favour of the next major upside extension back through 1.2350 and towards a retest of the 2018 high at 1.2555 further up. Only a weekly close below 1.1600 would force a rethink.EURUSD – fundamental overview
The Euro extended its recent run of declines, despite warnings from ECB Weidmann about inflation picking up faster than expected. Data out of the zone came in mixed, though it seemed as though there was more sensitivity to the dump in Eurozone investor confidence. Key standouts on Tuesday’s calendar Eurozone and German ZEW sentiment reads, and a Fed Evans speech.EURUSD - Technical charts in detail
GBPUSD – technical overview
The market is in a corrective phase in the aftermath of the run to fresh 2021 and multi-month highs. At this stage, additional setbacks should be limited to the 1.3500 area ahead of the next major upside extension towards a retest and break of critical resistance in the form of the 2018 high.GBPUSD – fundamental overview
The Pound was weighed down on Monday from the political spat between PM Johnson and Chancellor Sunak, along with the news of a 43% rise in business closures in Q2. Key standouts on Tuesday’s calendar Eurozone and German ZEW sentiment reads, and a Fed Evans speech.USDJPY – technical overview
The longer-term trend is bearish despite the recent run higher. Look for additional upside to be limited, with scope for a topside failure and bearish resumption back down towards the 100.00 area. It would take a clear break back above 113.00 to negate the outlook.USDJPY – fundamental overview
Holiday closures resulted in thin trade on Monday, though we did see some initial Yen demand from the news of Goldman Sachs downgrading its Q3 China GDP estimate. In the end, these Yen gains were more than offset by a wave of broad US Dollar demand. Key standouts on Tuesday’s calendar Eurozone and German ZEW sentiment reads, and a Fed Evans speech.AUDUSD – technical overview
The Australian Dollar has been in the process of a healthy correction following the impressive run towards a retest of the 2018 earlier this year. At this stage, there is risk for additional declines, though setbacks are expected to be well supported down into the 0.7000 area.AUDUSD – fundamental overview
Covid continues to weigh on the Australian Dollar despite an easing of restrictions in Victoria. Cases remain elevated in Sydney and Melbourne. We also saw downside pressure from the latest slide in commodities prices. Key standouts on Tuesday’s calendar Eurozone and German ZEW sentiment reads, and a Fed Evans speech.USDCAD – technical overview
Finally signs of a major bottom in the works after a severe decline from the 2020 high. The weekly close back above 1.2500 encourages the constructive outlook and opens the door for a push back towards next critical resistance in the 1.3000 area. Any setbacks should be well supported into the 1.2200s.USDCAD – fundamental overview
The Loonie remains under pressure into Tuesday, with the latest round of selling coming from intense setbacks in metals and oil. Key standouts on Tuesday’s calendar Eurozone and German ZEW sentiment reads, and a Fed Evans speech.NZDUSD – technical overview
The market has entered a period of consolidation after running up to a yearly and multi-month high. At this stage, there is still room for deeper setbacks into the 0.6500-0.6800 area before we see an attempt at a higher low and resumption of upside pressure.NZDUSD – fundamental overview
The New Zealand Dollar has been well capped of late and is finding more offers as the market becomes less confident the RBNZ will be able raise rates as quickly as they had thought. Commodities have also been under pressure adding to the strain. Key standouts on Tuesday’s calendar Eurozone and German ZEW sentiment reads, and a Fed Evans speech.US SPX 500 – technical overview
Longer-term technical studies are looking quite exhausted and the market is showing signs of wanting to roll over after racing to another record high. Look for rallies to be well capped ahead of 4500, with a break back below 4139 to strengthen the outlook.US SPX 500 – fundamental overview
We're trading just off fresh record highs, and yet, with so little room for additional central bank accommodation, given an already depressed interest rate environment, the prospect for sustainable runs to the topside on easy money policy incentives and government stimulus, should no longer be as enticing to investors. Meanwhile, ongoing worry associated with coronavirus fallout and risk of rising inflation should weigh more heavily on investor sentiment into the second half of 2021.GOLD (SPOT) – technical overview
The 2019 breakout above the 2016 high at 1375 was a significant development, opening the door for fresh record highs and an acceleration beyond the next major psychological barrier at 2000. Setbacks should now be well supported above 1600.GOLD (SPOT) – fundamental overview
The yellow metal continues to be well supported on dips with solid demand from medium and longer-term accounts. These players are more concerned about exhausted monetary policy, extended global equities, and coronavirus fallout. All of this should keep the commodity well supported, with many market participants also fleeing to the hard asset as the grand dichotomy of record high equities and record low yields comes to an unnerving climax.