


Today’s report: Euro runs up after less dovish ECB
In our preview of the ECB decision, we warned the central bank may not be as dovish as the market had been pricing in the lead up, leaving the balance of risk tilted towards a higher Euro. Indeed, this is how things have played out.
Wake-up call
- less dovish
- big picture
- BOJ Tamura
- Gold surges
- Monetary policy
- economy stalls
- accommodative policy
- Macro themes
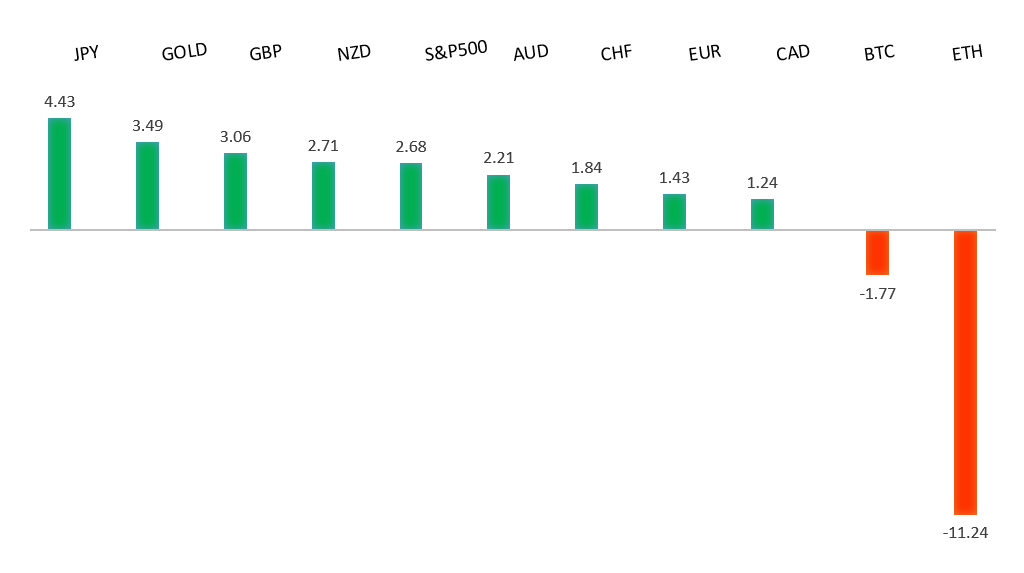
Peformance chart: 30-Day Performance vs. US dollar (%)
Suggested reading
- Why You Should Feel Good About The US Economy, C. Brown, Axios (September 12, 2024)
- What Do Stocks Do When the Fed Starts Cutting Rates?, S. Hansen, Morningstar (September 12, 2024)
Chart talk: Technical & fundamental highlights
Choose pair:
EURUSD – technical overview
The Euro has been in a multi-month consolidation since bottoming out in 2022. Setbacks have since been exceptionally well supported on dips below 1.0500, with a higher platform sought out ahead of the next major upside extension. Look for a push through the 2023 high at 1.1276 to strengthen the constructive outlook and extend the recovery run towards 1.2000. Only back below 1.0400 negates.EURUSD – fundamental overview
The ECB policy decision wasn't as dovish as many had been expecting. Indeed, the central bank went ahead and cut rates by 25 basis points. However, the upward revision to CPI forecasts caught many off guard, opening the door for a higher Euro on the post-event risk position adjustment. The ECB also went ahead and downgraded growth estimates. Key standouts on Friday’s calendar come from Eurozone industrial production, Canada wholesale sales, US import and export prices, Michigan sentiment, and an ECB Lagarde speech.EURUSD - Technical charts in detail
GBPUSD – technical overview
Signs have emerged of the market wanting to put in a longer-term base after collapsing to a record low in September 2022. The door is now open for the next major upside extension towards the 2018 high at 1.4377. Any setbacks should be well supported ahead of 1.2500.GBPUSD – fundamental overview
Absence of fresh fundamental catalysts out of the UK on Thursday left the Pound to trade higher on the back of this latest wave of Dollar selling and risk on flow. Key standouts on Friday’s calendar come from Eurozone industrial production, Canada wholesale sales, US import and export prices, Michigan sentiment, and an ECB Lagarde speech.USDJPY – technical overview
The market has entered a period of correction after extending the uptrend to a multi-year high through 160.00. Critical support comes in around 140.00, with only a monthly close below the barrier to compromise the bullish outlook. A higher low is ideally sought out above 140.00 in favor of a bullish continuation.USDJPY – fundamental overview
The Yen is already looking past this week's softer inflation data, instead focusing back in on the prospect for more BOJ rate hikes in Q4. BOJ Tamura comments could also be factoring after the central banker advocated for aggressive tightening. Key standouts on Friday’s calendar come from Eurozone industrial production, Canada wholesale sales, US import and export prices, Michigan sentiment, and an ECB Lagarde speech.AUDUSD – technical overview
There are signs of the potential formation of a longer-term base with the market trading down into a meaningful longer-term support zone. Only a monthly close below 0.6200 would give reason for rethink. Back above 0.6900 will take the big picture pressure off the downside and strengthen case for a bottom.AUDUSD – fundamental overview
Commodities have been racing higher, including a push in the price of gold to a record high. Meanwhile, the US Dollar has been getting sold and investor risk appetite is looking up, all factors that support a higher Australian Dollar into the end of the week. Key standouts on Friday’s calendar come from Eurozone industrial production, Canada wholesale sales, US import and export prices, Michigan sentiment, and an ECB Lagarde speech.USDCAD – technical overview
A sustained hold above 1.3000 over the past several months signals an end to a period of longer-term bearish consolidation and suggests the market is in the process of carving out a more significant longer-term base. Next key resistance now comes in up into the 1.4000 area, with a break to open a retest of the 2020 high just ahead of 1.4700. Setbacks should be very well supported down into the 1.3000 area.USDCAD – fundamental overview
The Canadian Dollar is clearly hung up on the more dovish Bank of Canada policy outlook. Thursday's improvement in Canada building permits and a healthy oil rebound have done nothing to inspire demand. Key standouts on Friday’s calendar come from Eurozone industrial production, Canada wholesale sales, US import and export prices, Michigan sentiment, and an ECB Lagarde speech.NZDUSD – technical overview
Overall pressure remains on the downside with the market continuing to stall out on runs up into the 0.6500 area. At the same time, there are some signs of the market wanting to put in a longer-term base. Ultimately, a break back above 0.6500 would be required to take the medium-term pressure off the downside and encourage this prospect. A monthly close below 0.5800 will intensify bearish price action.NZDUSD – fundamental overview
The New Zealand Dollar has done well with the broad based US Dollar selling, higher commodities, and risk on flow. At the same time, upside could be limited as the bell rings louder with respect for faster rate cuts as the New Zealand economy stalls. Key standouts on Friday’s calendar come from Eurozone industrial production, Canada wholesale sales, US import and export prices, Michigan sentiment, and an ECB Lagarde speech.US SPX 500 – technical overview
The longer term uptrend remains intact and dips continue to be exceptionally well supported. Critical support comes in at 5093, with only a break back below this level to compromise the structure and open the door for a more significant corrective decline. Until then, the focus remains on a retest and break back above the record high.US SPX 500 – fundamental overview
The US equities market remains exceptionally well supported in 2024 on the back of an ongoing expectation for more rate cuts than less going forward. Investors are feeling better about a soft landing in the US economy and this has also been accompanied by an accommodative adjustment of Fed policy. It will however be important to keep an eye on inflation, bigger picture economic data and geopolitical risk in the months ahead.GOLD (SPOT) – technical overview
The 2019 breakout above the 2016 high at 1375 was a significant development, opening the door for fresh record highs and this next major upside extension into the 2500-3000 area. Setbacks should now be well supported above 2300 on a monthly close basis.GOLD (SPOT) – fundamental overview
The yellow metal has pushed record highs in 2024 with solid demand from medium and longer-term accounts. These players are more concerned about inflation, geopolitical risk and a less upbeat global growth outlook. All of this should keep the commodity well supported over the coming months.