


Next 24 hours: Euro recovers, Pound stumbles
Today’s report: Euro struggling to find a bottom
The Euro is still struggling in the aftermath of a more hawkish leaning Fed communication and unsettling European election results. Looking ahead, key standouts on the calendar come from an ECB Lagarde speech, Eurozone wage growth, Canada housing starts, New York Empire manufacturing, and some Fed speak.
Wake-up call
- bearish positioning
- election risk
- machinery orders
- Tuesday's RBA
- Canadian equities
- NZIER downgrades
- Fed outlook
- Macro themes
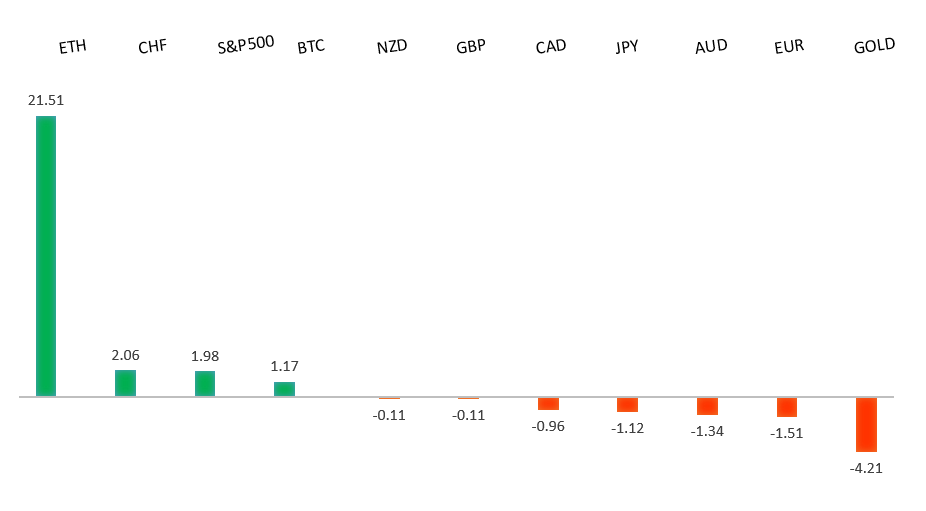
Peformance chart: 30-Day Performance vs. US dollar (%)
Suggested reading
- Sketchy Politics: the extinction election?, R. Shrimsley, Financial Times (June 14, 2024)
- China In 2035: Will China Go The Way of Japan?, J. Dreyer, Noema (June 11, 2024)
Chart talk: Technical & fundamental highlights
Choose pair:
EURUSD – technical overview
The Euro has been in a multi-month consolidation since bottoming out in 2022. Setbacks have since been exceptionally well supported on dips below 1.0500, with a higher platform sought out ahead of the next major upside extension. Look for a push through the 2023 high at 1.1276 to strengthen the constructive outlook and extend the recovery run towards 1.2000. Only back below 1.0400 negates.EURUSD – fundamental overview
We're now looking at the most bearish positioning in the Euro since November 2022 in the aftermath of the shakeup and uncertainty around the latest European election results. Clearly, all of this has been giving the Euro a hard time. Looking ahead, key standouts on the calendar come from an ECB Lagarde speech, Eurozone wage growth, Canada housing starts, New York Empire manufacturing, and some Fed speak.EURUSD - Technical charts in detail
GBPUSD – technical overview
Signs have emerged of the market wanting to put in a longer-term base after collapsing to a record low in September 2022. The door is now open for the next major upside extension towards the 2023 high at 1.3143. Any setbacks should be well supported ahead of 1.2000.GBPUSD – fundamental overview
UK election risk has pushed off BOE rate cut bets until at least August, which has been somewhat supportive of the Pound. The big focus for the Pound this week will be Wednesday's UK inflation data and Thursday's BOE decision. Looking ahead, key standouts on the calendar come from an ECB Lagarde speech, Eurozone wage growth, Canada housing starts, New York Empire manufacturing, and some Fed speak.USDJPY – technical overview
The market remains confined to a strong uptrend, most recently extending to a multi-year high through 160.00. Key support comes in at 151.95, with only a weekly close below to delay the constructive outlook.USDJPY – fundamental overview
On the data side, Japan core machinery orders contracted by less than expected. Overall, the market is now starting to think about the July BOJ meeting, expecting the central bank to move a little more to the hawkish side by way of rate hikes and reductions in the monthly bond purchases. This could help to slow the pace of Yen declines. Looking ahead, key standouts on the calendar come from an ECB Lagarde speech, Eurozone wage growth, Canada housing starts, New York Empire manufacturing, and some Fed speak.AUDUSD – technical overview
There are signs of the potential formation of a longer-term base with the market trading down into a meaningful longer-term support zone. Only a monthly close below 0.6200 would give reason for rethink. Back above 0.6900 will take the big picture pressure off the downside and strengthen case for a bottom.AUDUSD – fundamental overview
The Australian Dollar remains relatively subdued as it awaits tomorrow's RBA decision. As far as today goes, we saw some offsetting data out of China after industrial production was softer, but retail sales came in stronger. Looking ahead, key standouts on the calendar come from an ECB Lagarde speech, Eurozone wage growth, Canada housing starts, New York Empire manufacturing, and some Fed speak.USDCAD – technical overview
Above 1.3000 signals an end to a period of longer-term bearish consolidation and suggests the market is in the process of carving out a more significant longer-term base. Next key resistance now comes in up into the 1.4000 area. Setbacks should be very well supported down into the 1.3000 area.USDCAD – fundamental overview
There is a growing sense that bad news in Canada is now equal to bad news, which only adds to the strain on the Canadian Dollar as yield differentials suffer with the market continuing to push odds for a Bank of Canada rate cut in July. The Bank of Canada has added to the dovishness after seeing more signs underlying price pressures were easing. Canadian stock market performance is only adding to the pressure on the Canadian Dollar after the TSX took out the April low and is back down to levels from March. Looking ahead, key standouts on the calendar come from an ECB Lagarde speech, Eurozone wage growth, Canada housing starts, New York Empire manufacturing, and some Fed speak.NZDUSD – technical overview
Overall pressure remains on the downside with the market continuing to stall out on runs up into the 0.6500 area. At the same time, there are some signs of the market wanting to put in a longer-term base. Ultimately, a break back above 0.6500 would be required to take the medium-term pressure off the downside and encourage this prospect. A monthly close below 0.5800 will intensify bearish price action.NZDUSD – fundamental overview
The New Zealand Institute of Economic Research (NZIER) has issued its quarterly consensus forecasts, highlighted by a downgraded outlook for average annual GDP growth. Looking ahead, key standouts on the calendar come from an ECB Lagarde speech, Eurozone wage growth, Canada housing starts, New York Empire manufacturing, and some Fed speak.US SPX 500 – technical overview
Longer-term technical studies continue to look quite extended, begging for a deeper correction ahead. At the same time, the latest bullish breakout to a fresh record high beyond the 2024 high opens the door for the next measured move upside extension targeting the 5650 area. Key support comes in at 5194.US SPX 500 – fundamental overview
Though we have seen a healthy adjustment of investor expectations towards the amount of rate cuts in 2024, the market still hopes policy will end up erring more towards the investor friendly, accommodative side of things. This bet has kept stocks well bid into dips and consistently pushing record highs. Still, if there is a sense the Fed will need to be more sensitive towards erring on the side of higher rates, it could invite major disruption to the stock market.GOLD (SPOT) – technical overview
The 2019 breakout above the 2016 high at 1375 was a significant development, opening the door for fresh record highs and this next major upside extension into the 2500-3000 area. Setbacks should now be well supported above 2000 on a monthly close basis.GOLD (SPOT) – fundamental overview
The yellow metal has pushed record highs in 2024 with solid demand from medium and longer-term accounts. These players are more concerned about inflation, geopolitical risk and a less upbeat global growth outlook. All of this should keep the commodity well supported, with many market participants also fleeing to the hard asset as the grand dichotomy of record high equities and record low yields comes to an end.