


Next 24 hours: US yields continue to climb
Today’s report: Euro underperforms on German election result
It’s a risk on feel to start the week, though the price action has been mild thus far. US equity futures are tracking a little higher and the US Dollar a little lower overall.
Wake-up call
- German election
- Manpower shortages
- unwinding
- investor appetite
- OIL demand
- risk rebound
- Stocks vulnerable
- Dealers report
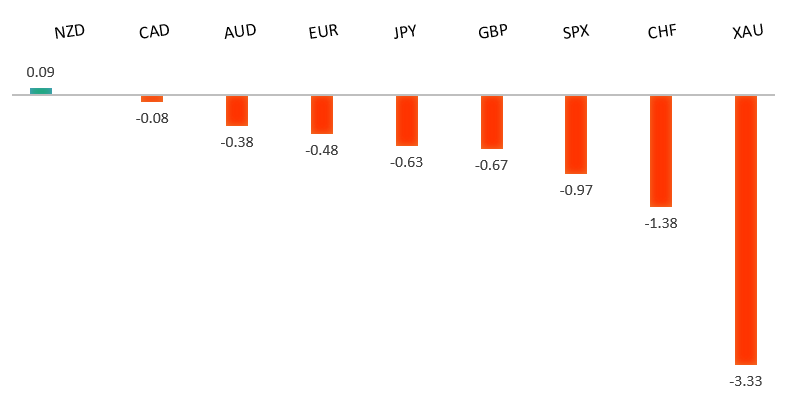
Peformance chart: 30 Day Performance vs. US dollar (%)
Suggested reading
- Everything is Getting Worse....So Buy Stocks, J. Authers, Bloomberg (September 27, 2021)
- Goldilocks is Dying, N. Roubini, Project Syndicate (September 21, 2021)
Chart talk: Technical & fundamental highlights
Choose pair:
EURUSD – technical overview
The market has been looking for a higher low since topping out in 2021 up at 1.2350. Ideally, setbacks continue to be well supported down towards 1.1600 in favour of the next major upside extension back through 1.2350 and towards a retest of the 2018 high at 1.2555 further up. Only a weekly close below 1.1600 would force a rethink.EURUSD – fundamental overview
The Euro is suffering into the new week from the weekend election results in Germany which show the center right party losing out in a tightly contested race. There is no clear majority here but the result does highlight an unsettling change for the Euro as Angela Merkel's reign comes to an end. We've also seen Euro selling on the back of last week's Fed decision which talked of higher inflation and the possibility for a rate hike in 2022. Key standouts on today’s calendar include an ECB Lagarde speech, US durable goods, Dallas Fed manufacturing, a BOE Bailey speech, and other Fed speak.EURUSD - Technical charts in detail
GBPUSD – technical overview
The market is in a consolidation phase in the aftermath of the run to fresh 2021 and multi-month highs. At this stage, additional setbacks should be limited to the 1.3500 area ahead of the next major upside extension towards a retest and break of critical resistance in the form of the 2018 high.GBPUSD – fundamental overview
UK virus death tolls and manpower shortages due to Brexit fallout have been weighing on the Pound into the new week. The gas shortage has also been a major issue and the PM is considering using the army to help overcome the crisis. Key standouts on today’s calendar include an ECB Lagarde speech, US durable goods, Dallas Fed manufacturing, a BOE Bailey speech, and other Fed speak.USDJPY – technical overview
The longer-term trend is bearish despite the recent run higher. Look for additional upside to be limited, with scope for a topside failure and bearish resumption back down towards the 100.00 area. It would take a clear break back above 113.00 to negate the outlook.USDJPY – fundamental overview
We saw a big selloff in the Yen in the second half of last week as safe haven trades were unwound, with risk markets back on the bid. Key standouts on today’s calendar include an ECB Lagarde speech, US durable goods, Dallas Fed manufacturing, a BOE Bailey speech, and other Fed speak.AUDUSD – technical overview
The Australian Dollar has been in the process of a healthy correction following the impressive run towards a retest of the 2018 high earlier this year. At this stage, there is risk for additional declines, though setbacks are expected to be well supported down into the 0.7000 area. Look for a weekly close above 0.7500 to force a shift in the structure.AUDUSD – fundamental overview
The Australian Dollar has managed to shrug off selling pressure from China's Evergrande and the recent Fed decision, instead focusing on demand coming from the broad based resurgence in risk appetite. Key standouts on today’s calendar include an ECB Lagarde speech, US durable goods, Dallas Fed manufacturing, a BOE Bailey speech, and other Fed speak.USDCAD – technical overview
Finally signs of a major bottom in the works after a severe decline from the 2020 high. A recent weekly close back above 1.2500 encourages the constructive outlook and opens the door for a push back towards next critical resistance in the 1.3000 area. Any setbacks should be well supported into the 1.2200s.USDCAD – fundamental overview
A rebound in OIL, uptick in US equities and hopes for US stimulus have all been supporting the Canadian Dollar in recent sessions. Key standouts on today’s calendar include an ECB Lagarde speech, US durable goods, Dallas Fed manufacturing, a BOE Bailey speech, and other Fed speak.NZDUSD – technical overview
The market has entered a period of consolidation after running up to a yearly and multi-month high. At this stage, rallies should be well capped and there is still room for deeper setbacks into the 0.6500-0.6800 area before we see an attempt at a higher low and resumption of upside pressure. Back above the April high at 0.7317 would be required to force a shift in the structure.NZDUSD – fundamental overview
Not a lot to talk about on the local front, with most of this latest Kiwi support coming from a rebound in global risk sentiment. Key standouts on today’s calendar include an ECB Lagarde speech, US durable goods, Dallas Fed manufacturing, a BOE Bailey speech, and other Fed speak.US SPX 500 – technical overview
Longer-term technical studies are looking quite exhausted and the market is showing signs of wanting to roll over after racing to another record high. Look for rallies to be well capped ahead of 4600, with a break back below 4353 to strengthen the outlook.US SPX 500 – fundamental overview
We're trading just off fresh record highs, and yet, with so little room for additional central bank accommodation, given an already depressed interest rate environment, the prospect for sustainable runs to the topside on easy money policy incentives and government stimulus, should no longer be as enticing to investors. Meanwhile, ongoing worry associated with coronavirus fallout and risk of rising inflation should weigh more heavily on investor sentiment into Q4 2021.GOLD (SPOT) – technical overview
The 2019 breakout above the 2016 high at 1375 was a significant development, opening the door for fresh record highs and an acceleration beyond the next major psychological barrier at 2000. Setbacks should now be well supported above 1600.GOLD (SPOT) – fundamental overview
The yellow metal continues to be well supported on dips with solid demand from medium and longer-term accounts. These players are more concerned about exhausted monetary policy, extended global equities, and coronavirus fallout. All of this should keep the commodity well supported, with many market participants also fleeing to the hard asset as the grand dichotomy of record high equities and record low yields comes to an unnerving climax. [audio mp3="https://www.lmax.com/blog/wp-content/uploads/sites/4/2021/09/15seplmaxaudio.mp3"][/audio]