


Next 24 hours: A dangerous sign
Today’s report: Fed balance sheet supporting markets
Well….it’s always interesting when stocks are moving one way and currencies the other. Clearly the bond market has been a lot more distressed about second half global growth prospects, with the latest jump in coronavirus cases also adding to the strain.
Wake-up call
- ECB Minutes
- full reopening
- offsetting themes
- China outlook
- OIL reverses
- RBNZ November
- Stocks vulnerable
- Dealers report
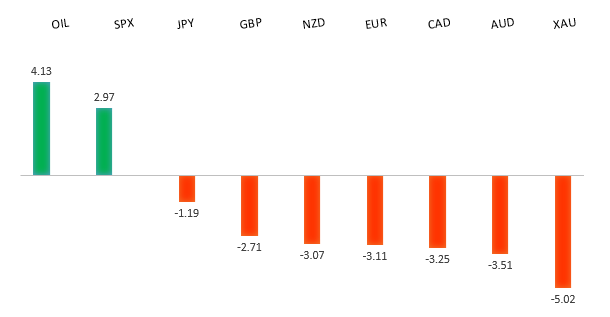
Peformance chart: 30 Day Performance vs. US dollar (%)
Suggested reading
- Who Killed the Recovery Trade? Take Your Pick, J. Authers, Bloomberg (July 7, 2021)
- Central Banking, Fast and Slow, M. El Erian, Project Syndicate (July 6, 2021)
Chart talk: Technical & fundamental highlights
Choose pair:
EURUSD – technical overview
The market has been looking for a higher low since topping out in 2021 up at 1.2350. Ideally, this next higher low is sought out ahead of 1.1600 in favour of the next major upside extension back through 1.2350 and towards a retest of the 2018 high at 1.2555 further up.EURUSD – fundamental overview
The Euro extended its recent decline on Wednesday, with the currency weighed down by a drop in bund yields, the lowest levels since April. It seems the distress in markets around second half growth and the latest uptick in the virus has also inspire a broad flight to safety bid into the Buck. Key standouts on Thursday’s calendar come in the form of an RBA Lowe speech, German trade, the ECB Minutes, and US initial jobless claims.EURUSD - Technical charts in detail
GBPUSD – technical overview
Technical studies are in the process of consolidating from stretched levels after the push to fresh multi-month highs. This leaves room for additional consolidation, before the market considers a meaningful bullish continuation towards a retest of the 2018 high. But look for setbacks to now be very well supported into the 1.3500 area.GBPUSD – fundamental overview
The Pound held up well on Wednesday, especially in the face of broad based US Dollar demand. It seems a lot of the support is coming from anticipation the UK economy will stick to the planned July 19th reopening. Key standouts on Thursday’s calendar come in the form of an RBA Lowe speech, German trade, the ECB Minutes, and US initial jobless claims.USDJPY – technical overview
The major pair has run into massive resistance in the form of the monthly Ichimoku cloud. This translates to a longer-term trend that is still bearish despite the latest run higher. Look for additional upside to be limited, with scope for a topside failure and bearish resumption over the coming sessions. It would take a clear break back above 113.00 to negate the outlook.USDJPY – fundamental overview
Not a lot of exciting price action in the Yen on Wednesday, with the currency caught between offsetting flow from risk on and flight to safety. Key standouts on Thursday’s calendar come in the form of an RBA Lowe speech, German trade, the ECB Minutes, and US initial jobless claims.AUDUSD – technical overview
Technical studies have turned up in recent months, after the market traded down to its lowest levels since 2003 in 2020. There is evidence of a longer-term bottom following the latest push back through 0.7000, though at this stage, there is risk for a deeper pullback to allow for shorter term studies to unwind. Setbacks should now be well supported ahead of 0.7000.AUDUSD – fundamental overview
The Australian Dollar continued to trade with a heavier tone, getting a knock from concerns around a China slowdown and broad based US Dollar demand on flight to safety bids. Key standouts on Thursday’s calendar come in the form of an RBA Lowe speech, German trade, the ECB Minutes, and US initial jobless claims.USDCAD – technical overview
Has been in major decline since topping out in 2021 above 1.4600. At this stage, with the decline now well extended, the market is likely to find solid support into the 1.2000 area ahead of a resumption of gains. Ultimately, only a weekly close below 1.2000 would suggest otherwise. A weekly close back above 1.2500 will strengthen the outlook.USDCAD – fundamental overview
A better than expected Canada Ivey PMI print wasn't enough to keep the Canadian Dollar from selling off on Wednesday. Declining global growth expectations and a drop in the price of OIL were too much for the Loonie to ignore. Key standouts on Thursday’s calendar come in the form of an RBA Lowe speech, German trade, the ECB Minutes, and US initial jobless claims.NZDUSD – technical overview
The market has been very well supported in recent months and there is evidence of a longer-term base. Look for setbacks to hold up above 0.6800, with sights set on a run back towards the 0.7500 area.NZDUSD – fundamental overview
The New Zealand Dollar has held up well this week in the face of broad based US Dollar demand. A lot of this outperformance has been attributed to the rising odds for a November RBNZ rate hike which now stand at greater than 85%. Key standouts on Thursday’s calendar come in the form of an RBA Lowe speech, German trade, the ECB Minutes, and US initial jobless claims.US SPX 500 – technical overview
Longer-term technical studies are looking quite exhausted and the market is showing signs of wanting to roll over after racing to another record high. Look for rallies to be well capped ahead of 4400, with a break back below 4139 to strengthen the outlook.US SPX 500 – fundamental overview
We're trading just off fresh record highs, and yet, with so little room for additional central bank accommodation, given an already depressed interest rate environment, the prospect for sustainable runs to the topside on easy money policy incentives and government stimulus, should no longer be as enticing to investors. Meanwhile, ongoing worry associated with coronavirus fallout and risk of rising inflation should weigh more heavily on investor sentiment into the second half of 2021.GOLD (SPOT) – technical overview
The 2019 breakout above the 2016 high at 1375 was a significant development, opening the door for fresh record highs and an acceleration beyond the next major psychological barrier at 2000. Setbacks should now be well supported above 1600.GOLD (SPOT) – fundamental overview
The yellow metal continues to be well supported on dips with solid demand from medium and longer-term accounts. These players are more concerned about exhausted monetary policy, extended global equities, and coronavirus fallout. All of this should keep the commodity well supported, with many market participants also fleeing to the hard asset as the grand dichotomy of record high equities and record low yields comes to an unnerving climax.