


Next 24 hours: German ZEW comes in soft, US retail sales ahead
Today’s report: Fed getting green light for larger accommodation
Expectations for a larger 50 basis point rate cut from the Fed continue to rise, now sitting at about 65%. The big takeaway here is that the market has been anything but worried about this prospect. As this expectation has increased, so too has investor risk appetite.
Wake-up call
- less dovish
- inflation speculation
- Japan tertiary
- Fed decision
- local data
- risk appetite
- accommodative policy
- Macro themes
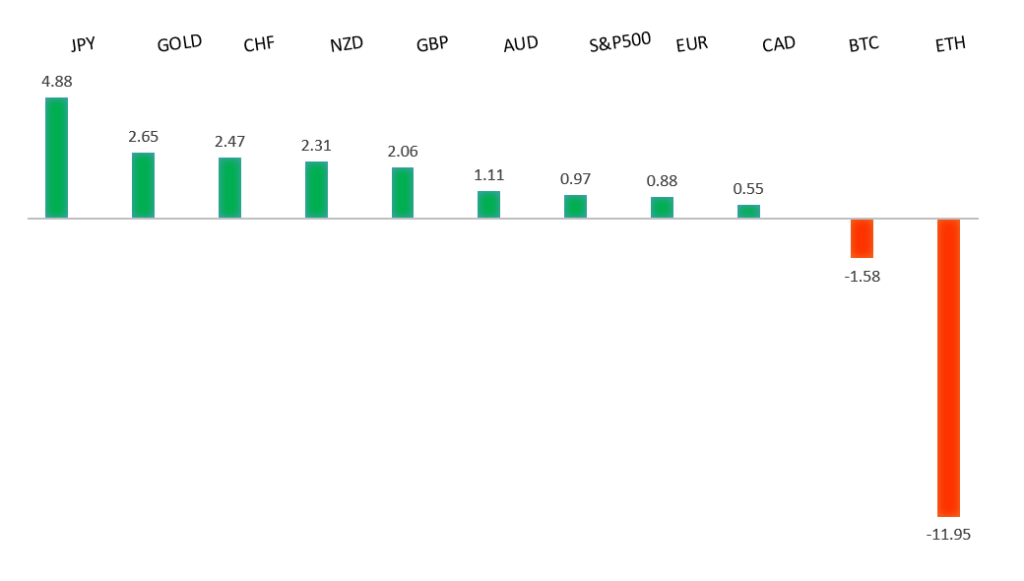
Peformance chart: 30-Day Performance vs. US dollar (%)
Suggested reading
- The Federal Reserve Can Neither Cause Nor Deter Recession, J. Tamny, Forbes (September 15, 2024)
- What if the Fed Cuts Interest Rates by Half a Percent?, S. Hansen, Morningstar (September 13, 2024)
Chart talk: Technical & fundamental highlights
Choose pair:
EURUSD – technical overview
The Euro has been in a multi-month consolidation since bottoming out in 2022. Setbacks have since been exceptionally well supported on dips below 1.0500, with a higher platform sought out ahead of the next major upside extension. Look for a push through the 2023 high at 1.1276 to strengthen the constructive outlook and extend the recovery run towards 1.2000. Only back below 1.0400 negates.EURUSD – fundamental overview
The Euro got a boost on Monday after the ECB tempered October rate cut expectations. Both ECB Kazimir and Lane advocated for a gradual approach to policy easing. Market odds for an October cut have dropped back to 30% from 50% last week. Key standouts on Tuesday’s calendar come from some ECB speak, Eurozone and German ZEW reads, Canada housing starts and inflation, and US retail sales, industrial production, business inventories, and NAHB housing.EURUSD - Technical charts in detail
GBPUSD – technical overview
Signs have emerged of the market wanting to put in a longer-term base after collapsing to a record low in September 2022. The door is now open for the next major upside extension towards the 2018 high at 1.4377. Any setbacks should be well supported ahead of 1.2500.GBPUSD – fundamental overview
There's been plenty of speculation around a hotter than expected UK inflation print tomorrow that will limit the ability for the Bank of England to join in on a wave of central bank easing. This has been behind a lot of the latest run higher we've been seeing in the Pound. Key standouts on Tuesday’s calendar come from some ECB speak, Eurozone and German ZEW reads, Canada housing starts and inflation, and US retail sales, industrial production, business inventories, and NAHB housing.USDJPY – technical overview
The market has entered a period of correction after extending the uptrend to a multi-year high through 160.00. Critical support comes in around 140.00, with only a monthly close below the barrier to compromise the bullish outlook. A higher low is ideally sought out above 140.00 in favor of a bullish continuation.USDJPY – fundamental overview
Japan's tertiary industry activity index came in better than expected which could fuel more speculation around another BOJ rate hike in Q4. Key standouts on Tuesday’s calendar come from some ECB speak, Eurozone and German ZEW reads, Canada housing starts and inflation, and US retail sales, industrial production, business inventories, and NAHB housing.AUDUSD – technical overview
There are signs of the potential formation of a longer-term base with the market trading down into a meaningful longer-term support zone. Only a monthly close below 0.6200 would give reason for rethink. Back above 0.6900 will take the big picture pressure off the downside and strengthen case for a bottom.AUDUSD – fundamental overview
Most of the latest gains in the Australian Dollar come from pricing into tomorrow's Fed decision in which the market has been selling the US Dollar on expectation for a 50 basis point rate cut. Key standouts on Tuesday’s calendar come from some ECB speak, Eurozone and German ZEW reads, Canada housing starts and inflation, and US retail sales, industrial production, business inventories, and NAHB housing.USDCAD – technical overview
A sustained hold above 1.3000 over the past several months signals an end to a period of longer-term bearish consolidation and suggests the market is in the process of carving out a more significant longer-term base. Next key resistance now comes in up into the 1.4000 area, with a break to open a retest of the 2020 high just ahead of 1.4700. Setbacks should be very well supported down into the 1.3000 area.USDCAD – fundamental overview
Canada existing home sales were on the rise, while manufacturing sales topped forecasts. Meanwhile, we've seen a nice recovery in the price of oil, all of which have helped to inspire some demand for a mostly beaten down Canadian Dollar. Key standouts on Tuesday’s calendar come from some ECB speak, Eurozone and German ZEW reads, Canada housing starts and inflation, and US retail sales, industrial production, business inventories, and NAHB housing.NZDUSD – technical overview
Overall pressure remains on the downside with the market continuing to stall out on runs up into the 0.6500 area. At the same time, there are some signs of the market wanting to put in a longer-term base. Ultimately, a break back above 0.6500 would be required to take the medium-term pressure off the downside and encourage this prospect. A monthly close below 0.5800 will intensify bearish price action.NZDUSD – fundamental overview
The New Zealand Dollar has been well bid on the back of broad based US Dollar selling and healthy investor risk appetite on expectations for a larger 50 basis point Fed rate cut at tomorrow's meeting. Key standouts on Tuesday’s calendar come from some ECB speak, Eurozone and German ZEW reads, Canada housing starts and inflation, and US retail sales, industrial production, business inventories, and NAHB housing.US SPX 500 – technical overview
The longer term uptrend remains intact and dips continue to be exceptionally well supported. Critical support comes in at 5093, with only a break back below this level to compromise the structure and open the door for a more significant corrective decline. Until then, the focus remains on a retest and break back above the record high.US SPX 500 – fundamental overview
The US equities market remains exceptionally well supported in 2024 on the back of an ongoing expectation for more rate cuts than less going forward. Investors are feeling better about a soft landing in the US economy and this has also been accompanied by an accommodative adjustment of Fed policy. It will however be important to keep an eye on inflation, bigger picture economic data and geopolitical risk in the months ahead.GOLD (SPOT) – technical overview
The 2019 breakout above the 2016 high at 1375 was a significant development, opening the door for fresh record highs and this next major upside extension into the 2500-3000 area. Setbacks should now be well supported above 2300 on a monthly close basis.GOLD (SPOT) – fundamental overview
The yellow metal has pushed record highs in 2024 with solid demand from medium and longer-term accounts. These players are more concerned about inflation, geopolitical risk and a less upbeat global growth outlook. All of this should keep the commodity well supported over the coming months.