| ||
| 29th May 2025 | view in browser | ||
| Dollar rallies as Nvidia sparks AI optimism | ||
| The U.S. dollar may see continued strength due to corporate buying around month-end and Nvidia’s upbeat $45 billion revenue forecast fueling optimism for an “AI industrial revolution” and supporting U.S. equities. | ||
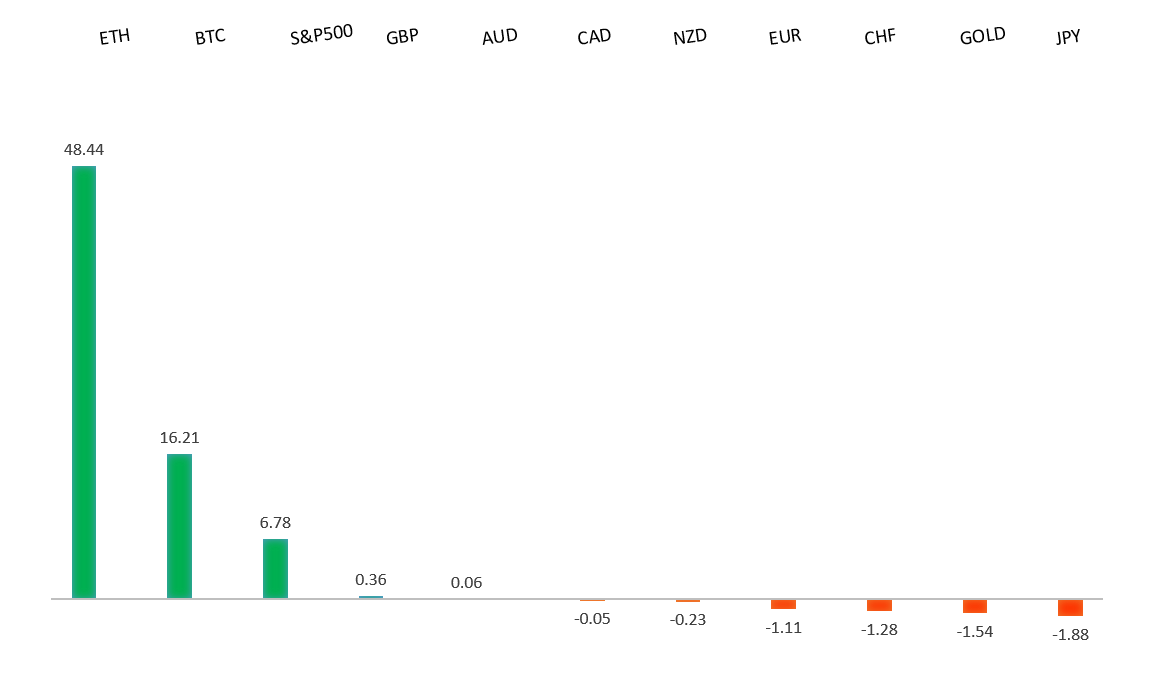
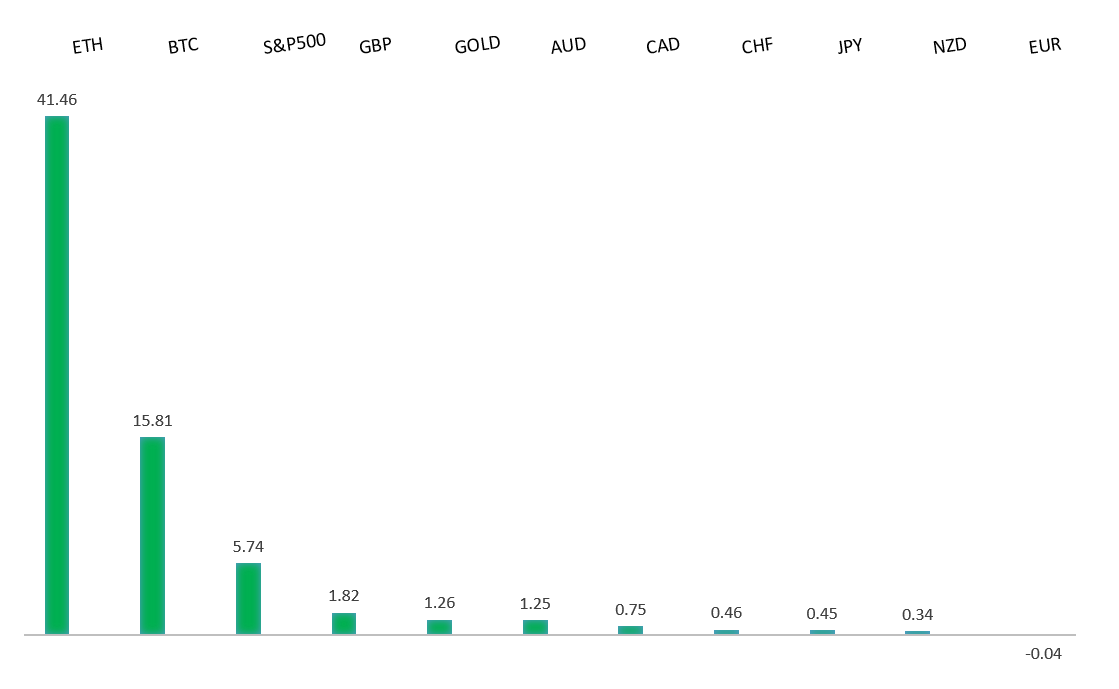
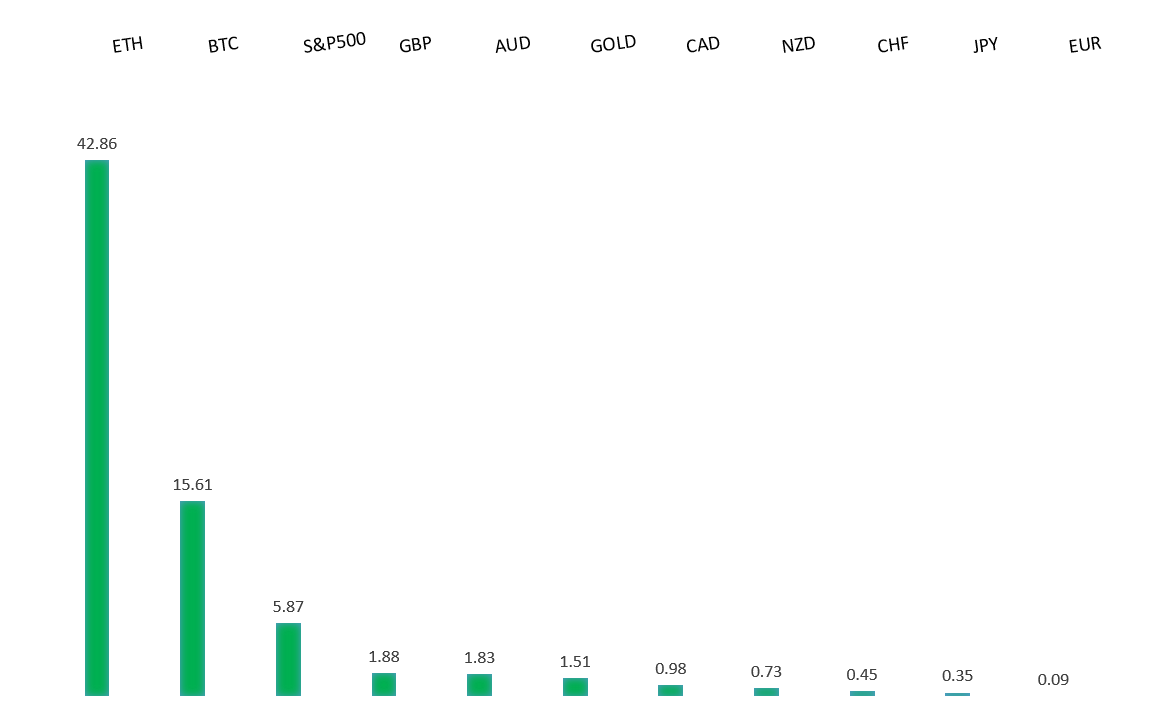
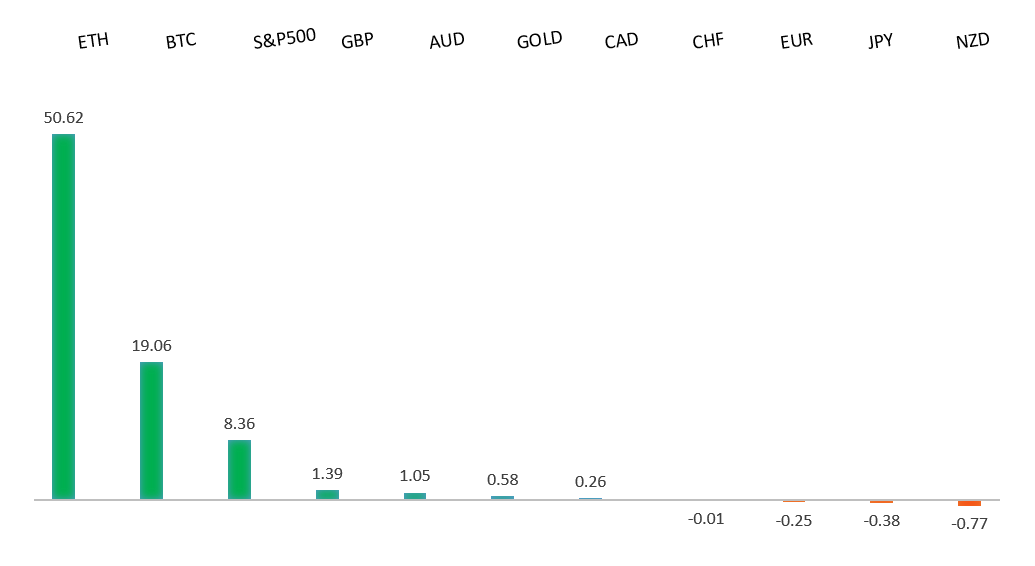
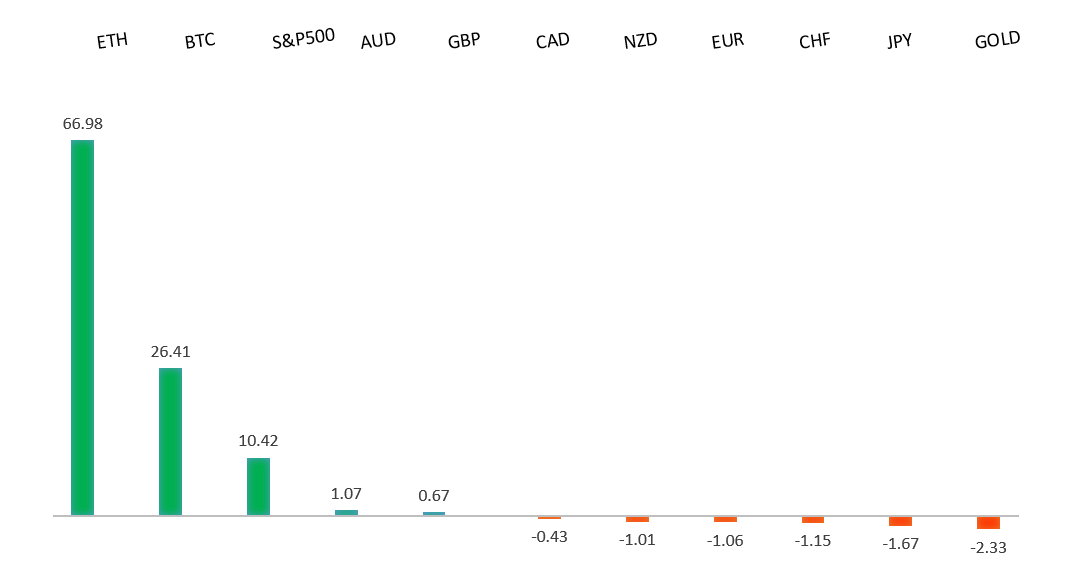
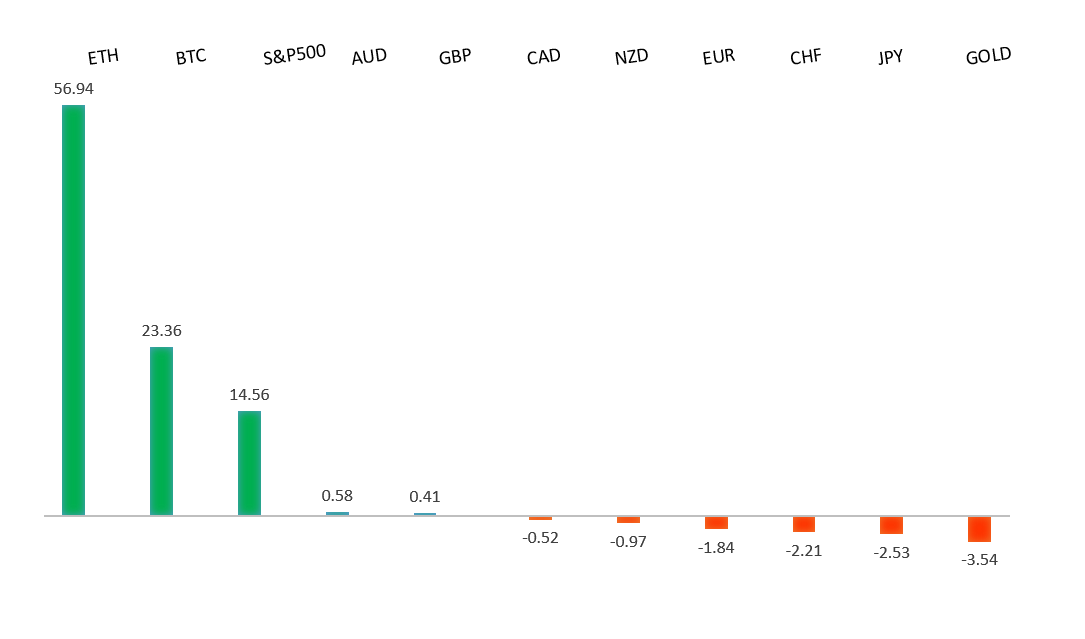
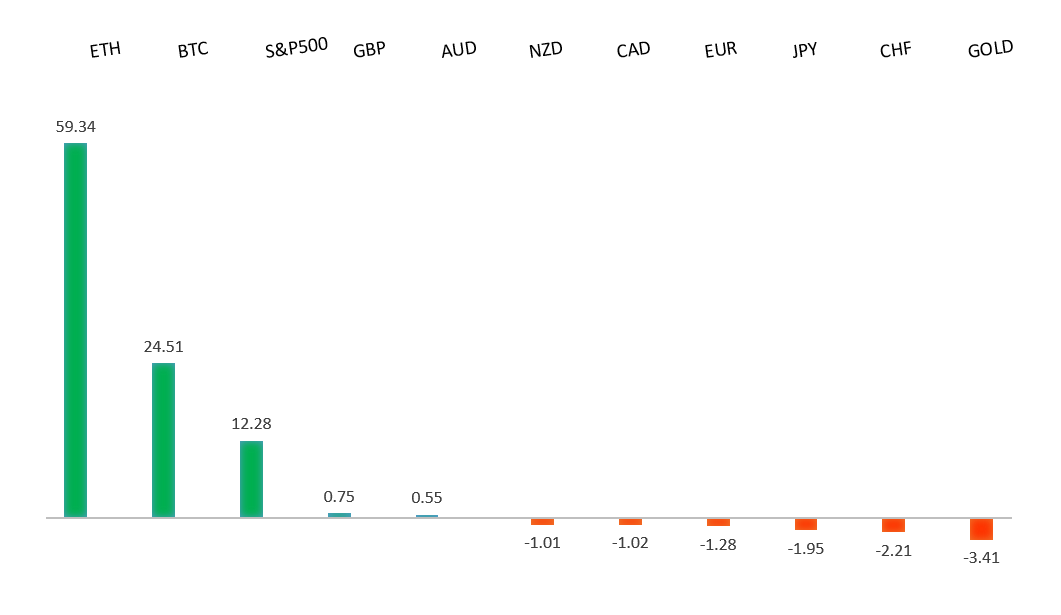
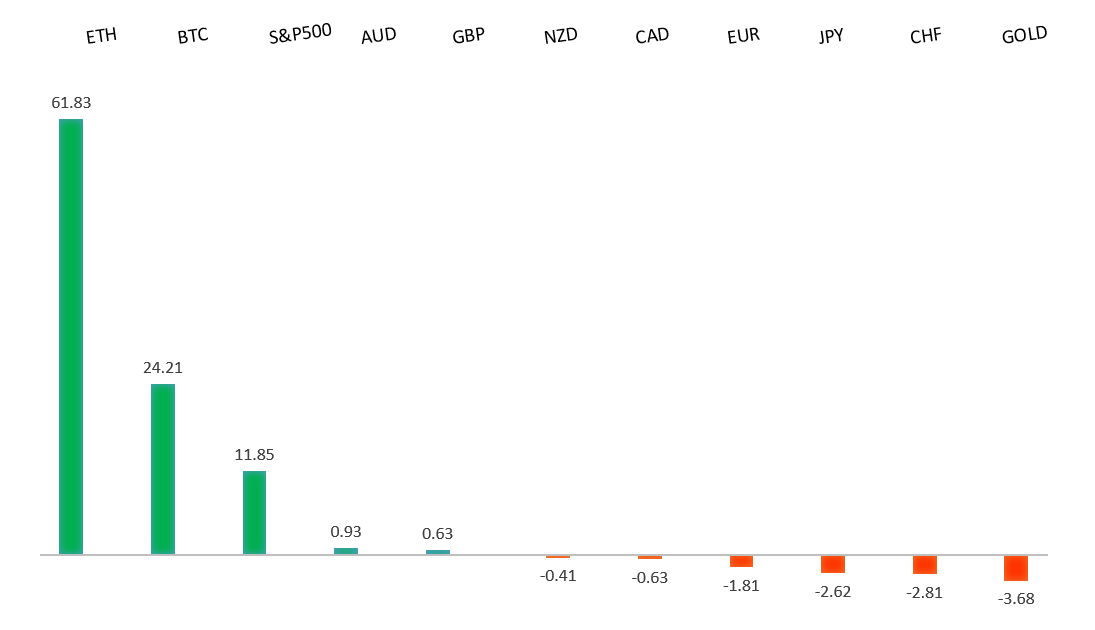
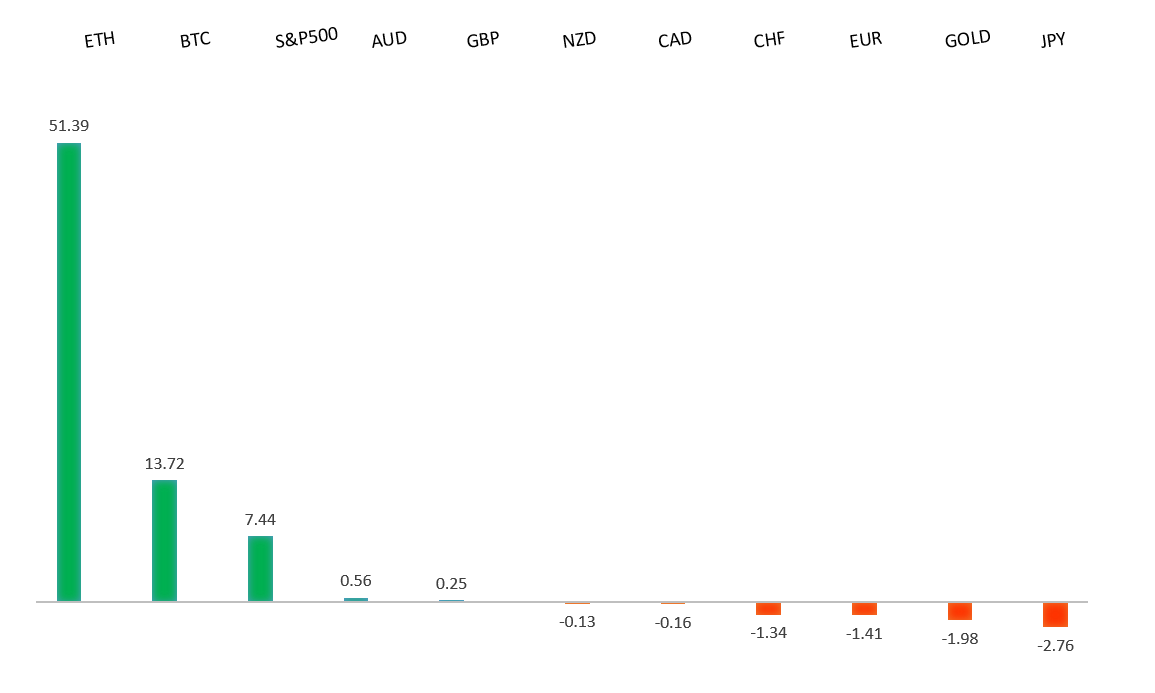
| Performance chart 30day v. USD (%) | ||
 | ||
| Technical & fundamental highlights | ||
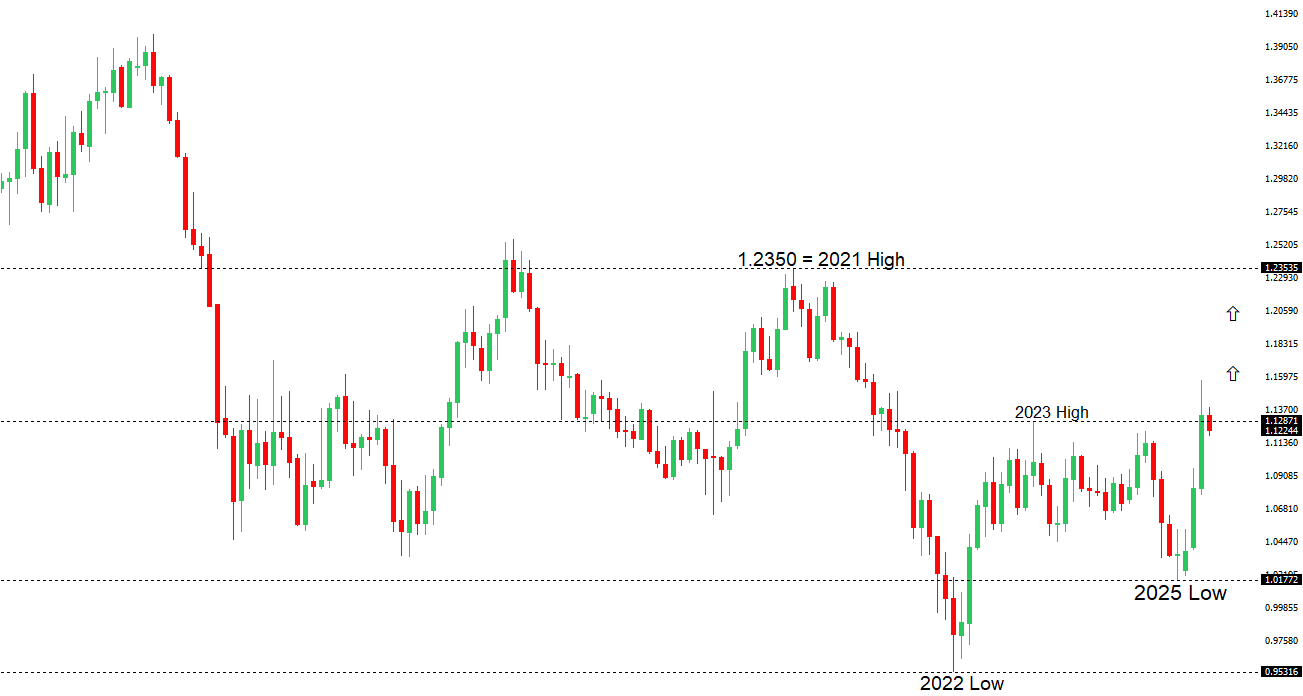
| EURUSD: technical overview | ||
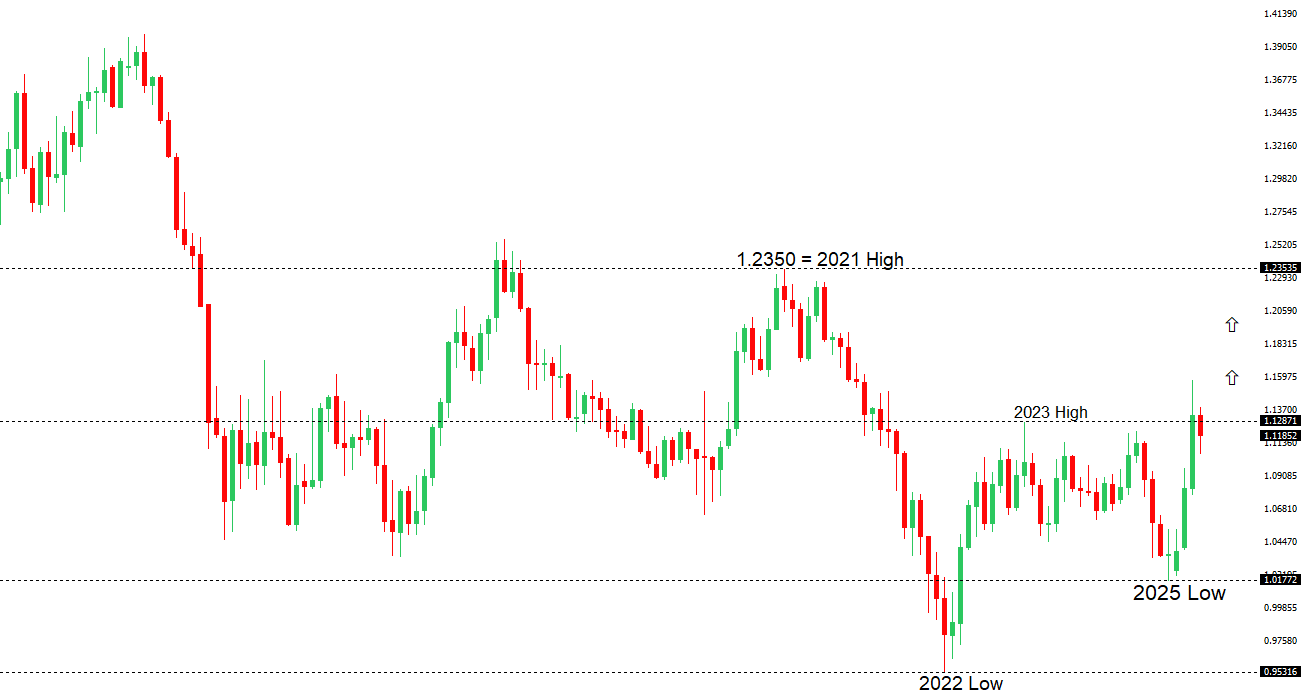
| The Euro has finally broken out from a multi-month consolidation off a critical longer-term low. This latest push through the 2023 high lends further support to the case for a meaningful bottom, setting the stage for a bullish structural shift and the next major upside extension targeting the 2021 high at 1.2350. Setbacks should be exceptionally well supported below 1.1000. | ||
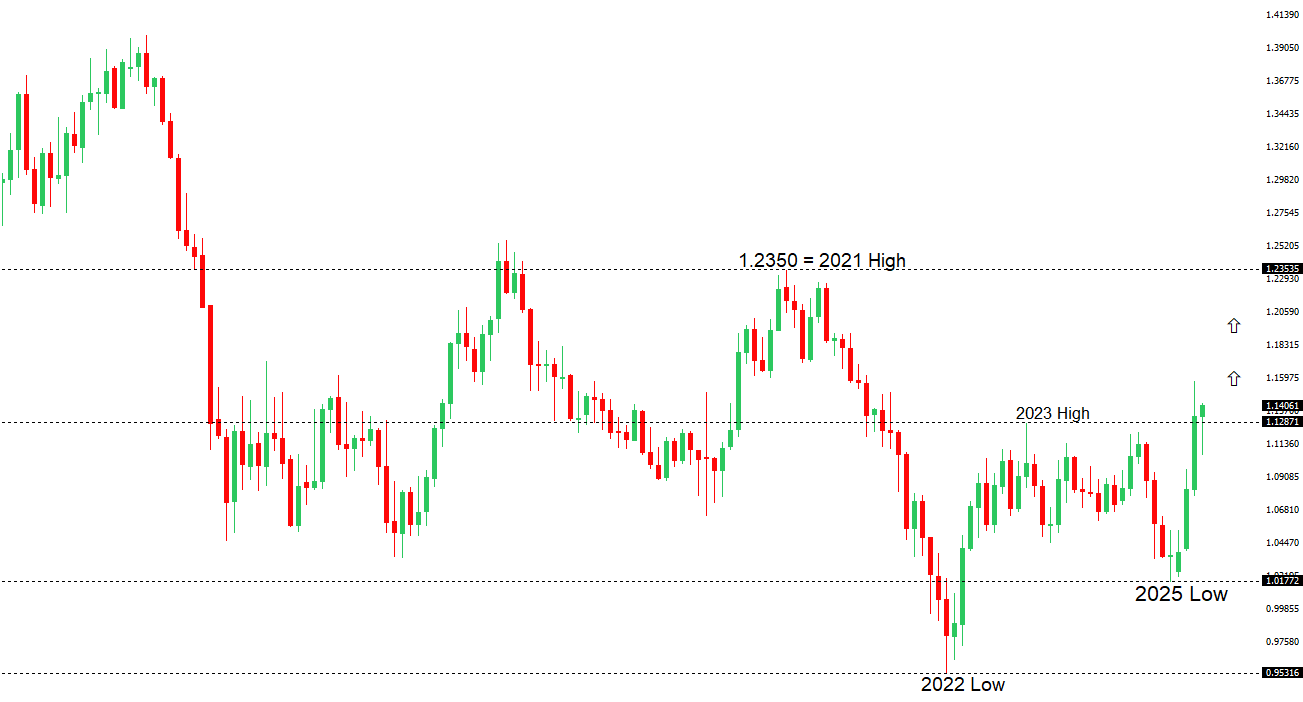 | ||
| R2 1.1474 - 11 April high - Medium R1 1.1419 - 26 May high - Medium S1 1.1131 - 16 May low - Medium S2 1.1065 - 12 May low - Medium | ||
| EURUSD: fundamental overview | ||
| France reported a low May CPI of 0.7% and EU Harmonized CPI of 0.6%, signaling subdued inflation. Germany, Spain, and Italy, representing over 70% of the eurozone’s economy, are expected to report inflation at or below the ECB’s 2% target this Friday, a rare occurrence since 2021. Falling energy costs, a strong euro, and easing wage pressures are driving this disinflation, supporting expectations for an ECB rate cut on June 5 to stimulate growth, despite external risks like potential U.S. tariffs. Eurozone 1-year CPI expectations rose to 3.1%, the highest since February 2024, but stable 3-year expectations at 2.5% suggest confidence in the ECB’s long-term price stability, keeping the rate cut on track. | ||
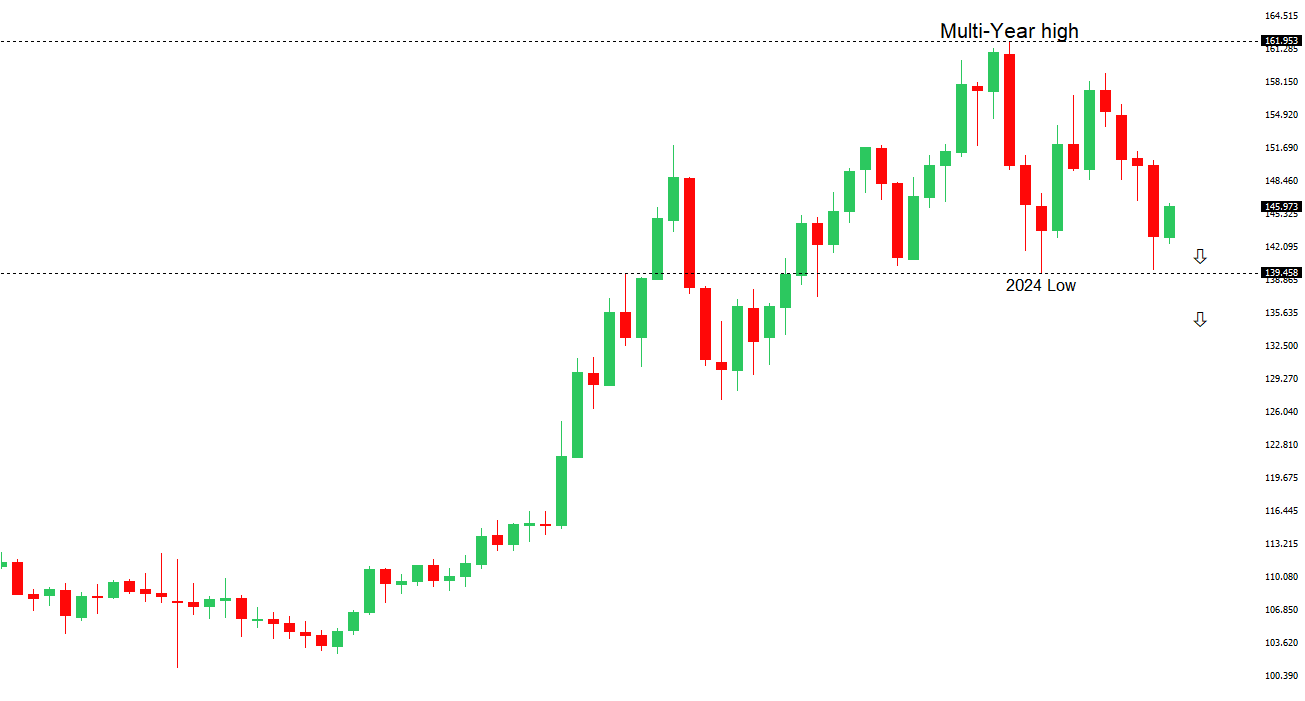
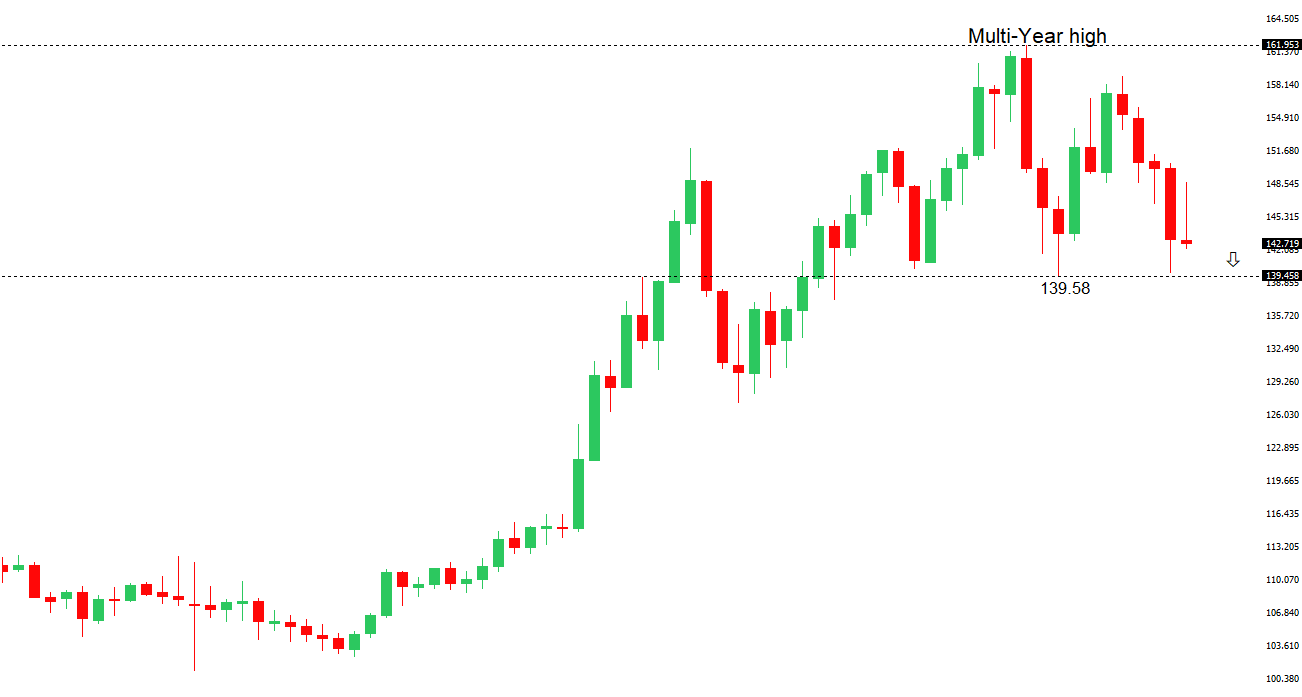
| USDJPY: technical overview | ||
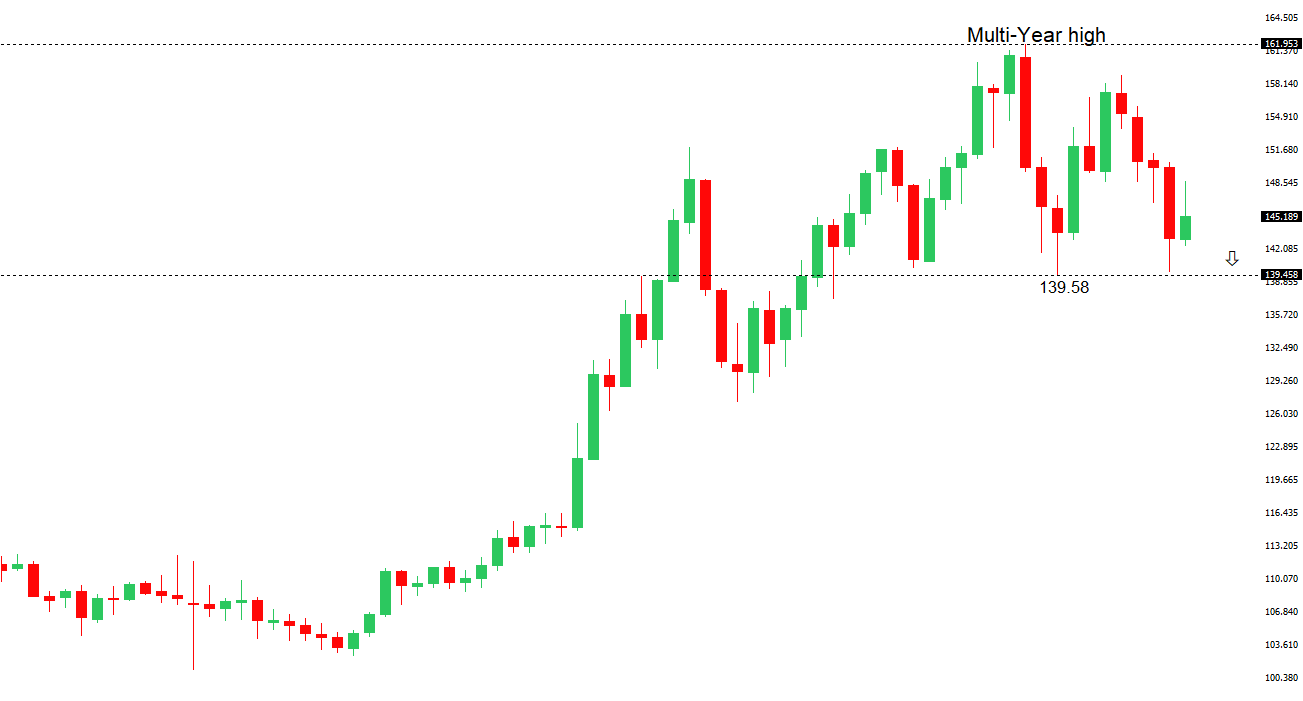
| There are signs of a meaningful top in place after the market put in a multi-year high in 2024. At this point, the door is now open for a deeper setback below the 2024 low at 139.58 over the coming sessions exposing a retest of the 2023 low. Rallies should be well capped below 150.00. | ||
 | ||
| R2 148.65 - 12 May high - Medium R1 146.29 - 29 May high - Medium S1 142.11 - 27 May low - Medium S2 141.97 - 29 April low - Medium | ||
| USDJPY: fundamental overview | ||
| Japan’s 40-year JGB yields rose after weak demand at a recent auction, prompting the finance ministry to survey banks and investors on super-long bond demand, hinting at a potential shift toward issuing more short-term bonds. This could stabilize the bond market, support the yen, and reduce upward pressure on yields, though higher short-term bond issuance might elevate shorter-end yields, narrowing the U.S.-Japan yield gap and sustaining USDJPY’s downward trend. Japan’s May Consumer Confidence Index, expected at 31.8 (up from 31.2), may show slight improvement but remains below the long-term average of 40.7, reflecting ongoing economic caution. Persistent inflation, driven by food, labor, and energy costs, and upcoming Tokyo CPI data suggesting an uptick, strengthen the case for another rate hike. | ||
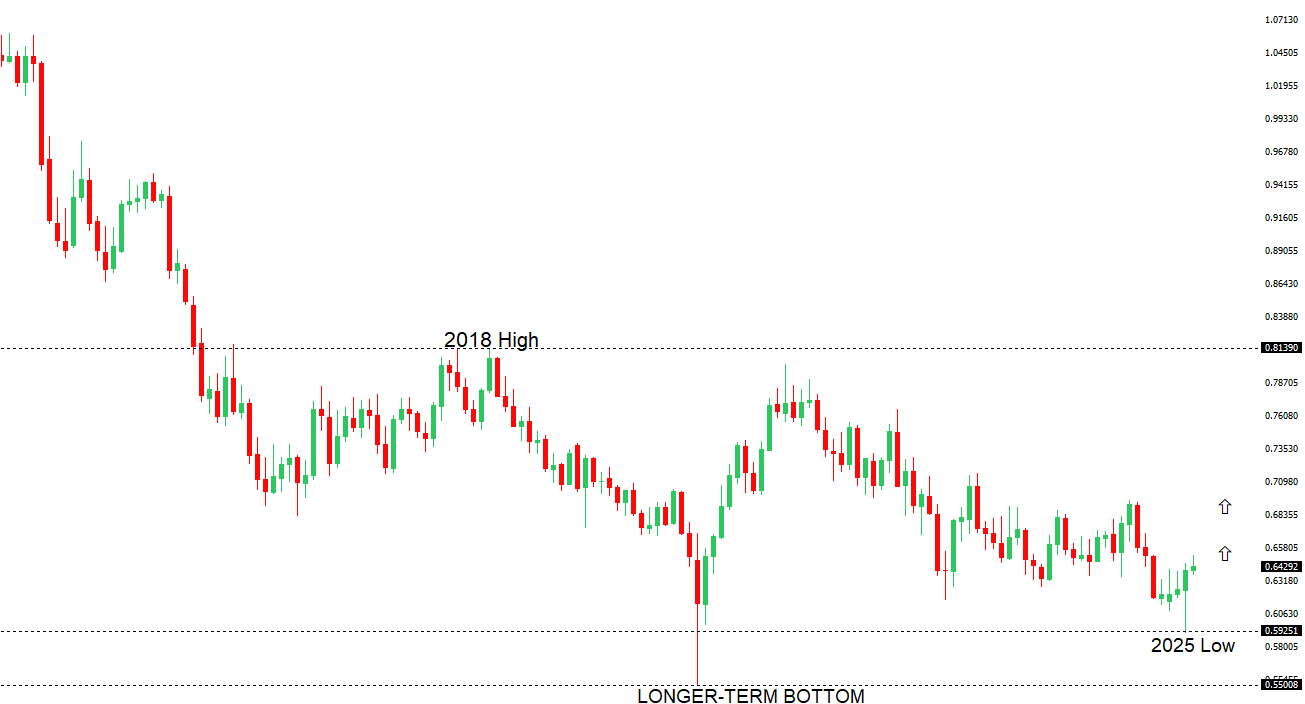
| AUDUSD: technical overview | ||
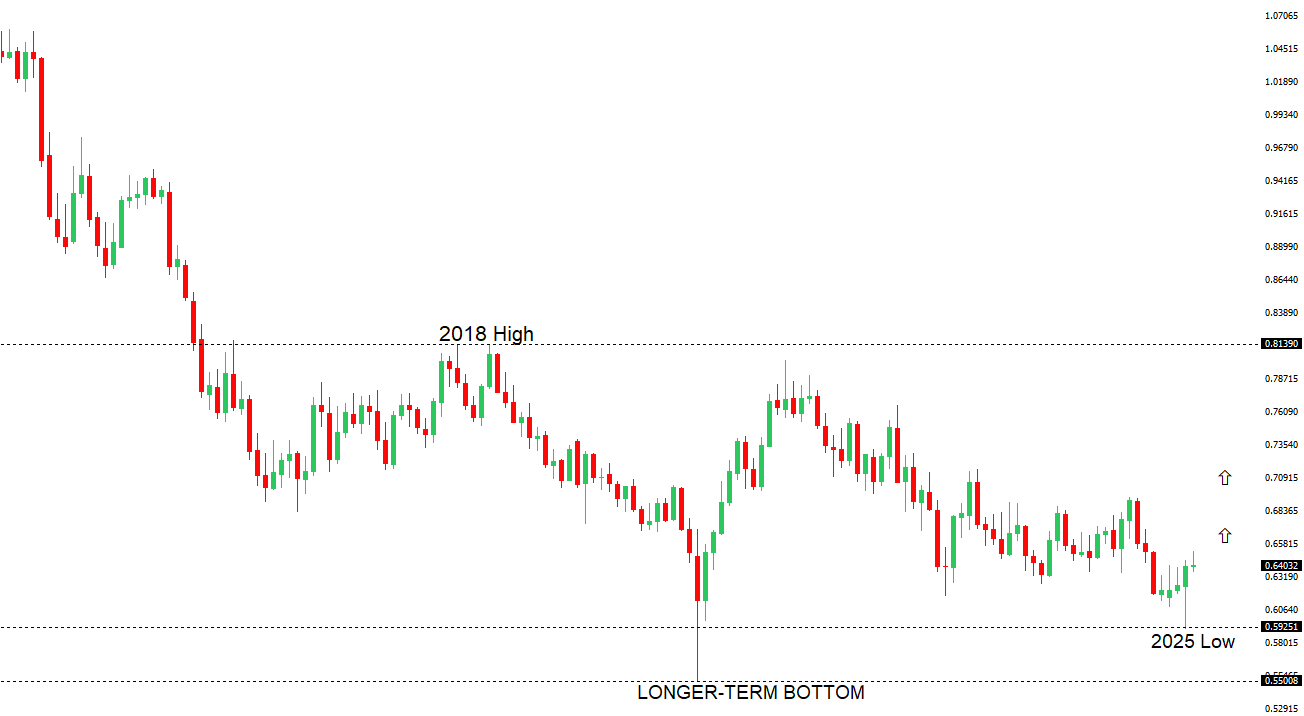
| There are signs of the potential formation of a longer-term base with the market trading down into a meaningful longer-term support zone. Only a monthly close below 0.5500 would give reason for rethink. A monthly close back above 0.7000 will take the big picture pressure off the downside and strengthen case for a bottom. | ||
 | ||
| R2 0.6550 - 25 November 2024 high - Strong R1 0.6538 - 26 May/2025 high - Medium S1 0.6344 - 24 April low - Medium S1 0.6275 - 14 April low - Strong | ||
| AUDUSD: fundamental overview | ||
| A notable bank has been out predicting the Australian dollar will strengthen against the U.S. dollar due to Australia’s stronger economic growth outlook, which recent AUD appreciation hasn’t fully reflected. Australia’s May CPI was slightly higher than expected at 2.4% YoY, with trimmed mean CPI at 2.8%, but inflation remains within the RBA’s 2-3% target, reducing pressure for immediate rate cuts. Despite a 67% market-implied chance of a rate cut at the RBA’s July 7-8 meeting, Governor Bullock’s dovish stance prioritizes trade tariff risks over inflation, with year-end cash rate forecasts at 3.10%-3.35%. Weak Q1 private capital expenditure (-0.1% vs. expected 0.5%) supports the RBA’s cautious approach, though planned business spending of A$155.9 billion for 2025-26 signals optimism for future recovery. | ||
| Suggested reading | ||
| Asia’s $7.5 Trillion Bet On US Assets Is Unraveling, R. Carson, Bloomberg (May 28, 2025) How Interest Rates Set Asset Prices, M. Munger, The Daily Economy (May 21, 2025) | ||