


 | ||
| 19th May 2025 | view in browser | ||
| USD dips on Moody’s downgrade | ||
| The US Dollar weakened across major currencies following Moody’s downgrade of the US long-term issuer rating, citing a decade-long rise in government debt and interest payments, with US stock futures, particularly the Nasdaq falling sharply amid warnings of slower GDP growth due to tariffs. | ||
| Performance chart 30day v. USD (%) | ||
 | ||
| Technical & fundamental highlights | ||
| EURUSD: technical overview | ||
| The Euro has finally broken out from a multi-month consolidation off a critical longer-term low. This latest push through the 2023 high lends further support to the case for a meaningful bottom, setting the stage for a bullish structural shift and the next major upside extension targeting the 2021 high at 1.2350. Setbacks should be exceptionally well supported below 1.1000. | ||
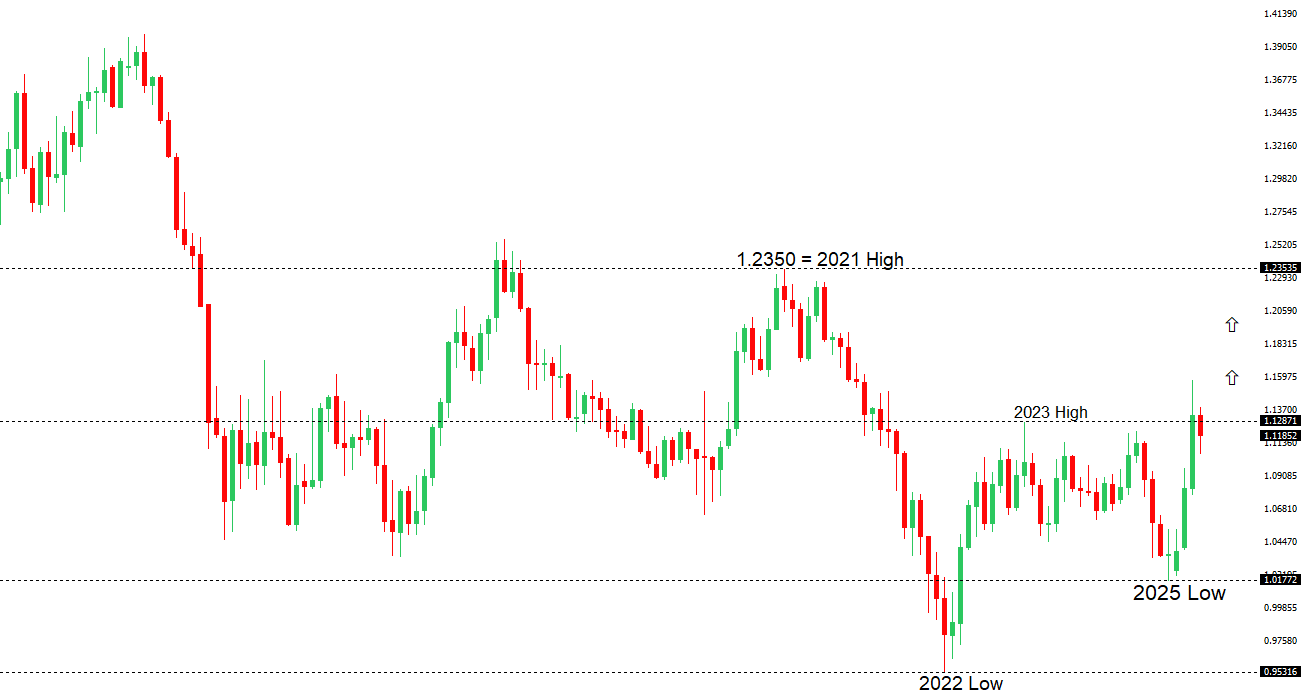 | ||
| R1 1.1293 - 9 May high - Medium R1 1.1266 - 14 May high - Medium S1 1.1065 - 12 May low - Medium S2 1.1000 - Psychological - Strong | ||
| EURUSD: fundamental overview | ||
| The narrowing Eur10yr-Us10yr yield spread has tempered EURUSD bullishness, with Trump’s tariffs fueling expectations of a dovish ECB, though recent US-EU tariff talk progress offers hope. ECB President Lagarde views the euro’s strength, driven by erratic US policies, as a chance to enhance Europe’s financial stability, advocating for a digital euro and deeper fiscal coordination to rival the dollar. Germany’s fiscal stimulus, backed by Chancellor Merz’s debt brake suspension, is set to bolster the euro, contrasting with US debt concerns, while the ECB prepares alternative scenarios for June 2025 projections to navigate trade uncertainties. Geopolitically, Russia and Ukraine plan a 1,000-prisoner swap but lack a ceasefire, with European powers coordinating with a hesitant US on further Russian sanctions. This week, key Eurozone data, including the Spring Economic Forecast, April ECB policy accounts, and May PMI and IFO releases, will shed light on the economic toll of US tariffs. | ||
| USDJPY: technical overview | ||
| There are signs of a meaningful top in place after the market put in a multi-year high in 2024. At this point, the door is now open for a deeper setback below the 2024 low at 139.58 over the coming sessions exposing a retest of the 2023 low. Rallies should be well capped below 150.00. | ||
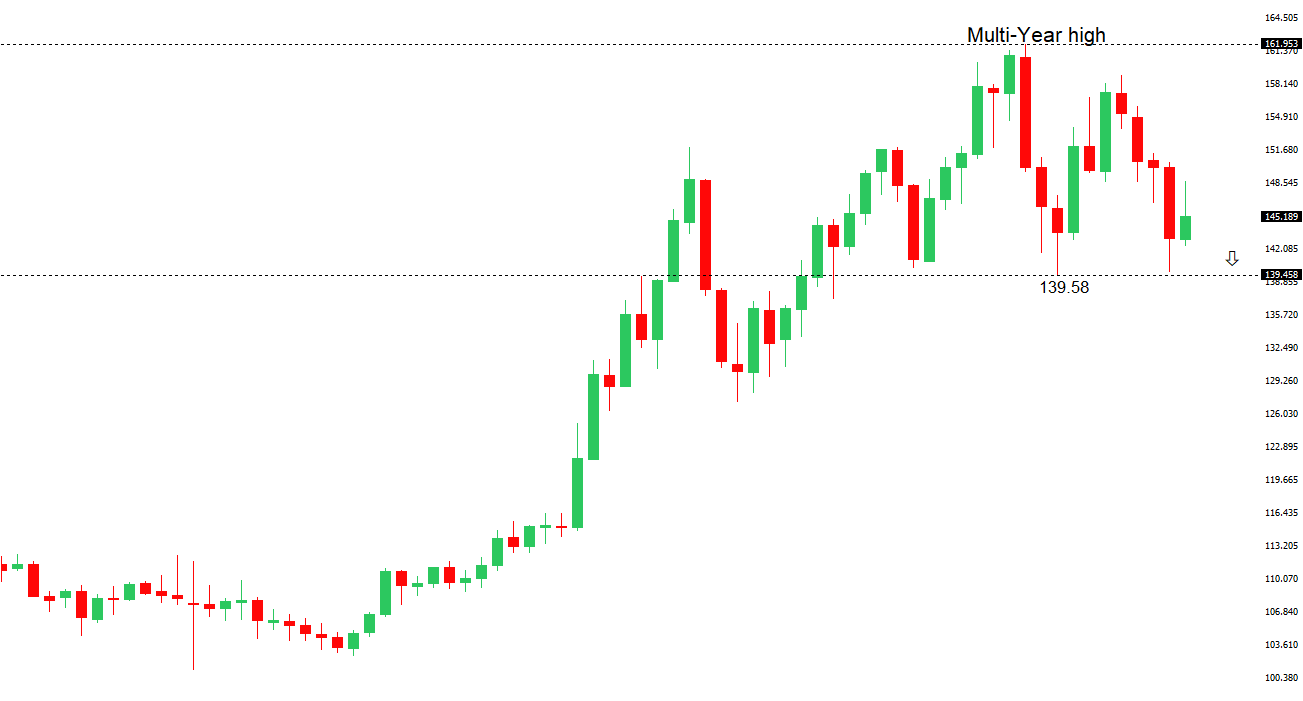 | ||
| R2 150.00 - Psychological - Strong R1 148.65 - 12 May high - Medium S1 145.00 - Figure - Medium S1 144.81 - 19 May low - Medium | ||
| USDJPY: fundamental overview | ||
| Speculation is growing that the US is pushing for stronger Asian currencies, particularly the yen, as part of trade agreements, despite Japan’s Finance Minister Katsunobu Kato affirming with US Treasury Secretary Scott Bessent that exchange rates should be market-driven. This sentiment, fueled by ongoing US-Japan and US-South Korea currency talks, could lift the yen if trade deals progress, with markets eager for insights from Kato’s potential meeting with Bessent at the G7 Finance Ministers meeting (May 20-22). Japan’s Q1 2025 GDP contraction of -0.7% annualized has put the Bank of Japan on a cautious footing, with Credit Agricole’s Takuji Aida predicting no rate hikes until January 2026, pending July-September economic data and a possible technical recession. A successful trade negotiation removing the 25% US auto tariff, a key hurdle, could shift focus back to BOJ rate hikes, though Prime Minister Shigeru Ishiba and negotiator Ryosei Akazawa stress Japan won’t rush or compromise on national interests. This week, markets will scrutinize Japan’s April Trade Balance, March Core Machine Orders, May preliminary PMI Manufacturing and Services, and April inflation data, expected to remain elevated, for clues on economic resilience amid Trump’s tariffs. | ||
| AUDUSD: technical overview | ||
| There are signs of the potential formation of a longer-term base with the market trading down into a meaningful longer-term support zone. Only a monthly close below 0.5500 would give reason for rethink. A monthly close back above 0.7000 will take the big picture pressure off the downside and strengthen case for a bottom. | ||
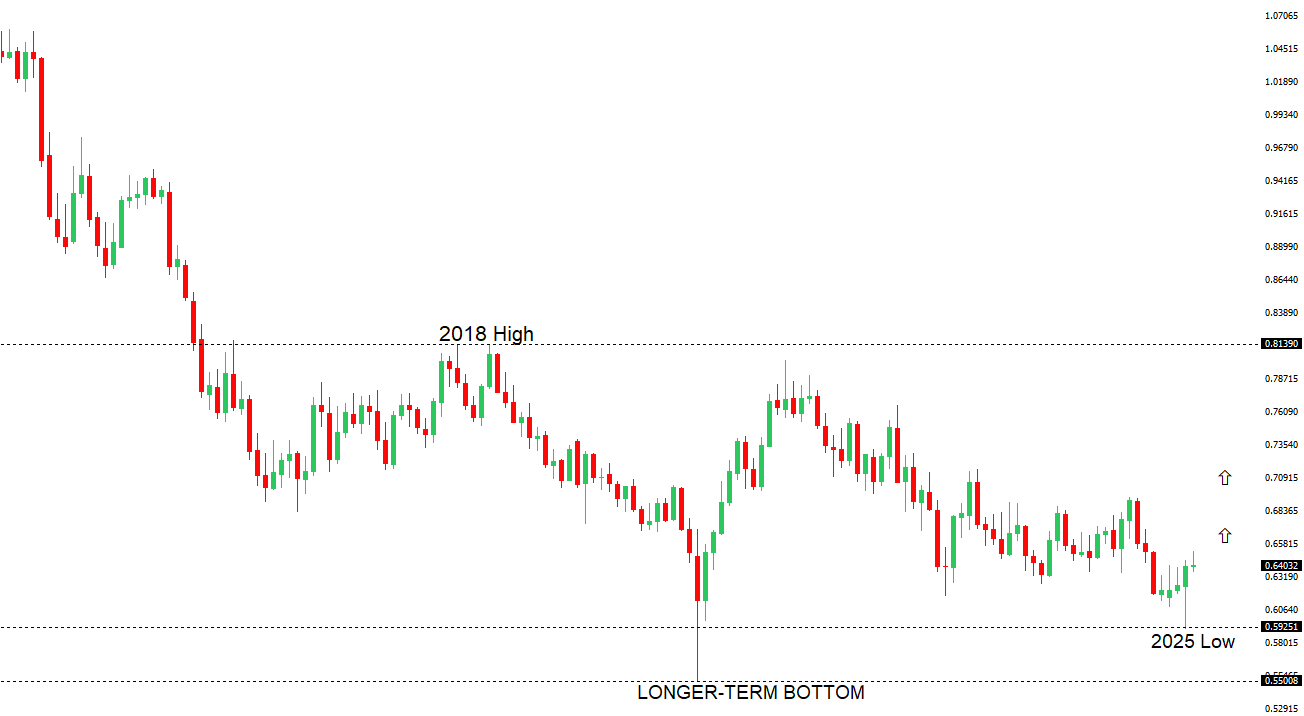 | ||
| R2 0.6550 - 25 November high - Strong R1 0.6515 - 7 May/2025 high - Medium S1 0.6344 - 24 April low - Medium S1 0.6275 - 14 April low - Strong | ||
| AUDUSD: fundamental overview | ||
| Markets are pricing in a near-certain 25bps rate cut at the RBA’s May 20, 2025, meeting, lowering the OCR from 4.10% to 3.85%, despite robust job and wage data, as the “Liberation Day” tariff shock and global growth concerns outweigh domestic labor market strength. Weak indicators like flat hours worked, retail sales, and household spending, coupled with disappointing productivity growth, suggest a less resilient economy, while core inflation’s drop to 2.9%—within the RBA’s 2-3% target for the first time since 2021—gives room for easing without reigniting price pressures, with two more cuts expected by year-end to reach 3.35%. The US-China trade truce bolsters Australia’s export sector, and a potential yuan appreciation, driven by Asian currency talks involving South Korea and Japan, could lift antipodean currencies, further supported by a weakened US dollar following Moody’s downgrade. | ||
| Suggested reading | ||
| What Higher Inflation Means for Stock/Bond Correlations, A. Arnott, Morningstar (May 6, 2025) The US Dollar’s Fall from Grace, S. Dziubinski, Morningstar (May 16, 2025) | ||