


 | ||
| 20th October 2026 | view in browser | ||
| A recovery with a risk premium | ||
| Markets head into Tuesday balancing a tentative recovery in technology shares against elevated yields, stubborn energy inflation and persistent geopolitical risks. | ||
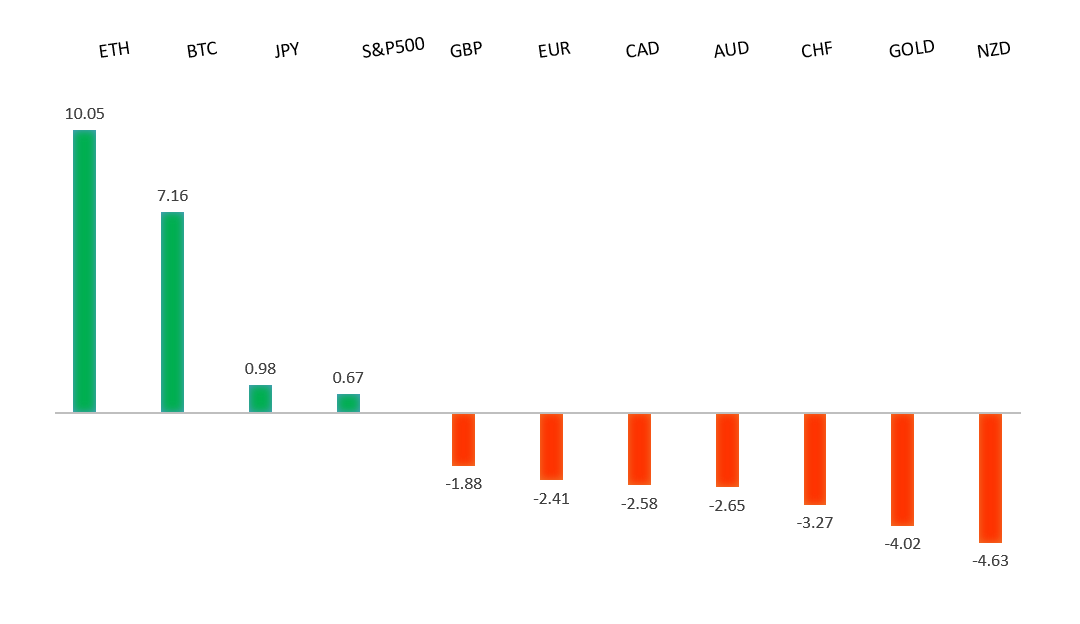
| Performance chart 30day v. USD (%) | ||
 | ||
| Technical & fundamental highlights | ||
| EURUSD: technical overview | ||
| The Euro continues to show signs of wanting to carve out a major bottom after trading down to a 20-year low in 2022. Setbacks should be exceptionally well supported above 1.1000 on a weekly close basis ahead of the next major upside extension back above 1.2000. | ||
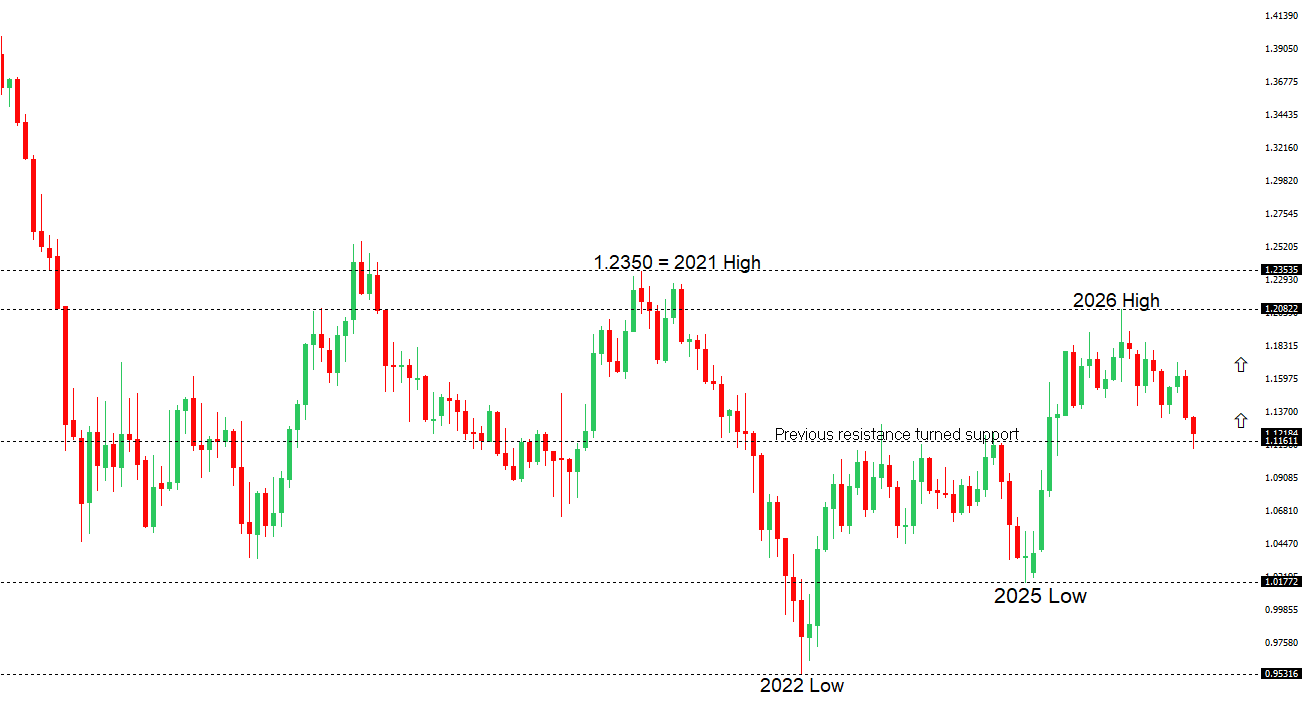 | ||
| R2 1.1337 - 1 October high - Medium R1 1.1270 - 16 October high - Medium S1 1.1181 - 19 Octoberber low - Medium S2 1.1113 - 14 Octoberber/2026 low - Strong | ||
| EURUSD: fundamental overview | ||
| The euro is holding onto its recovery against the dollar, supported by firmer expectations for an October Fed pause after Chair Warsh avoided signalling an immediate need for further tightening. However, expectations for a December hike remain elevated, limiting the scope for a broader retreat in US rate expectations. France remains the main domestic headwind, with violent protests, partial curfews and widening French government bond spreads highlighting concerns over political stability and the fiscal outlook. Geopolitical uncertainty surrounding Ukraine is also weighing on sentiment, leaving the euro resilient against the dollar but lagging some of its peers. Attention now turns to Germany’s ZEW survey and US employment indicators for fresh direction. | ||
| GBPUSD: technical overview | ||
| The Pound remains exceptionally well supported on dips into the 1.3000 area, with the price largely consolidating above the psychological barrier and previous resistance turned support in the form of the 2023 high. Look for the market to continue be well supported on dips ahead of the next major upside extension through the yearly high at 1.3870 and towards a retest of the 2018 high at 1.4377 further up. Only a monthly close below 1.3000 negates. | ||
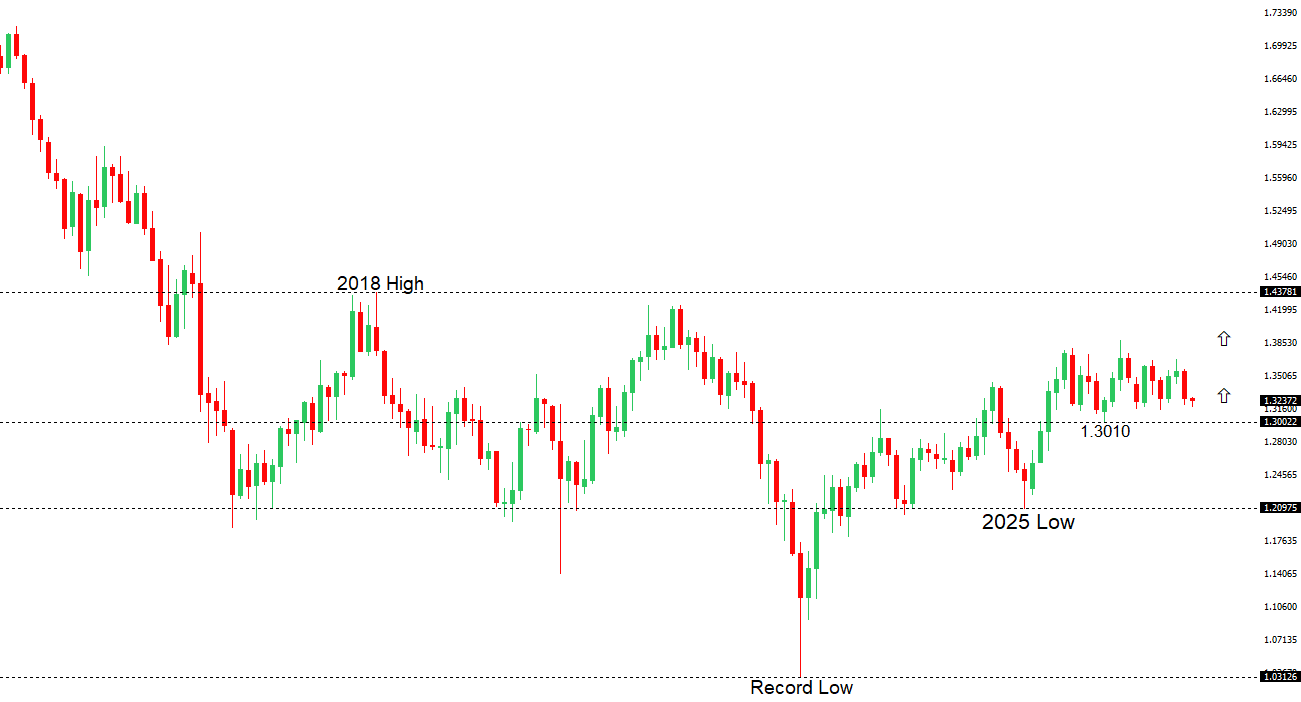 | ||
| R2 1.3407 - 17 September high - Medium R1 1.3372 - 16 October high - Medium S1 1.3264 - 16 October low - Medium S2 1.3137 - 14 October/2026 low - Strong | ||
| GBPUSD: fundamental overview | ||
| The pound is drawing support from diverging near-term policy expectations, with markets anticipating an October pause from the Federal Reserve while pricing in further Bank of England tightening, potentially beginning in November. This relative interest rate outlook has helped sterling firm against a softer dollar, although expectations for a later Fed hike temper the advantage. Attention is also turning to next week’s UK budget, where credible restraint on spending and borrowing could strengthen demand for gilts and reinforce confidence in UK assets. The budget remains a key test for sterling, with further support dependent on the government delivering the fiscal discipline investors increasingly expect. | ||
| USDJPY: technical overview | ||
| The recent breakdown below 155.00 suggests the market could be on the verge of a bigger structural shift, with the possibility for an end to a longer-term uptrend and the start to a period of persistent weakness. Critical support now comes in the form of the 2026 low from January at 151.97, with a drop below to strengthen the bearish outlook and open the door for a major downside extension targeting the 2024 low at 139.58. The market would need to get back above 160.00 to take the immediate pressure off the downside. | ||
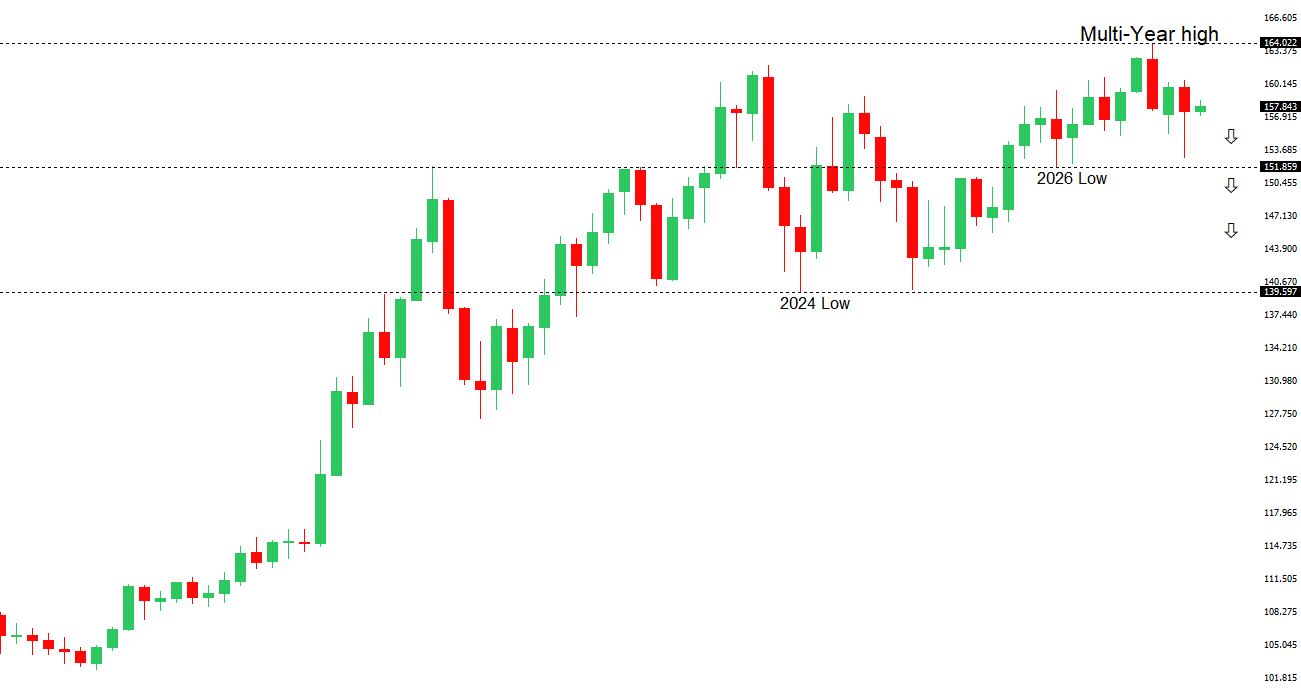 | ||
| R2 159.04 - 24 September high - Strong R1 158.95 - 14 October high - Medium S1 157.52 - 8 October low - Medium S2 156.37 - 30 September low - Strong | ||
| USDJPY: fundamental overview | ||
| The yen remains caught between growing confidence in further Bank of Japan policy normalization and the continued appeal of elevated US yields. Governor Ueda’s assessment that underlying inflation is approaching the central bank’s target, supported by a strengthening wages–prices cycle, keeps additional tightening on the table, though expectations for a gradual approach have limited support for the currency. Meanwhile, increased confidence in a Federal Reserve pause this month has been offset by expectations for a subsequent US rate hike, leaving interest rate differentials a persistent headwind for the yen. Prime Minister Takaichi’s assurances over fiscal discipline provide some reassurance, but attention now turns to Friday’s Japanese inflation report for evidence that could bring forward expectations for the BoJ’s next move. | ||
| AUDUSD: technical overview | ||
| There are signs of the formation of a longer-term base with the market recovering out from a meaningful longer-term support zone. The latest monthly close back above 0.7000 takes the big picture pressure off the downside and strengthens the case for a bottom, with the focus now on a push towards 0.8000. Setbacks should now be well supported ahead of 0.6700. | ||
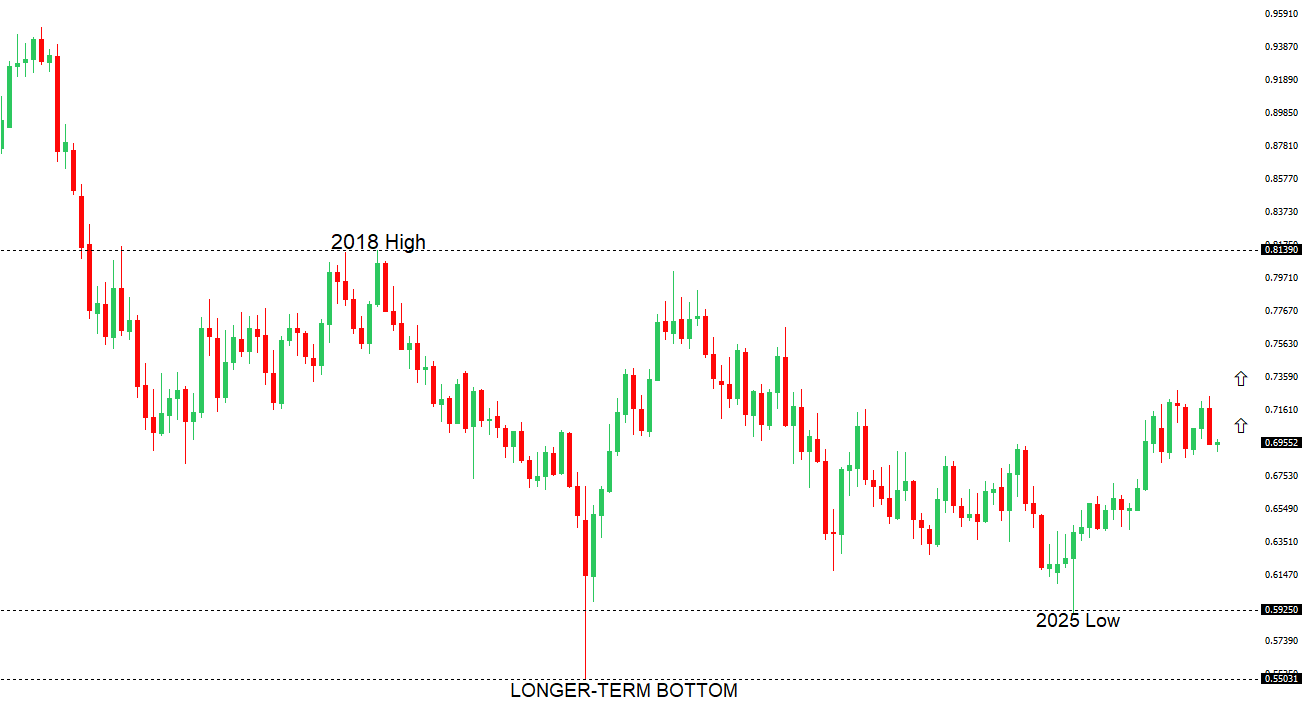 | ||
| R2 0.7014 - 14 October high - Strong R1 0.7000 - Round Number - Medium S1 0.6948 - 19 October low - Medium S2 0.6894 - 15 October low - Strong | ||
| AUDUSD: fundamental overview | ||
| The Australian dollar is consolidating after its recent recovery, with China’s decision to leave lending rates unchanged offering little fresh support for the China-sensitive currency. Domestically, RBA Assistant Governor Christopher Kent’s comments that rising neutral rates could leave policy less restrictive than assumed have kept the possibility of further tightening alive, providing some underlying support for the Aussie. Meanwhile, reduced expectations for an immediate Fed hike have softened the US dollar, although persistent expectations of tightening later in the year continue to limit the scope for further Australian dollar gains. Attention now turns to RBA Deputy Governor Andrew Hauser’s upcoming remarks for further guidance on the domestic policy outlook. | ||
| Suggested reading | ||
| Silent market rotation inside the S&P 500, M. Kramer, Marketwatch (October 18, 2026) Friedman & Keynes Thought Government Could Stop Recessions, J. Tamny, Forbes (October 18, 2026) | ||