


 | ||
| 11th September 2025 | view in browser | ||
| All eyes on US CPI, ECB decision | ||
| The US dollar edged slightly higher at the start of the trading day, shrugging off yesterday’s disappointing August Producer Price Index data, which showed final demand prices falling short of forecasts. Markets are now laser-focused on next week’s Federal Reserve meeting, with over 100% odds of a rate cut on September 18 already priced in. | ||
| Performance chart 30day v. USD (%) | ||
 | ||
| Technical & fundamental highlights | ||
| EURUSD: technical overview | ||
| The Euro has broken out from a multi-month consolidation off a critical longer-term low. This latest push through the 2023 high (1.1276) lends further support to the case for a meaningful bottom, setting the stage for a bullish structural shift and the next major upside extension targeting the 2021 high at 1.2350. Setbacks should be exceptionally well supported ahead of 1.1000. | ||
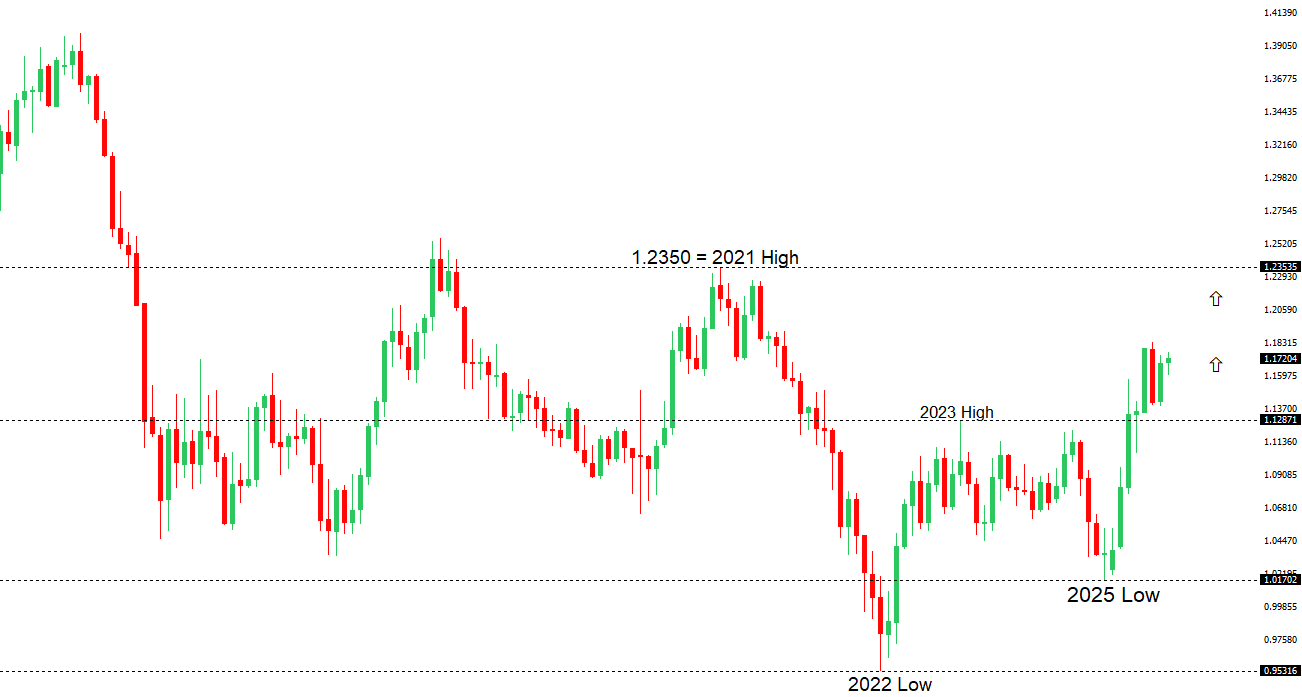 | ||
| R2 1.1830 - 1 July/2025 high - Strong R1 1.1789 - 24 July high - Medium S1 1.1608 - 3 September low - Medium S2 1.1574 - 27 August low - Strong | ||
| EURUSD: fundamental overview | ||
| Central banks are diverging on policy: the ECB is likely to hold rates steady at its next meeting and possibly until late 2026, emphasizing data dependency and showing reluctance for further cuts amid stable growth and inflation signals, while markets see only a slim chance of one more trim this year. In contrast, the Fed faces building pressure for aggressive easing, with up to three cuts priced in for the rest of 2025, fueled by a massive -911,000 jobs data revision, softer PPI figures hinting at cooling inflation ahead of today’s CPI report, and falling Treasury yields widening euro-dollar rate gaps. This setup, alongside short-lived French political turbulence under new PM Sébastien Lecornu—who vows cross-party collaboration to avert a 2026 budget crisis—and US tariff risks, has strategists forecasting a euro rebound above $1.20 by year-end, potentially testing its 2025 high of 1.1829 if US data disappoints. | ||
| USDJPY: technical overview | ||
| There are signs of a meaningful top in place after the market put in a multi-year high in 2024. At this point, the door is now open for a deeper setback below the 2024 low at 139.58, exposing a retest of the 2023 low. Rallies should be well capped below 152.00. | ||
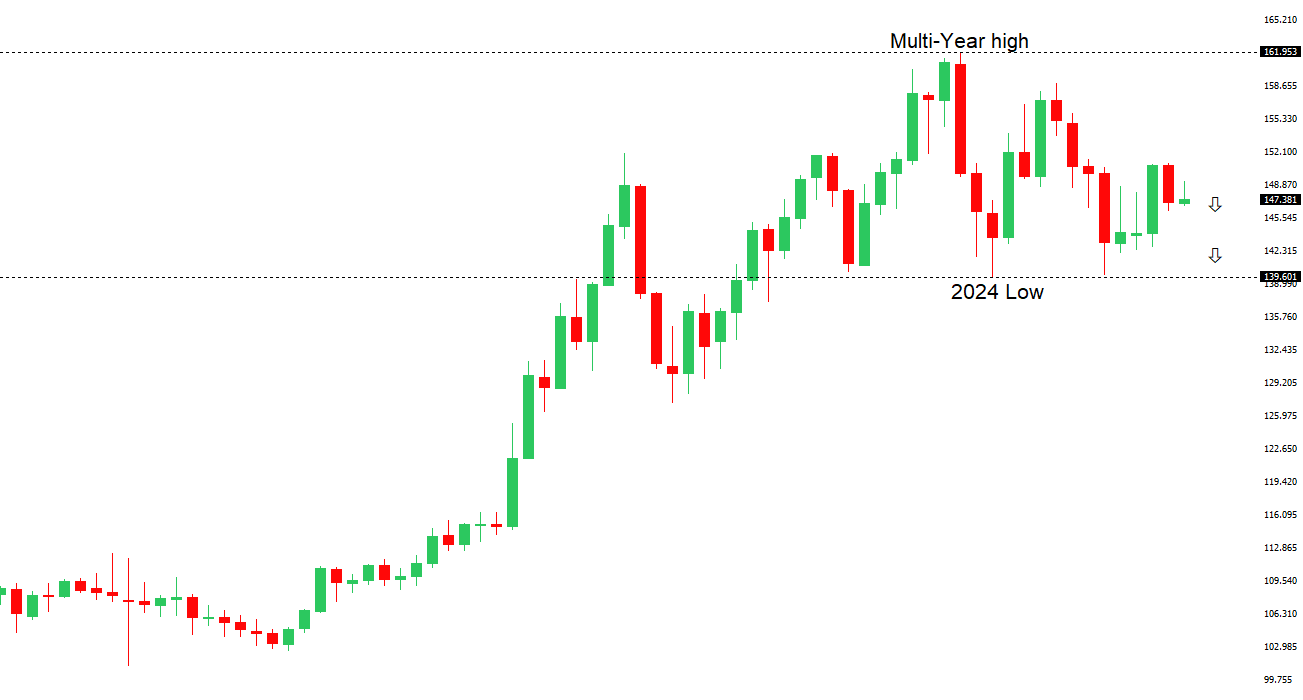 | ||
| R2 150.92 - 1 August high - Strong R1 149.14 - 3 September high - Medium S1 146.21 - 14 August low - Medium S2 145.85 - 24 July low - Strong | ||
| USDJPY: fundamental overview | ||
| Amid political turmoil following Prime Minister Shigeru Ishiba’s September 7 resignation, which has eroded investor confidence and spiked Japanese government bond yields, the Bank of Japan is set to hold its benchmark rate at 0.5% during its September 18-19 meeting, postponing hikes until after the Liberal Democratic Party’s leadership vote on October 4—despite upbeat economic signals like the 3Q Business Survey Index surging to positive territory (4.7 for all industries and 3.8 for manufacturing) and August producer prices up 2.7% year-over-year, underscoring sticky inflation above 2% and bolstering normalization hopes. A victory for fiscal dove Sanae Takaichi could weaken the yen further and elevate yields via expansionary policies, unlike a milder response under reformist Shinjiro Koizumi, while one major US bank predicts USDJPY sliding toward 140 by Q4 amid shrinking U.S.-Japan rate gaps; hedge funds are piling into yen-strength bets through options, though markets doubt near-term hikes unless Governor Ueda turns hawkish on September 19. | ||
| AUDUSD: technical overview | ||
| There are signs of the potential formation of a longer-term base with the market trading down into a meaningful longer-term support zone. Only a monthly close below 0.5500 would give reason for rethink. A monthly close back above 0.7000 will take the big picture pressure off the downside and strengthen case for a bottom. | ||
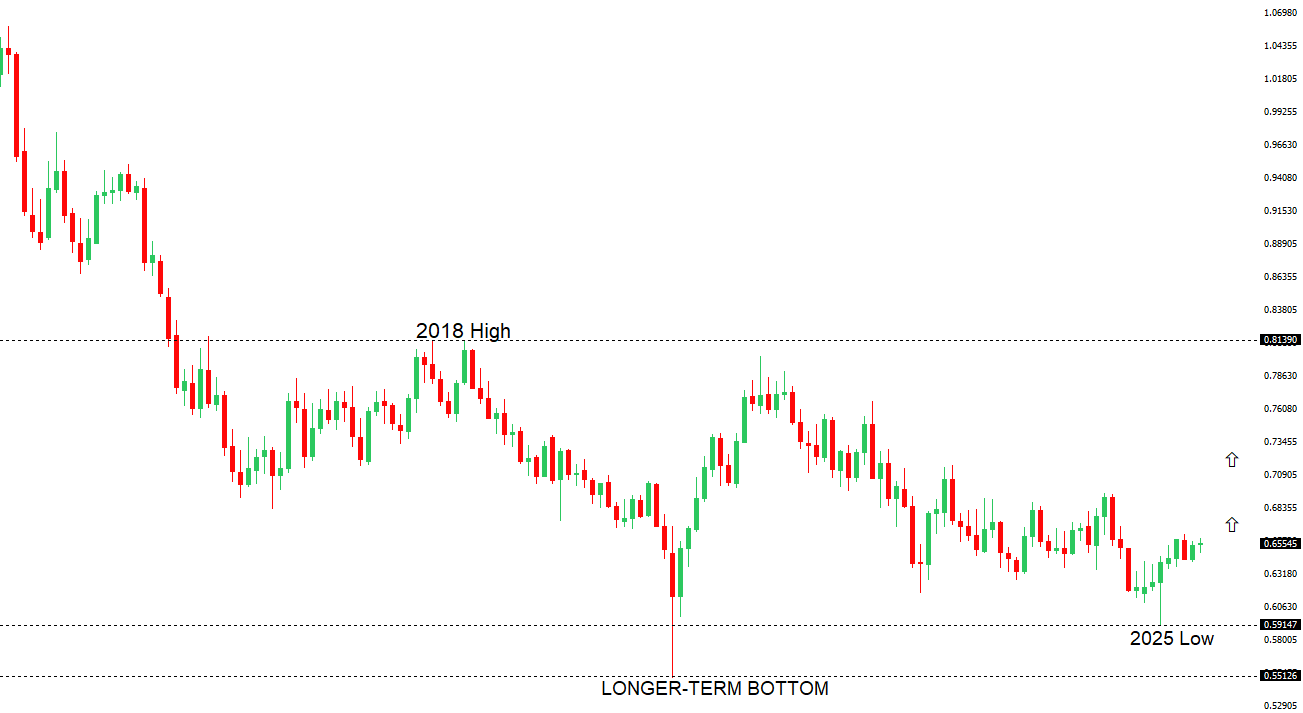 | ||
| R2 0.6700 - Figure - Medium R1 0.6636 - 10 September/2025 high - Strong S1 0.6483 - 2 September low - Medium S1 0.6414 - 22 August low - Strong | ||
| AUDUSD: fundamental overview | ||
| Recent U.S. economic indicators, including a record downward revision of 911,000 jobs from April 2024 to March 2025 and an unexpected 0.1% drop in August PPI inflation (versus a forecasted 0.3% rise), have strengthened bets on a 50 basis point Federal Reserve rate cut, pointing to cooling price pressures ahead of today’s CPI data. This has fueled risk-on markets, with Treasury yields dipping, the S&P 500 reaching new highs, and boosting high-beta antipodean currencies like AUD and NZD amid broader dollar weakness. Australia’s Q2 GDP surged 0.6% quarter-on-quarter (beating 0.5% estimates) on robust household spending, exports, and public demand, trimming November RBA rate cut odds to around 72% from near-certainty, as inflation holds steady in the 2-3% band—though September consumer inflation expectations spiked to 4.7% from 3.9%, potentially flagging de-anchoring risks that the RBA will scrutinize via upcoming Q3 CPI and jobs data. China’s manufacturing PMI also surprised positively, lifting sentiment for commodity-linked antipodeans by signaling Beijing’s focus on household consumption to offset export woes, with AUDUSD poised for resilience and RBA policy likely staying balanced on growth-inflation trade-offs. | ||
| Suggested reading | ||
| Bangladesh’s missing billions, stolen in plain sight, T. Griggs, Financial Times (September 11, 2025) What AI’s Spending Boom Is Really Buying, S. Rosenberg, Axios (September 9, 2025) | ||