


 | ||
| 24th June 2026 | view in browser | ||
| Dollar dominance keeps global markets on the defensive | ||
| The US dollar remains the dominant force across global markets as investors price a more hawkish Fed, overshadowing increasingly hawkish signals from the BOJ and RBA, while equities face pressure from rising rate expectations and commodities remain caught between geopolitical risks and tighter financial conditions. | ||
| Performance chart 30day v. USD (%) | ||
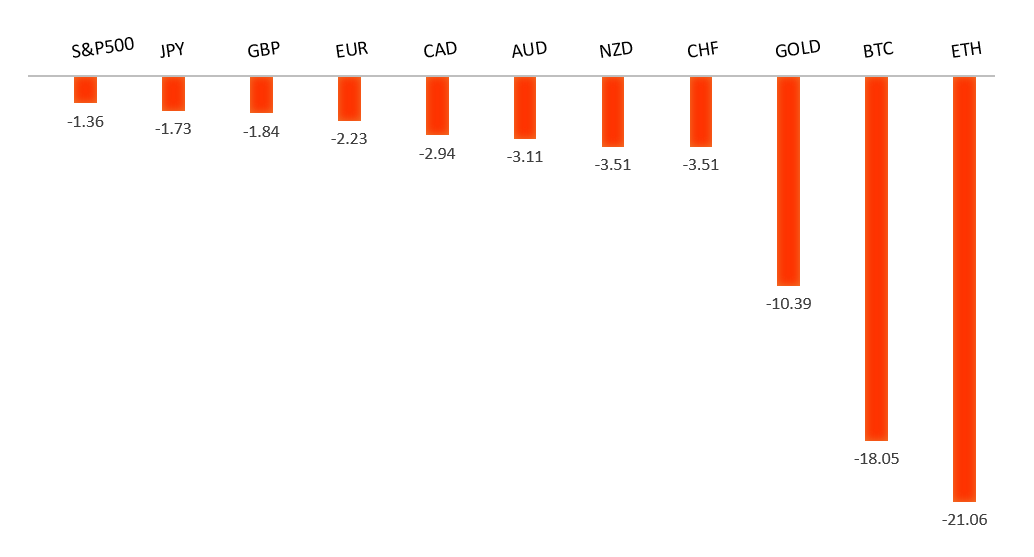 | ||
| Technical & fundamental highlights | ||
| EURUSD: technical overview | ||
| The Euro outlook remains constructive with higher lows sought out on dips in favor of the next major upside extension targeting the 2021 high at 1.2350. Setbacks should be exceptionally well supported ahead of 1.1300. | ||
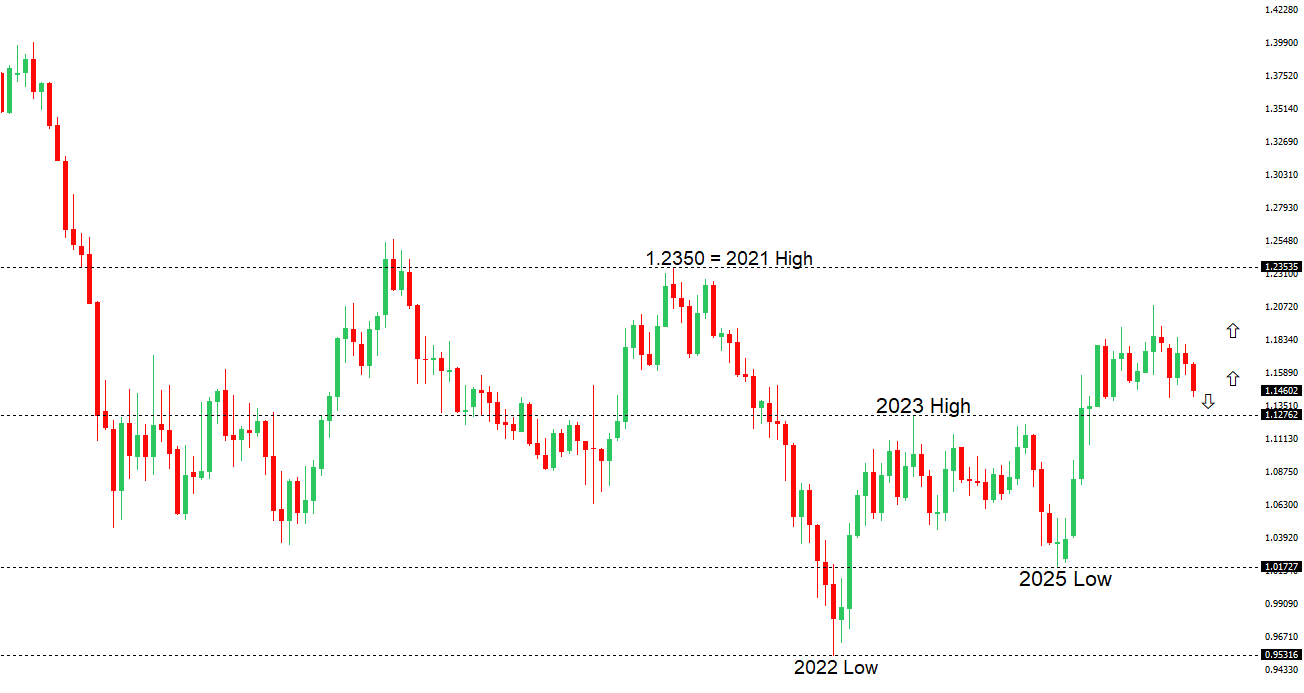 | ||
| R2 1.1529 - 18 June high - Medium R1 1.1440 - 23 June high - Medium S1 1.1361 - 24 June/2026 low - Medium S2 1.1300 - Figure - Medium | ||
| EURUSD: fundamental overview | ||
| The euro remains under pressure, with EURUSD sliding to fresh one-year lows as a resurgent US Dollar continues to dominate the FX landscape. The main driver has been a sharp repricing of Federal Reserve expectations following last week’s FOMC meeting, where Chair Kevin Warsh reinforced a strong commitment to price stability, prompting markets to increase expectations for further US tightening and pushing US yields higher. At the same time, ongoing uncertainty around Middle East diplomacy has supported safe-haven demand for the Dollar, with conflicting signals emerging from US-Iran negotiations and continued efforts to contain regional tensions involving Israel and Hezbollah. On the Eurozone side, the euro is also facing headwinds from widening policy divergence as investors increasingly view the ECB as being closer to the end of its tightening cycle than the Fed. While recent Eurozone activity data has shown signs of stabilization and inflation remains above target, those factors have been overshadowed by the stronger US rate outlook and broad Dollar strength, leaving the single currency on the defensive despite increasingly oversold conditions. | ||
| GBPUSD: technical overview | ||
| The Pound remains exceptionally well supported on dips into the 1.3000 area, with the price largely consolidating above the psychological barrier and previous resistance turned support in the form of the 2023 high. Look for the market to continue be well supported on dips ahead of the next major upside extension through the yearly high at 1.3870 and towards a retest of the 2018 high at 1.4377 further up. Only a monthly close below 1.3000 negates. | ||
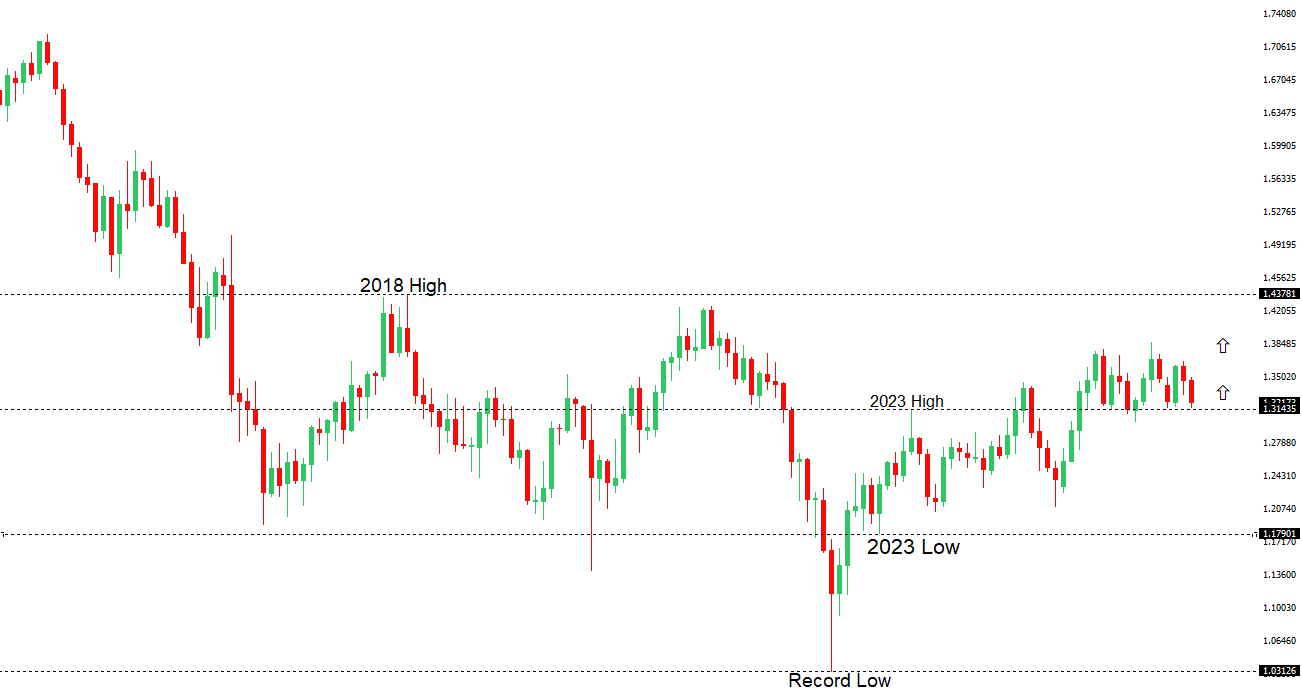 | ||
| R2 1.3509 - 25 May high - Strong R1 1.3325 - 18 June high - Medium S1 1.3163 - 19 June low - Medium S2 1.3159 - 31 May/2026 low - Strong | ||
| GBPUSD: fundamental overview | ||
| The Pound remains under pressure, with GBPUSD weighed down by a combination of growing UK political uncertainty and a stronger US Dollar backdrop. Keir Starmer’s resignation as Prime Minister has injected fresh uncertainty into the UK outlook, with markets now focused on the Labour leadership transition and the potential implications for fiscal policy under a new government. Concerns that a future administration could loosen fiscal rules have added pressure to UK assets, particularly after recent volatility in gilt markets. At the same time, weaker UK economic data has reinforced concerns about slowing growth, with June’s flash Composite PMI falling deeper into contraction territory at a 14-month low, highlighting softening momentum across the private sector. Despite these domestic headwinds, sterling has generally held up better than many peers in recent sessions, suggesting some of the political risk may already have been partially priced in. Nevertheless, the broader driver remains the widening policy divergence between the Bank of England and a more hawkish Federal Reserve, with markets significantly increasing expectations for a Fed rate hike later this year following last week’s FOMC meeting. That shift in rate expectations, alongside resilient US data and lingering demand for the Dollar, continues to act as the main headwind for the pound. | ||
| USDJPY: technical overview | ||
| There are signs of the formation of a meaningful top after the market put in a multi-year high in 2024. At this point, rallies should be well capped below 162.00 in favor of a fresh down-leg back towards the 2024 low at 139.58. Only a monthly close above 162.00 negates. | ||
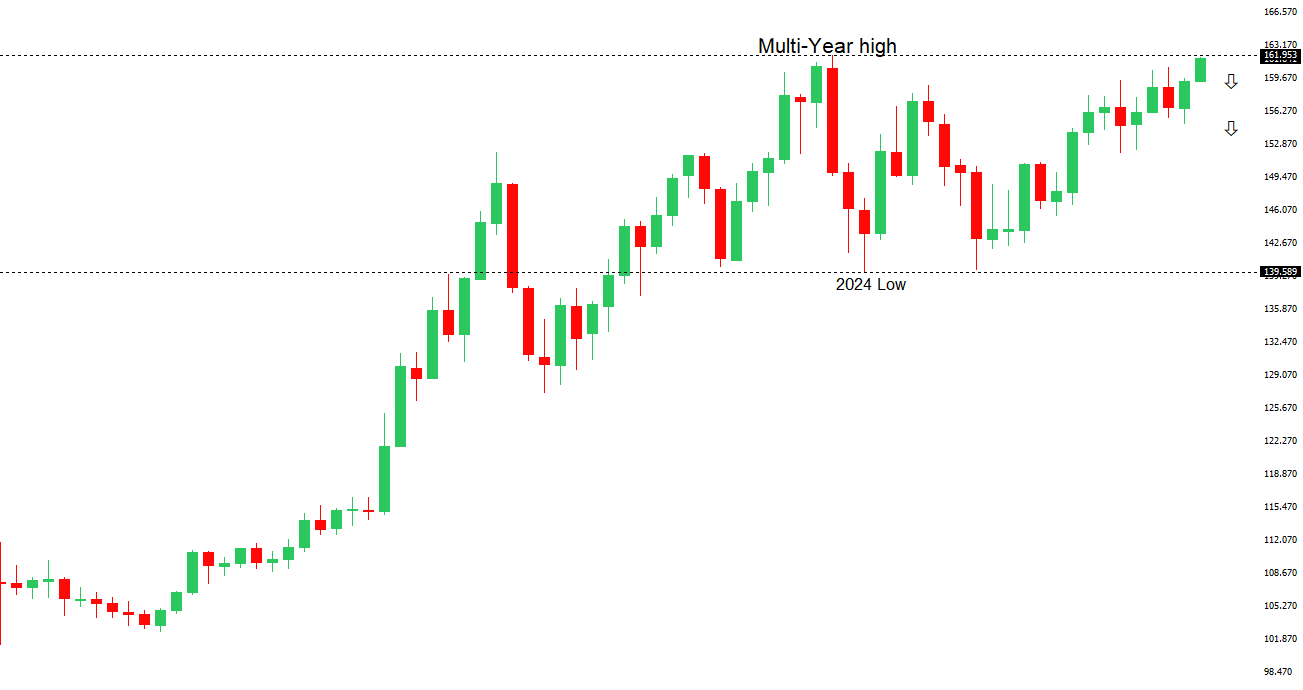 | ||
| R2 161.96 - Multi-Year high/2024 - Very Strong R1 161.93 - 22 June/2026 high - Strong S1 160.41 - 18 June low - Medium S2 159.54 - 11 June low - Strong | ||
| USDJPY: fundamental overview | ||
| The Yen remains under pressure as the combination of a surging US Dollar, rising Federal Reserve rate-hike expectations, and a still-wide US-Japan yield differential continues to favor USDJPY near multi-decade highs. While the Bank of Japan delivered a historic rate increase to 1.0% earlier this month and recent BOJ communications have reinforced expectations for further tightening, markets remain focused on the fact that Japanese rates are still exceptionally low relative to the US, limiting support for the currency. The latest BOJ Summary of Opinions revealed a growing hawkish faction pushing for rate hikes every few months and a policy rate closer to the estimated 2% neutral level, with economists increasingly expecting another hike by year-end and some even as soon as October. Strong inflation signals, including wholesale inflation running at a three-year high and persistent services-sector price pressures, strengthen the case for further normalization. However, geopolitical uncertainty surrounding the Middle East, elevated energy prices, and ongoing carry-trade demand continue to outweigh the BOJ’s tightening narrative for now, leaving the Yen near 40-year lows. Intervention concerns from Japanese authorities are helping cap USDJPY upside around the 162.00 area, but have so far failed to generate a sustained recovery in the currency. | ||
| AUDUSD: technical overview | ||
| There are signs of the formation of a longer-term base with the market recovering out from a meaningful longer-term support zone. The latest monthly close back above 0.7000 takes the big picture pressure off the downside and strengthens the case for a bottom, with the focus now on a push towards 0.8000. Setbacks should now be well supported ahead of 0.6700. | ||
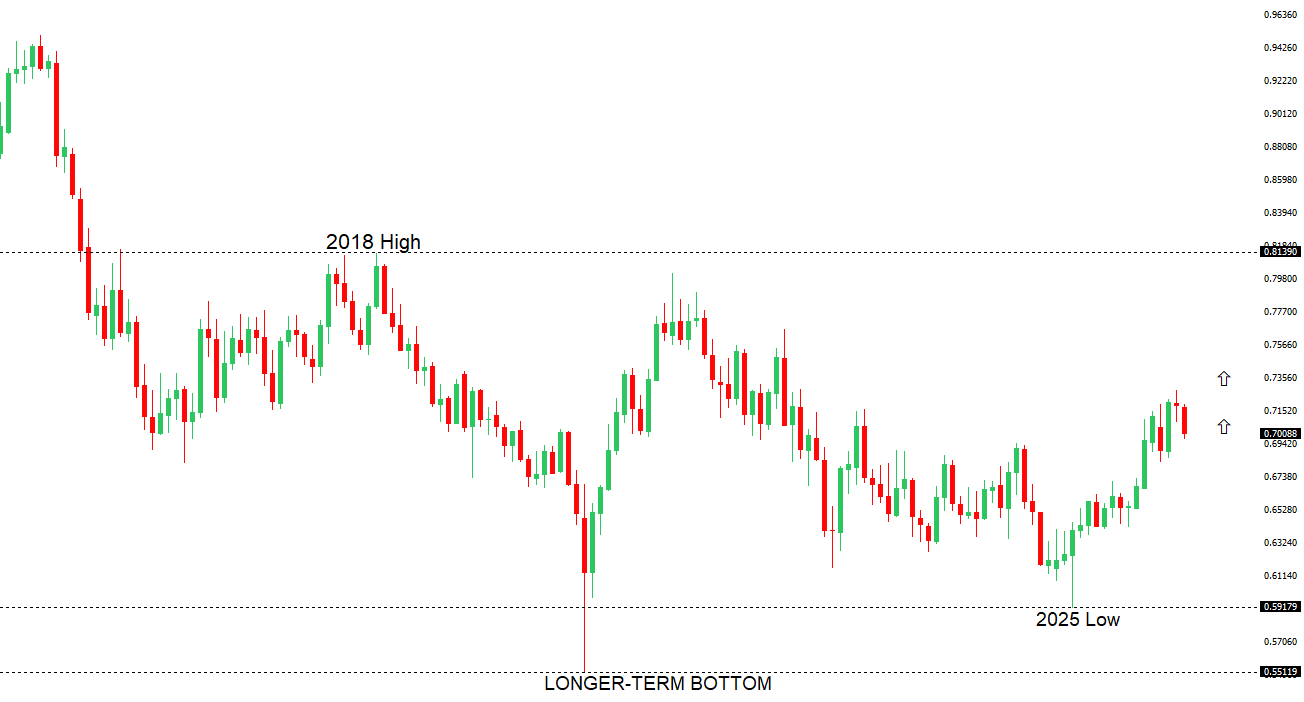 | ||
| R2 0.7089 - 15 June high - Strong R1 0.6979 - 11 June low - Medium S1 0.6901 - 24 June low - Medium S2 0.6833 - 30 March low - Strong | ||
| AUDUSD: fundamental overview | ||
| The Australian Dollar remains under pressure despite another upside surprise in underlying inflation, with May trimmed mean CPI rising 3.6% year-over-year and reinforcing expectations that the RBA may need to tighten policy further. Markets largely looked through the softer headline CPI print, focusing instead on evidence that underlying price pressures remain broad and sticky, particularly across housing and services, where rising rents, dwelling costs and wage-related pressures continue to challenge the RBA’s inflation mandate. One Aussie bank maintained its call for an August rate hike, arguing that second-round effects from higher energy, freight and input costs are increasingly feeding into the broader economy and keeping core inflation elevated. However, the hawkish domestic backdrop has failed to translate into Aussie strength as the currency continues to be weighed down by a resilient US Dollar, expectations for a still-restrictive Federal Reserve, softer global risk appetite and lingering concerns about the outlook for China, Australia’s largest trading partner. As a result, AUDUSD has drifted toward the 0.6900 area despite relatively solid Australian fundamentals, with external macro forces currently overwhelming the support normally provided by rising RBA tightening expectations. | ||
| Suggested reading | ||
| Can Tech Produce Growth Justifying Valuations?, J. Calhoun, Alhambra (June 22, 2026) Billionaire Tycoon Says We’re Looking at Debt Wrong, S. Goldstein, Marketwatch (June 23, 2026) | ||