


 | ||
| 8th July 2026 | view in browser | ||
| Geopolitics reasserts influence on macro narrative | ||
| Renewed US strikes on Iran, rising geopolitical risk and firmer oil prices are keeping markets defensive, supporting the dollar and safe havens while investors balance Middle East developments against the evolving Federal Reserve outlook. | ||
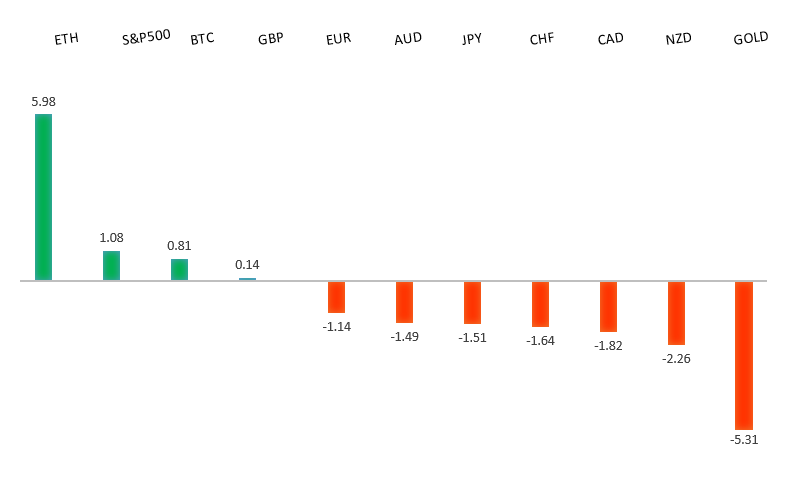
| Performance chart 30day v. USD (%) | ||
 | ||
| Technical & fundamental highlights | ||
| EURUSD: technical overview | ||
| The Euro outlook remains constructive with higher lows sought out on dips in favor of the next major upside extension targeting the 2021 high at 1.2350. Setbacks should be exceptionally well supported ahead of 1.1300. | ||
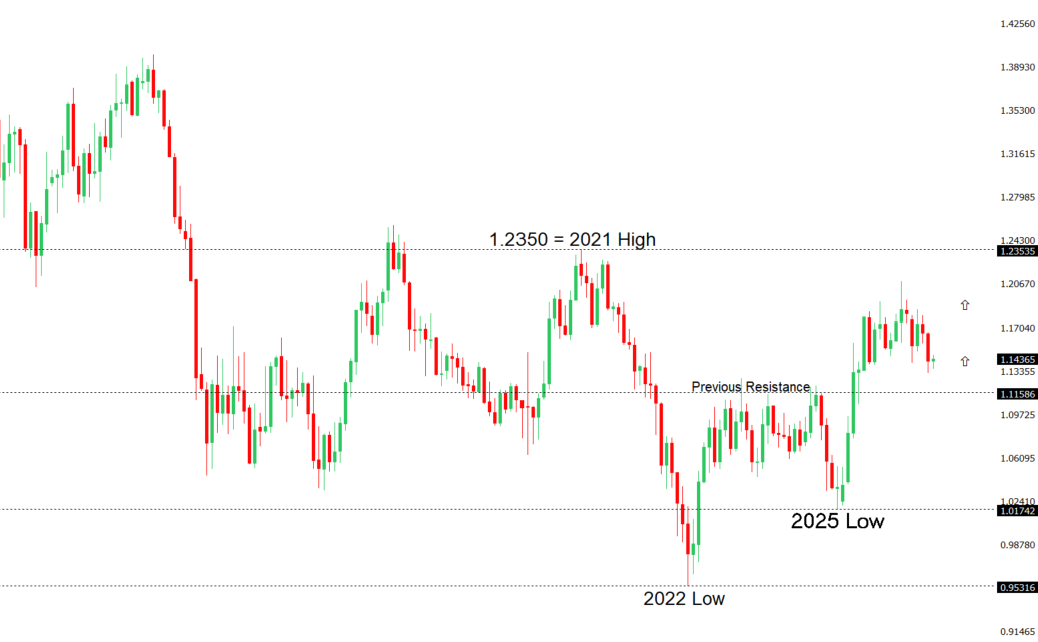 | ||
| R2 1.1529 - 18 June high - Medium R1 1.1473 - 2 July high - Medium S1 1.1325 - 24 June/2026 low - Medium S2 1.1300 - Figure - Medium | ||
| EURUSD: fundamental overview | ||
| The euro remains under modest pressure as renewed geopolitical tensions in the Middle East continue to drive safe-haven demand for the US Dollar, with the latest escalation around the Strait of Hormuz overshadowing otherwise supportive Eurozone fundamentals. While several ECB policymakers have maintained a relatively hawkish tone and markets still expect at least one additional ECB rate hike later this year, those signals have struggled to gain traction as investors focus instead on rising energy prices, geopolitical uncertainty and the resulting boost to the greenback. At the same time, softer-than-expected US labor market data has tempered expectations for further Federal Reserve tightening, limiting broader USD upside and preventing a deeper slide in EURUSD. On the European side, easing inflation has reduced expectations for an imminent ECB move, leaving the single currency lacking a strong domestic catalyst. Attention now turns to the release of the FOMC minutes, which will be scrutinized for clues on how concerned policymakers remain about persistent inflation, particularly if higher oil prices driven by Middle East tensions threaten to keep the Fed’s hawkish bias intact. | ||
| GBPUSD: technical overview | ||
| The Pound remains exceptionally well supported on dips into the 1.3000 area, with the price largely consolidating above the psychological barrier and previous resistance turned support in the form of the 2023 high. Look for the market to continue be well supported on dips ahead of the next major upside extension through the yearly high at 1.3870 and towards a retest of the 2018 high at 1.4377 further up. Only a monthly close below 1.3000 negates. | ||
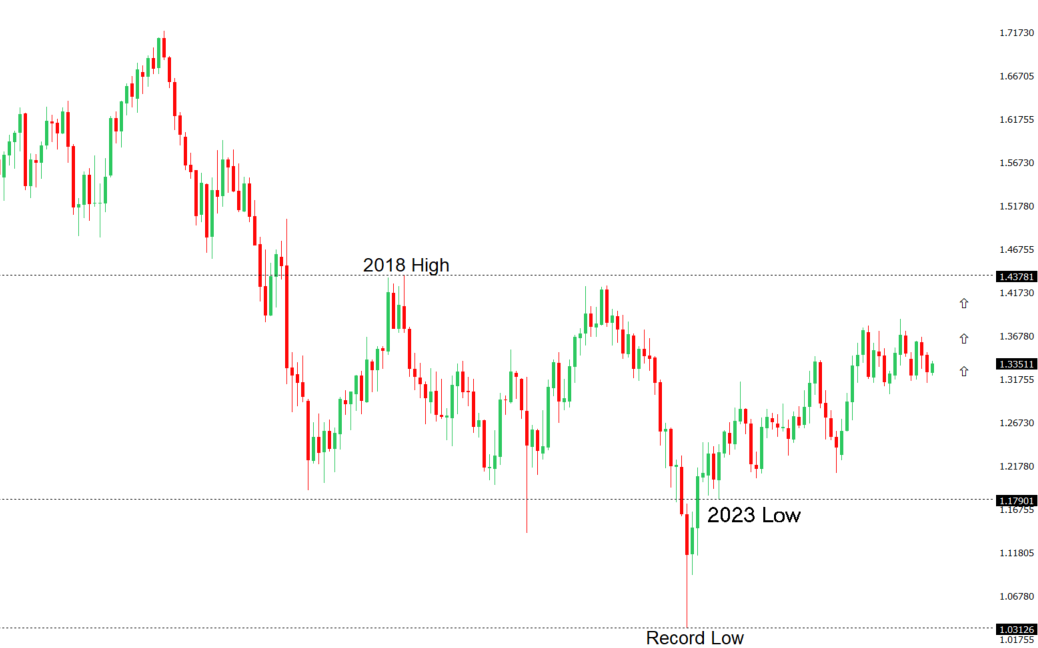 | ||
| R2 1.3461 - 15 June high - Medium R1 1.3402 - 7 July high - Medium S1 1.3262 - 2 July low - Medium S2 1.3212 - 30 June low - Medium | ||
| GBPUSD: fundamental overview | ||
| The pound has lost momentum after a nine-session rally, with GBPUSD retreating from the 1.3400 area as a resurgence in Middle East tensions boosted demand for the safe-haven US Dollar. The renewed escalation around the Strait of Hormuz has weighed on broader risk sentiment, overshadowing an otherwise supportive domestic backdrop for sterling. Fundamentally, the Bank of England remains one of the more hawkish major central banks, with persistent services inflation, elevated inflation expectations and recent hawkish dissent within the Monetary Policy Committee continuing to underpin expectations that policy will need to stay restrictive. However, those positives have recently been outweighed by shifting global risk sentiment and evolving US rate expectations, with sterling’s prior gains driven more by broad US Dollar weakness following softer US labor market data than by UK-specific catalysts. Looking ahead, markets are focused on the FOMC minutes for further guidance on the Federal Reserve’s policy outlook, while UK data remain relatively light, leaving global risk appetite and the direction of the US Dollar as the primary drivers of sterling in the near term. | ||
| USDJPY: technical overview | ||
| The major pair has extended its run to fresh multi-decade highs, with the latest push through 160.00 opening the door for further upside towards 165.00-170.00. At the same time, daily studies are looking quite stretched, suggesting we could see a healthy correction on the horizon. A break back below 160.63 would now strengthen the case for a larger pullback. Until then, the market will continue to be focused on additional gains. | ||
 | ||
| R2 163.00 - Figure - Medium R1 162.84 - Multi-Year high/1 July 2026 - Strong S1 161.00 - Figure - Medium S2 160.48 - 3 July low - Medium | ||
| USDJPY: fundamental overview | ||
| The yen remains fundamentally weak despite finding intermittent support from renewed intervention fears and a modest pullback in US Treasury yields, with USDJPY continuing to trade near multi-decade highs as investors sell into rallies. Japan’s stronger-than-expected household spending data and repeated warnings from Finance Minister Katayama that authorities stand ready to intervene have helped slow the pace of depreciation, while Reuters reporting that officials may shift toward targeting speculative positions rather than relying on verbal warnings has prompted some short-covering in the yen. However, soft wage growth and the Bank of Japan’s still-cautious approach to further tightening continue to limit sustained gains. Although the BOJ lifted rates to 1% in June, board member Asada reinforced that future hikes will depend on evidence of demand-driven inflation and stronger wage growth, keeping markets focused on an October-December timeframe for the next move rather than an imminent hike. Meanwhile, the wide policy gap with the Federal Reserve continues to underpin carry trade demand, even as expectations for additional Fed tightening have eased following weaker US labor data. Escalating geopolitical tensions after renewed US strikes on Iran and attacks on commercial shipping in the Strait of Hormuz have also boosted safe-haven demand, but so far that support has been outweighed by Japan’s still-low yield environment and persistent capital outflows, leaving the broader bias for the yen tilted to the downside. | ||
| AUDUSD: technical overview | ||
| There are signs of the formation of a longer-term base with the market recovering out from a meaningful longer-term support zone. The latest monthly close back above 0.7000 takes the big picture pressure off the downside and strengthens the case for a bottom, with the focus now on a push towards 0.8000. Setbacks should now be well supported ahead of 0.6700. | ||
 | ||
| R2 0.7089 - 15 June high - Strong R1 0.6979 - 11 June low - Medium S1 0.6865 - 30 June low - Medium S2 0.6833 - 30 March low - Strong | ||
| AUDUSD: fundamental overview | ||
| The Australian dollar remains primarily driven by swings in global risk sentiment, with renewed US-Iran hostilities and escalating attacks around the Strait of Hormuz boosting oil prices and reviving safe-haven demand for the US dollar, weighing on the high-beta Aussie. At the same time, higher energy prices are reinforcing concerns that global inflation pressures could prove more persistent, supporting expectations that the Federal Reserve will keep policy restrictive for longer ahead of the FOMC minutes and US jobless claims. Domestically, the Reserve Bank of Australia continues to provide an important offset, with Assistant Governor Hunter reiterating that the Board stands ready to tighten policy further if the oil shock lifts inflation expectations, while stressing that supply-side inflation cannot simply be ignored despite the potential hit to growth. Those comments reinforce the RBA’s hawkish bias following three rate hikes this year, even as policymakers remain data dependent. With little domestic data on the immediate calendar, the Australian dollar is likely to remain highly sensitive to developments in the Middle East, moves in the US dollar, broader risk appetite and evolving expectations for both Fed and RBA policy. | ||
| Suggested reading | ||
| Is It Different This Time? 4 Open Questions, A. Grossman, HumbleDollar (July 6, 2026) Your Investing Plans Are Double the Historical Reality, M. Hulbert, Marketwatch (July 6, 2026) | ||