


 | ||
| 27th August 2026 | view in browser | ||
| Nvidia lifts sentiment ahead of Jackson Hole | ||
| Global markets are holding steady into Thursday, with the dollar supported by elevated US yields, technology shares lifted by Nvidia, the Australian dollar outperforming on hawkish RBA expectations, and investors awaiting Warsh’s Jackson Hole speech for clearer direction. | ||
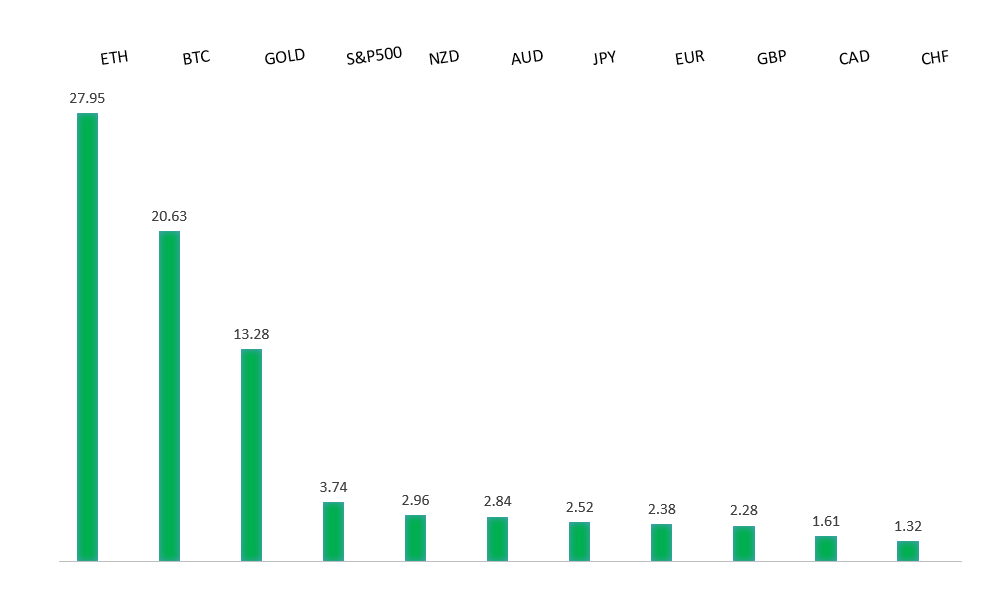
| Performance chart 30day v. USD (%) | ||
 | ||
| Technical & fundamental highlights | ||
| EURUSD: technical overview | ||
| The Euro outlook remains constructive with higher lows sought out on dips in favor of the next major upside extension targeting the 2021 high at 1.2350. Setbacks should be exceptionally well supported ahead of 1.1400. | ||
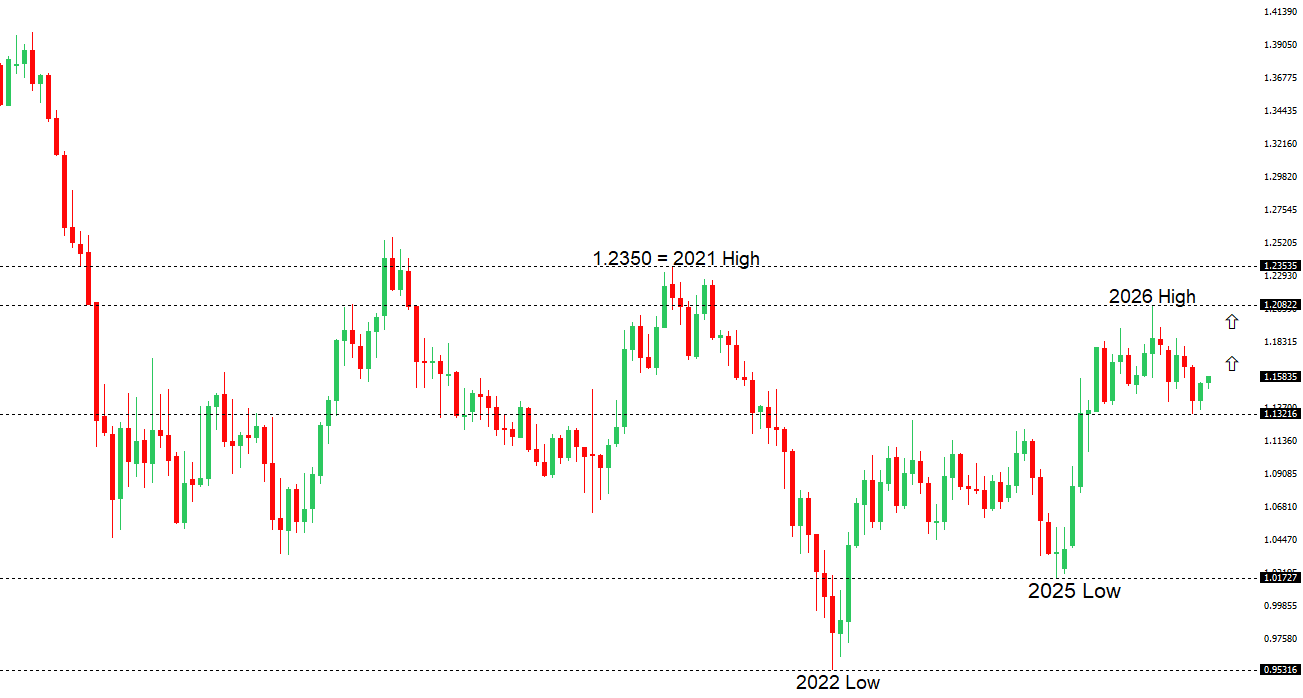 | ||
| R2 1.1797 - 6 May high - Medium R1 1.1712 - 21 August high - Medium S1 1.1570 - 19 May low - Medium S2 1.1512 - 313 August low - Medium | ||
| EURUSD: fundamental overview | ||
| The euro remains well supported by increasingly hawkish ECB expectations, with markets pricing a strong chance of another rate increase in September and further tightening by year-end. ECB officials, including Schnabel, have highlighted upside inflation risks from the prolonged Middle East conflict and the surprising resilience of the eurozone economy, reinforcing the view that borrowing costs may need to rise further. This policy backdrop has helped EURUSD hold up, although gains have been kept in check by consolidation following the recent rally and uncertainty surrounding the US rate outlook. Attention now shifts to Fed Chair Warsh’s Jackson Hole speech, particularly after US inflation data offered little clarity, with core PCE matching expectations but headline inflation coming in slightly hotter. | ||
| GBPUSD: technical overview | ||
| The Pound remains exceptionally well supported on dips into the 1.3000 area, with the price largely consolidating above the psychological barrier and previous resistance turned support in the form of the 2023 high. Look for the market to continue be well supported on dips ahead of the next major upside extension through the yearly high at 1.3870 and towards a retest of the 2018 high at 1.4377 further up. Only a monthly close below 1.3000 negates. | ||
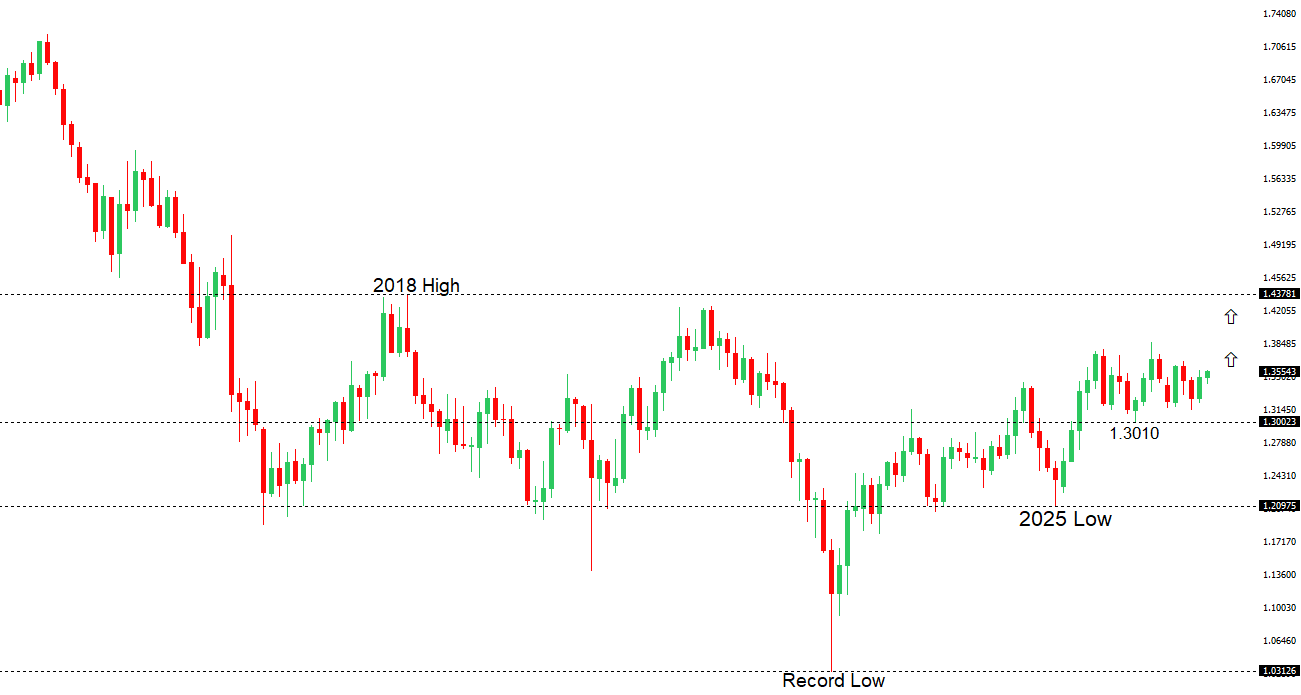 | ||
| R2 1.3700 - Figure - Strong R1 1.3676 - 21 August high - Medium S1 1.3523 - 19 August low - Medium S2 1.3474 - 13 Augus low - Medium | ||
| GBPUSD: fundamental overview | ||
| Sterling remains well supported near six-month highs, underpinned by resilient UK data, elevated gilt yields and lingering Bank of England tightening risk after July inflation rose to 2.9% and three MPC members voted for a rate hike. However, the pound’s broader August advance has also owed heavily to US dollar weakness, leaving it vulnerable when US data or Fed expectations support the greenback, as seen following Wednesday’s slightly firmer headline PCE reading. With no major UK releases left this week, domestic policy expectations are unlikely to shift meaningfully, while concerns over high borrowing costs and limited fiscal headroom remain a background restraint. Near-term direction should therefore be driven primarily by the dollar and Fed Chair Warsh’s Jackson Hole address on Friday, with markets looking for clarity on how the Fed will respond to still-elevated inflation. | ||
| USDJPY: technical overview | ||
| The major pair has entered a period of correction and consolidation after extending its run to fresh multi-decade highs at 163.99. Setbacks are now expected to be well supported above 155.00, with only a break below to compromise the bullish structure. | ||
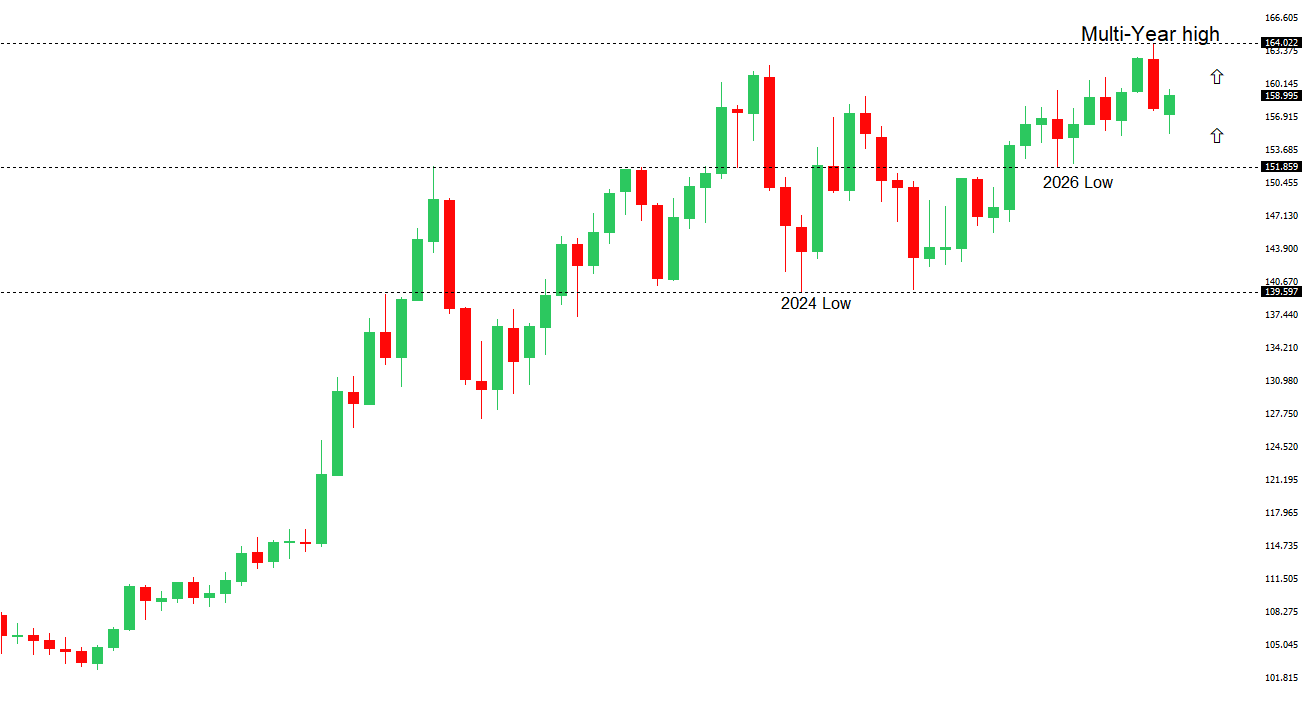 | ||
| R2 160.00 - Psychological - Strong R1 159.78 - 17 August high - Medium S1 158.02 - 20 August low - Medium S2 156.67 - 7 August low - Medium | ||
| USDJPY: fundamental overview | ||
| Yen declines have stalled out as optimism around a potential US-Iran ceasefire and the reopening of commercial shipping routes through the Strait of Hormuz has eased geopolitical concerns and restrained the dollar. Still, yen gains remain limited by Japan’s deteriorating fiscal outlook and the wide US-Japan interest-rate differential, particularly as sticky US inflation keeps the possibility of further Fed tightening alive. Markets are now looking to Friday’s Tokyo CPI report for clues on the pace of future Bank of Japan rate hikes, while Fed Chair Warsh’s Jackson Hole speech will be critical in shaping the US rate outlook and the next move in USDJPY. | ||
| AUDUSD: technical overview | ||
| There are signs of the formation of a longer-term base with the market recovering out from a meaningful longer-term support zone. The latest monthly close back above 0.7000 takes the big picture pressure off the downside and strengthens the case for a bottom, with the focus now on a push towards 0.8000. Setbacks should now be well supported ahead of 0.6700. | ||
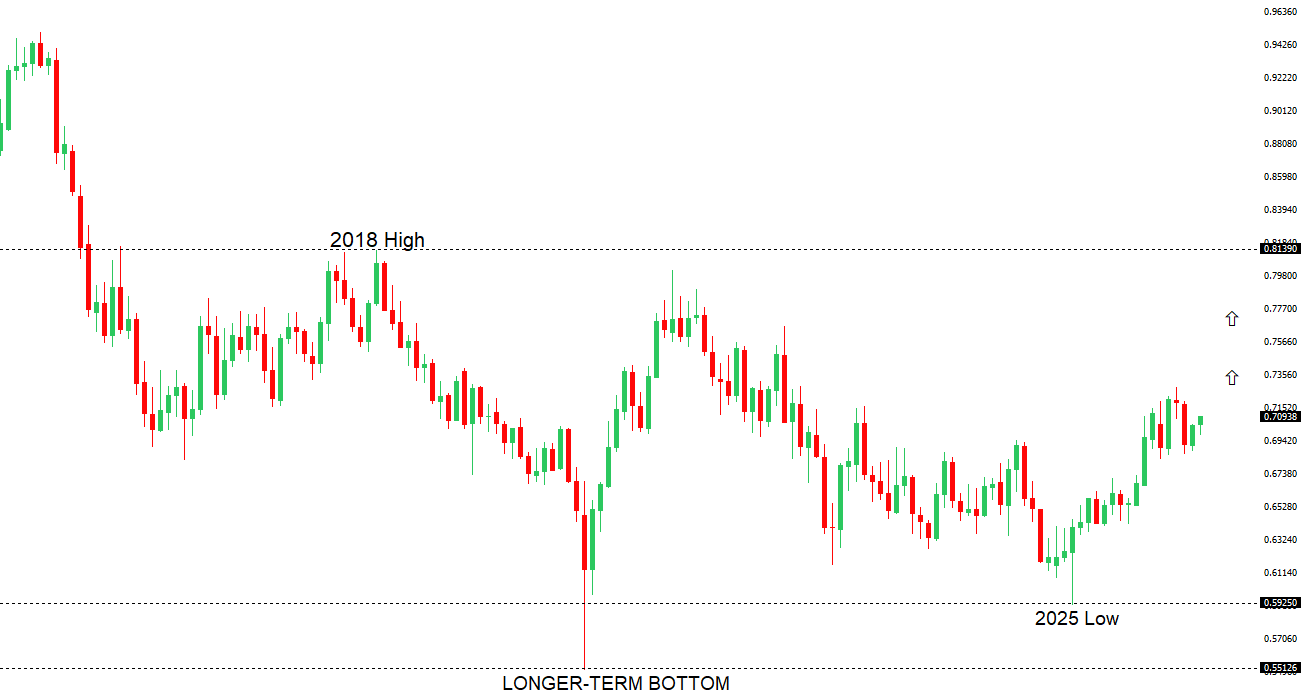 | ||
| R2 0.7201 - 29 May high - Strong R1 0.7189 - 26 August high - Medium S1 0.7067 - 19 August low - Medium S2 0.6984 - 3 August low - Strong | ||
| AUDUSD: fundamental overview | ||
| The Australian dollar remains well supported by a sharp repricing of RBA policy expectations after hotter-than-expected July inflation reinforced concerns that price pressures are proving persistent. Major Australian banks now expect the cash rate to rise to 4.60%. The currency has largely shrugged off a steep decline in second-quarter private capital expenditure, with broader indicators continuing to suggest an economy that is soft rather than seriously weak. Still, the upside has been limited by a firm US dollar following slightly hotter headline PCE inflation, while traders await further policy direction from Fed Chair Warsh at Jackson Hole. | ||
| Suggested reading | ||
| How Do We Get Investors To Do Less?, J. Wiggins, Behavioral Investment (August 25, 2026) How This Market Cycle Could End, B. Carlson, AWOCS (August 25, 2026) | ||