Day Image
7th August 2025 | view in browser
Trump’s tariff talk and Fed chatter sink Dollar

On Wednesday, the U.S. dollar dropped significantly due to the Federal Reserve’s dovish remarks and uncertainty surrounding potential tariffs.


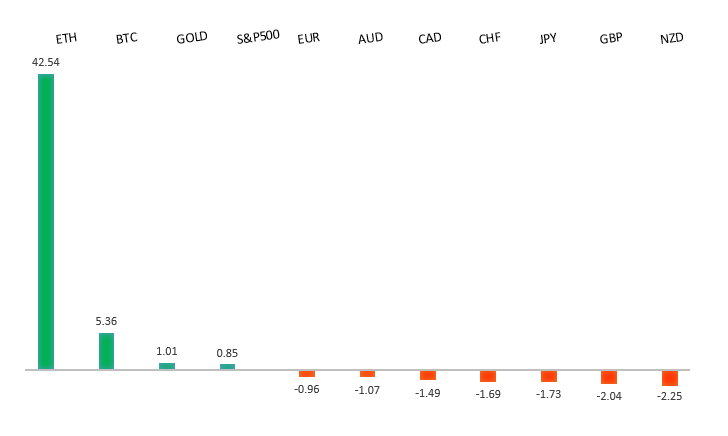
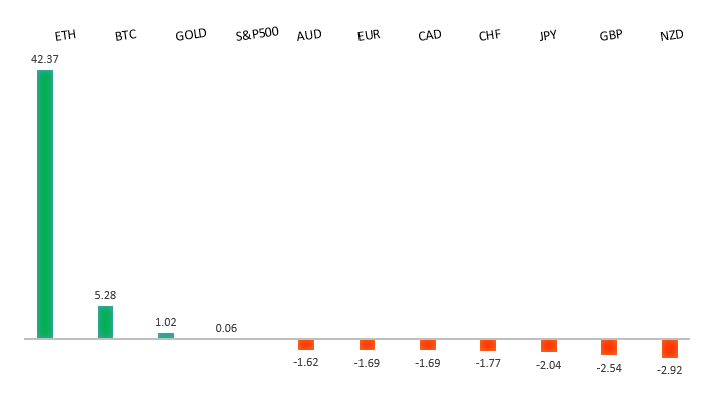
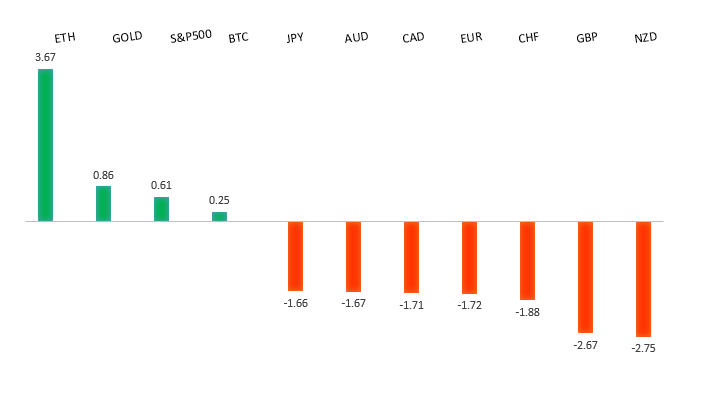
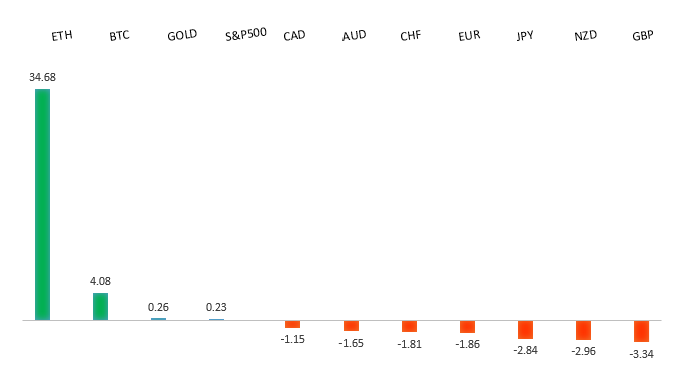
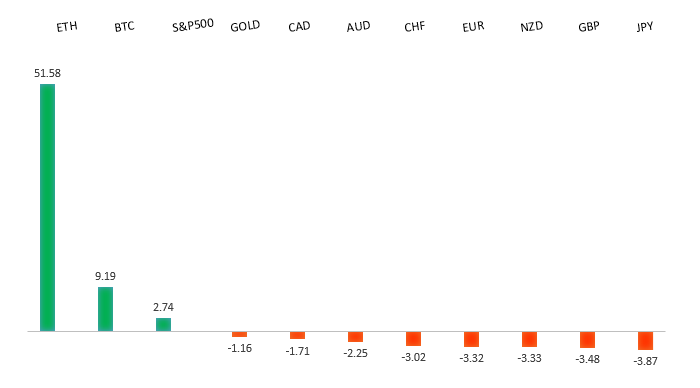
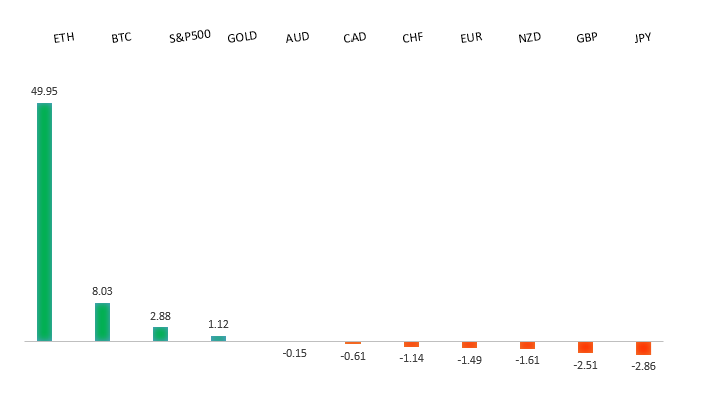
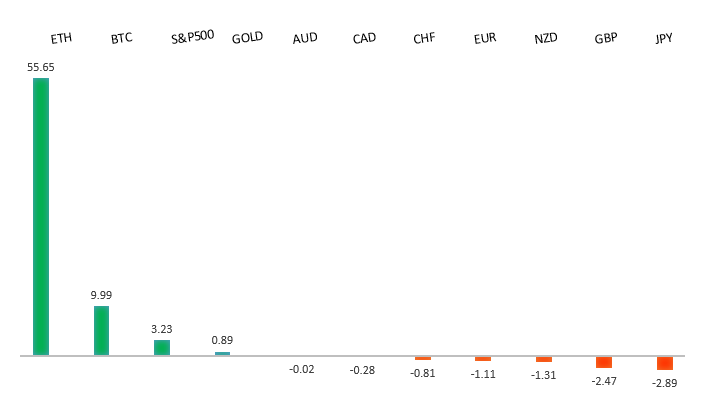
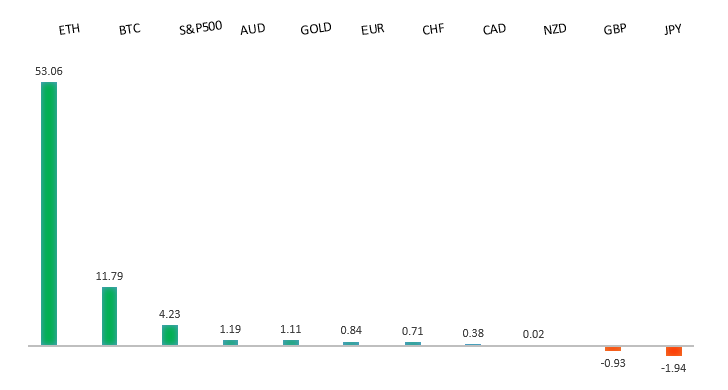
Performance chart 30day v. USD (%)
Performance Chart
 
 
Technical & fundamental highlights
EURUSD: technical overview

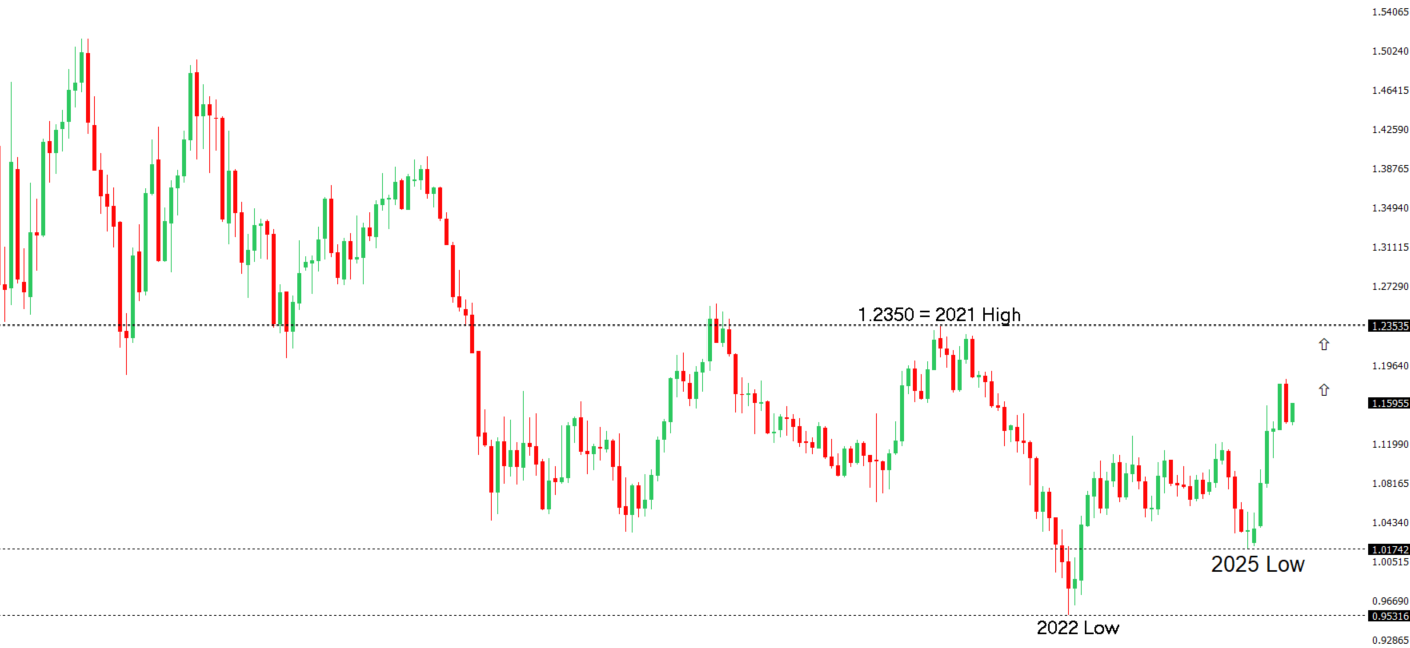
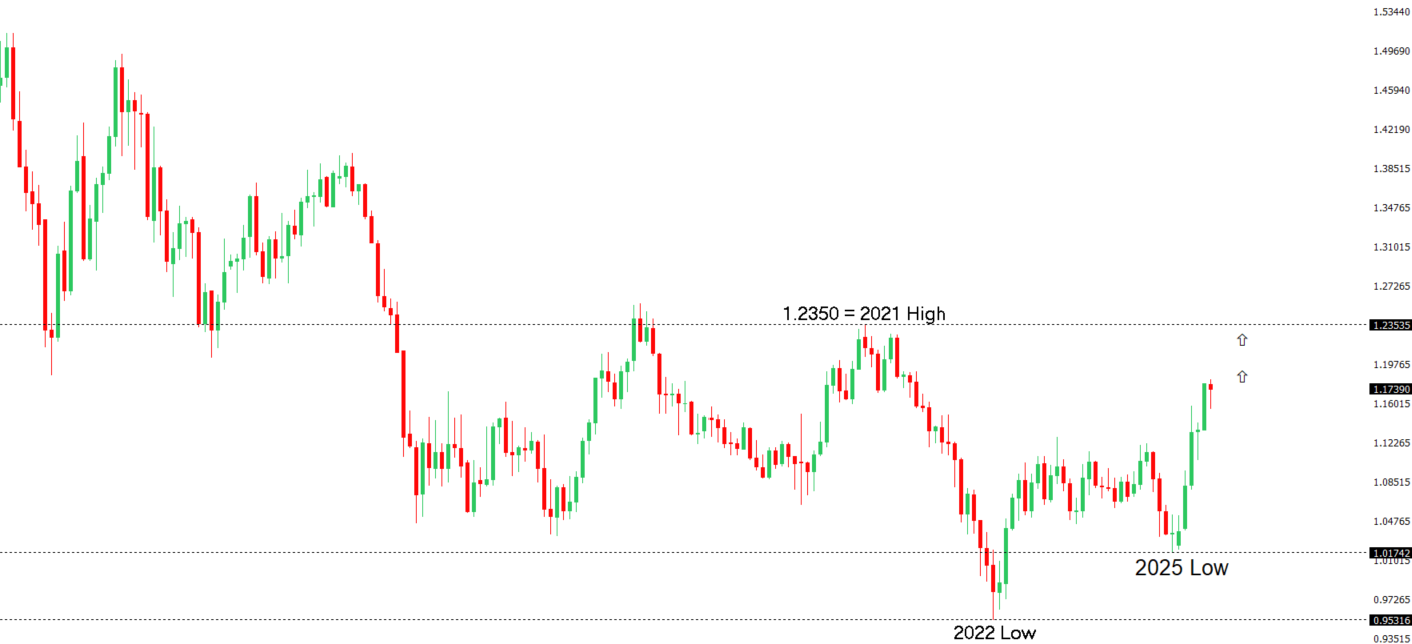
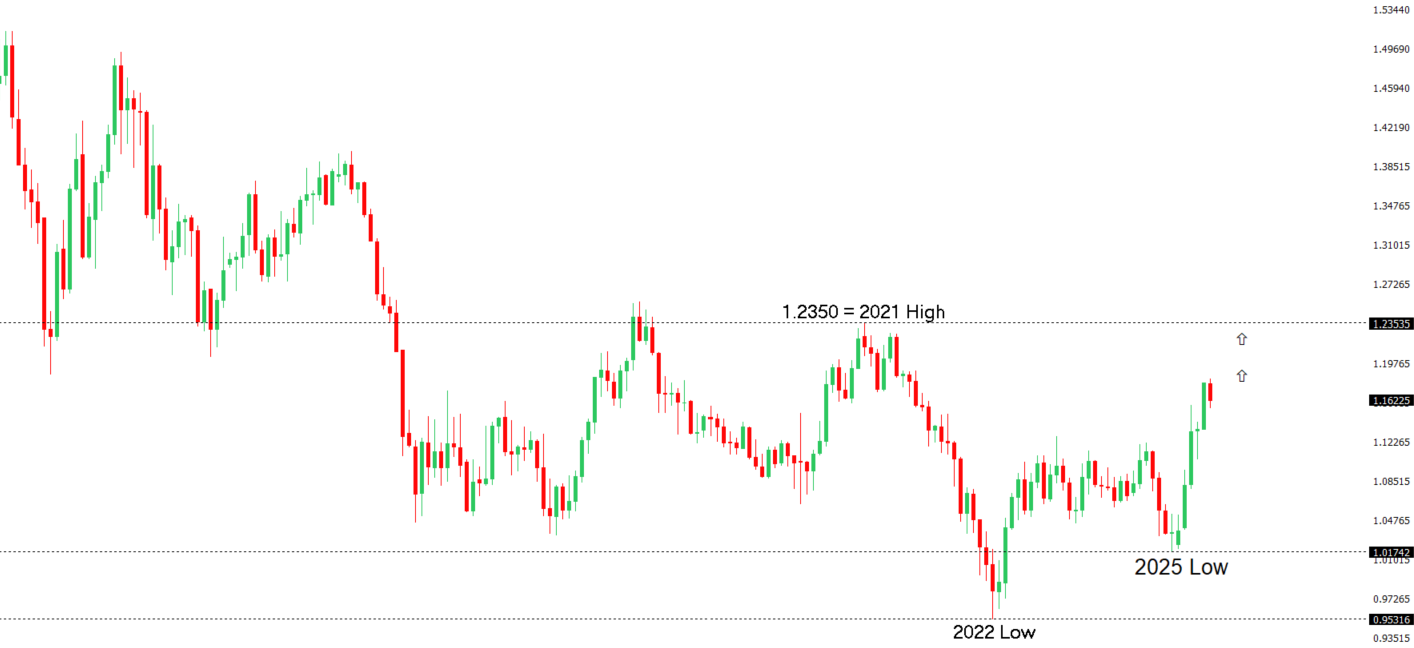
The Euro has broken out from a multi-month consolidation off a critical longer-term low. This latest push through the 2023 high (1.1276) lends further support to the case for a meaningful bottom, setting the stage for a bullish structural shift and the next major upside extension targeting the 2021 high at 1.2350. Setbacks should be exceptionally well supported ahead of 1.1000.

EURUSD Chart
R2 1.1703 - 25 July low - Medium
R1 1.1669 - 6 August high - Medium
S1 1.1392 - 1 August low - Medium
S2 1.1210 - 29 May low - Strong
EURUSD: fundamental overview

The European Central Bank is unlikely to cut interest rates further soon, with outgoing Governing Council member Robert Holzmann suggesting rates are appropriately set and the bank should monitor global economic developments, particularly U.S. tariffs. ECB President Lagarde emphasized a data-dependent approach, and while recent Eurozone data shows resilient consumer demand with strong retail sales, Germany’s factory orders disappointed, though revisions may occur. Market expectations lean toward minimal ECB rate cuts this year, potentially one in December, while U.S. Federal Reserve policy divergence and concerns over manipulated U.S. economic data could influence the EURUSD exchange rate.

 
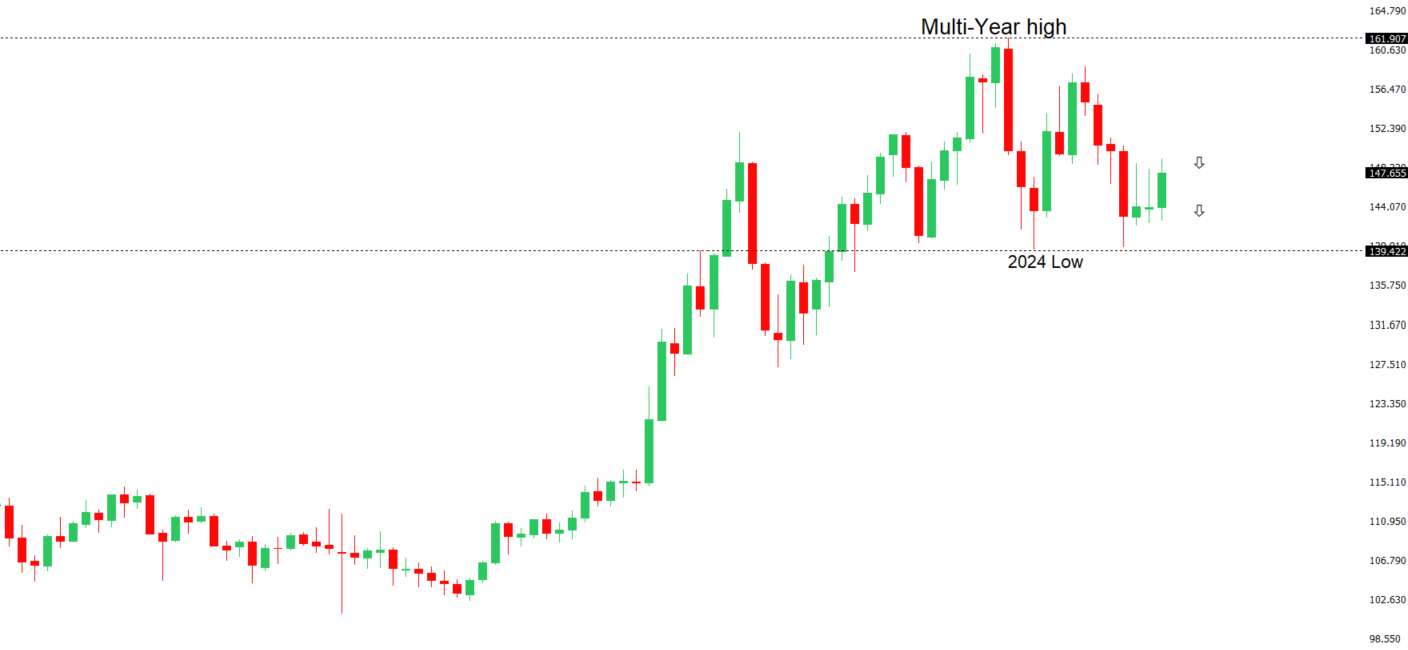
USDJPY: technical overview

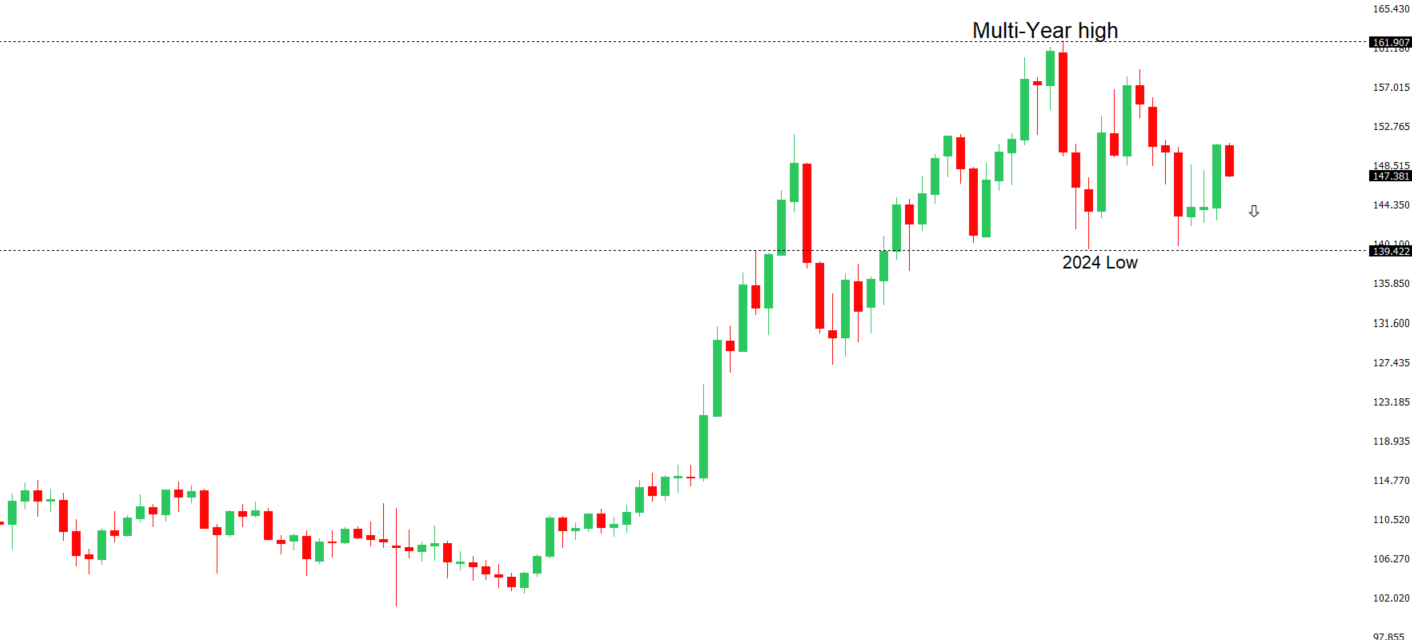
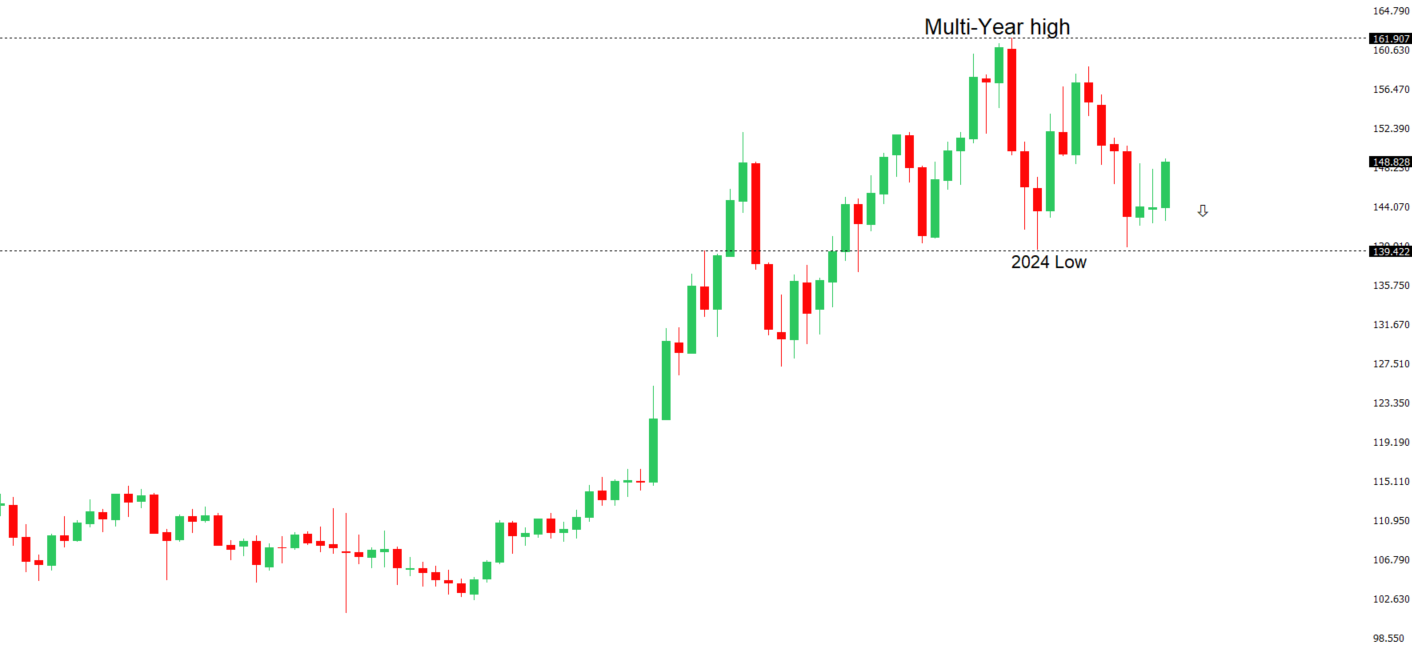
There are signs of a meaningful top in place after the market put in a multi-year high in 2024. At this point, the door is now open for a deeper setback below the 2024 low at 139.58, exposing a retest of the 2023 low. Rallies should be well capped below 152.00.

USDJPY Chart
R2 150.92 - 1 August high - Strong
R1 149.00 - Figure - Medium
S1 146.62 - 5 August low - Medium
S2 145.85 - 24 July low - Strong
USDJPY: fundamental overview

Confusion surrounds a U.S.-Japan trade deal, with the U.S. clarifying that a 15% tariff will apply to all Japanese exports, contrary to Japan’s expectation that only goods below 15% would be affected, potentially escalating trade tensions. Japan’s markets are focused on a 30-year JGB auction, where a weak outcome could raise concerns about fiscal expansion and hinder yen recovery. Taro Kono, a ruling party member, echoed calls for tighter monetary policy to strengthen the yen, urging the Bank of Japan to raise rates while criticizing past economic policies. A government panel proposed a record 6% minimum wage hike to JPY 1,118, signaling a robust wage-price cycle that supports BOJ’s confidence in potential rate hikes. Despite nominal wages rising 2.5% in June, real earnings fell 1.3% due to inflation, though wage data supports BOJ’s outlook. Political uncertainty looms as the Liberal Democratic Party meets to review its electoral loss, with potential leadership changes possibly impacting BOJ policy expectations and yen volatility.

 
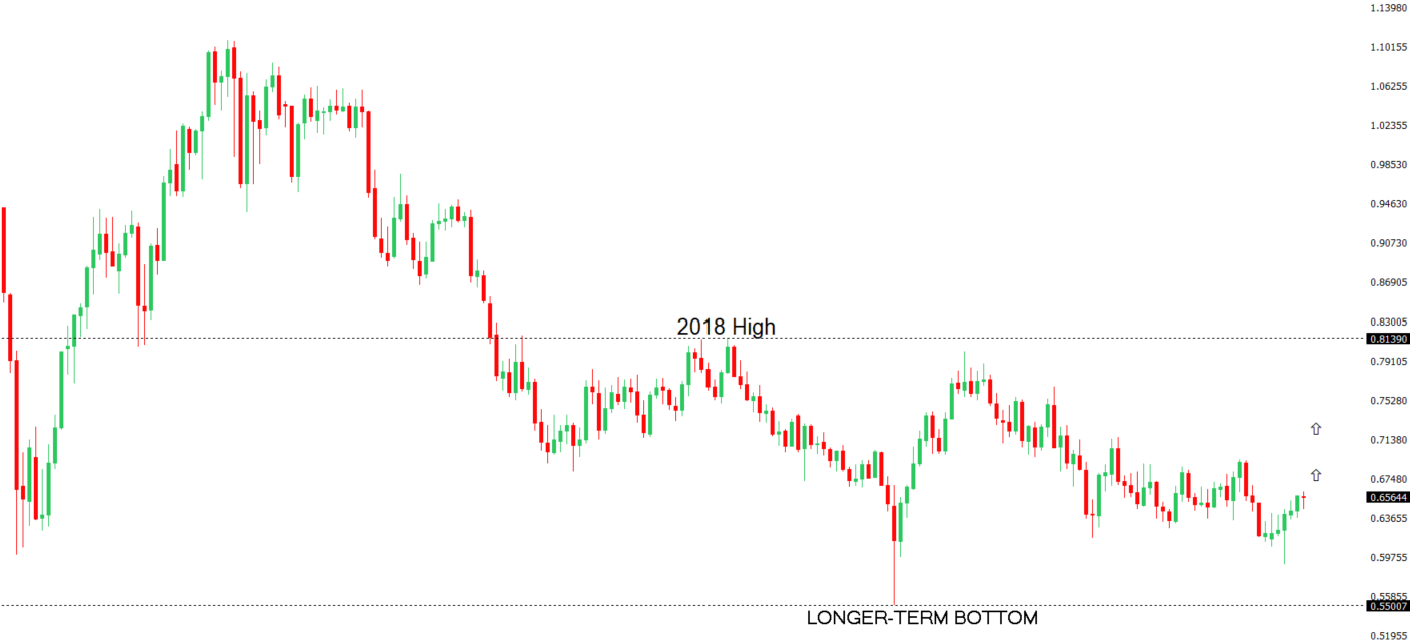
AUDUSD: technical overview

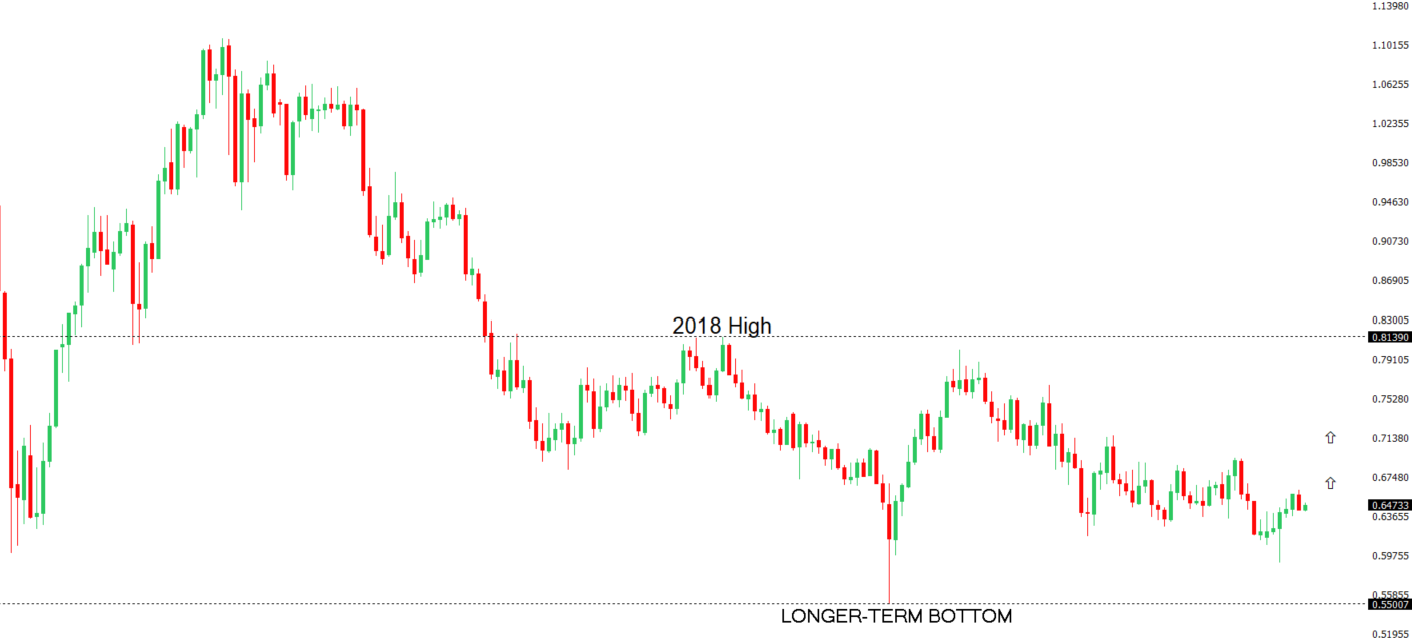
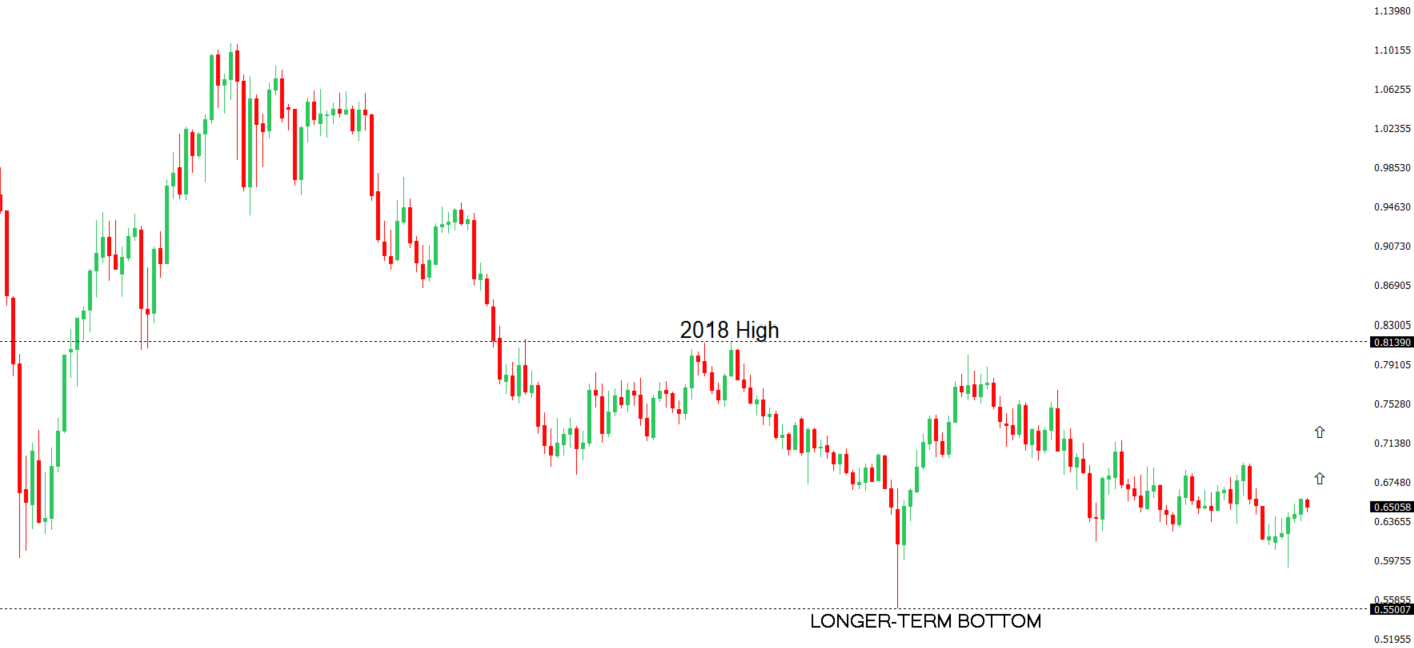
There are signs of the potential formation of a longer-term base with the market trading down into a meaningful longer-term support zone. Only a monthly close below 0.5500 would give reason for rethink. A monthly close back above 0.7000 will take the big picture pressure off the downside and strengthen case for a bottom.

AUDUSD Chart
R2 0.6688 - 7 November 2024 high - Strong
R1 0.6625 - 24 July/2025 high - Medium
S1 0.6419 - 1 August low - Medium
S1 0.6373 - 23 June low - Strong
AUDUSD: fundamental overview

Australian household spending grew 4.8% year-over-year in June, driven by sectors like clothing and recreation, but monthly growth slowed to 0.5%, below expectations, amid rising household costs and fading post-rate cut effects. Bloomberg Economics warns that cooling migration and high household debt could weaken spending momentum, despite Australia facing lower tariffs. Markets anticipate at least two RBA rate cuts in 2025, but analysts, including former RBA executive Jonathan Kearns, expect a cautious approach, with cuts likely in August and November, contingent on economic data, particularly unemployment trends.

 
Suggested reading

Meme Stocks & Mr. Market, B. Carlson,  A Wealth of Common Sense (August 5, 2025)

Don’t Let Crypto Boom Deter You From Jumping In Now, S. McBride, RiskHedge (August 5, 2025)


Any opinions, news, research, analyses, prices or other information ("information") contained on this Blog, constitutes marketing communication and it has not been prepared in accordance with legal requirements designed to promote the independence of investment research. Further, the information contained within this Blog does not contain (and should not be construed as containing) investment advice or an investment recommendation, or an offer of, or solicitation for, a transaction in any financial instrument. LMAX Group has not verified the accuracy or basis-in-fact of any claim or statement made by any third parties as comments for every Blog entry.

LMAX Group will not accept liability for any loss or damage, including without limitation to, any loss of profit, which may arise directly or indirectly from use of or reliance on such information. No representation or warranty is given as to the accuracy or completeness of the above information. While the produced information was obtained from sources deemed to be reliable, LMAX Group does not provide any guarantees about the reliability of such sources. Consequently any person acting on it does so entirely at his or her own risk. It is not a place to slander, use unacceptable language or to promote LMAX Group or any other FX and CFD provider and any such postings, excessive or unjust comments and attacks will not be allowed and will be removed from the site immediately.

Day Image
6th August 2025 | view in browser
Dollar dips as ISM services disappoints

The U.S. dollar has come under additional pressure after a weak ISM Services report showed a headline drop to 50.1, though prices paid hit their highest level since October 2022.


Performance chart 30day v. USD (%)
Performance Chart
 
 
Technical & fundamental highlights
EURUSD: technical overview

The Euro has broken out from a multi-month consolidation off a critical longer-term low. This latest push through the 2023 high (1.1276) lends further support to the case for a meaningful bottom, setting the stage for a bullish structural shift and the next major upside extension targeting the 2021 high at 1.2350. Setbacks should be exceptionally well supported ahead of 1.1000.

EURUSD Chart
R2 1.1703 - 25 July low - Medium
R1 1.1600 - Figure - Medium
S1 1.1392 - 1 August low - Medium
S2 1.1210 - 29 May low - Strong
EURUSD: fundamental overview

The euro is expected to recover against the dollar as eurozone fiscal stimulus takes effect by year-end. Recent Eurozone data shows rising producer prices, suggesting the ECB will maintain a cautious, data-dependent approach to rate cuts, potentially supporting the euro. Meanwhile, a weaker U.S. jobs report has raised speculation that the Federal Reserve might cut rates by 50 basis points in September, highlighting diverging monetary policies between the Fed and the ECB. ECB official Christodoulos Patsalides noted the eurozone’s resilience, with 0.1% growth in Q2, despite global uncertainties, and emphasized that ECB policy will remain flexible due to high uncertainty.

 
USDJPY: technical overview

There are signs of a meaningful top in place after the market put in a multi-year high in 2024. At this point, the door is now open for a deeper setback below the 2024 low at 139.58, exposing a retest of the 2023 low. Rallies should be well capped below 152.00.

USDJPY Chart
R2 150.92 - 1 August high - Strong
R1 149.00 - Figure - Medium
S1 146.62 - 5 August low - Medium
S2 145.85 - 24 July low - Strong
USDJPY: fundamental overview

Japan’s trade negotiator, Ryosei Akazawa, is pressing the U.S. to quickly implement a recent trade deal, focusing on lowering tariffs on Japanese cars and parts, though the timeline remains vague and the lack of a formal agreement raises concerns about enforceability and potential disputes. The Bank of Japan’s June meeting minutes highlight the risks of U.S. tariffs but affirm plans for rate hikes if trade tensions don’t escalate, with market attention on the upcoming July meeting summary for fresh policy insights. Mitsubishi UFJ’s CEO, Hinori Kamezawa, supports a BOJ rate hike due to strong inflation and labor shortages, while a government panel’s proposed 6% minimum wage increase—the largest since 1978—signals a sustained wage-price cycle. June wage data shows nominal earnings up 2.5%, the fastest in four months, but real earnings fell 1.3% due to inflation, reinforcing the BOJ’s confidence in its rate-hiking path.

 
AUDUSD: technical overview

There are signs of the potential formation of a longer-term base with the market trading down into a meaningful longer-term support zone. Only a monthly close below 0.5500 would give reason for rethink. A monthly close back above 0.7000 will take the big picture pressure off the downside and strengthen case for a bottom.

AUDUSD Chart
R2 0.6688 - 7 November 2024 high - Strong
R1 0.6625 - 24 July/2025 high - Medium
S1 0.6419 - 1 August low - Medium
S1 0.6373 - 23 June low - Strong
AUDUSD: fundamental overview

Australia’s household spending grew 4.8% year-on-year in June, the fastest since January 2024, but monthly growth slowed to 0.5%, below the expected 0.8%. Higher costs and waning post-rate cut effects moderated spending, with clothing, furnishings, recreation, and miscellaneous goods driving the increase. Discounting boosted spending, but cooling migration and global demand pressures may weaken momentum, especially given Australia’s high household debt. Markets anticipate two rate cuts in 2025, but the Reserve Bank of Australia is expected to remain cautious, with cuts likely only if economic data, particularly unemployment, worsens significantly.

 
Suggested reading

‘Independent’ Shouldn’t Mean ‘Beyond Criticism’, T. Bliman,  Fisher Investments (August 3, 2025)

Will data centers crash the economy?, N. Smith, Noahopinion (August 2, 2025)


Any opinions, news, research, analyses, prices or other information ("information") contained on this Blog, constitutes marketing communication and it has not been prepared in accordance with legal requirements designed to promote the independence of investment research. Further, the information contained within this Blog does not contain (and should not be construed as containing) investment advice or an investment recommendation, or an offer of, or solicitation for, a transaction in any financial instrument. LMAX Group has not verified the accuracy or basis-in-fact of any claim or statement made by any third parties as comments for every Blog entry.

LMAX Group will not accept liability for any loss or damage, including without limitation to, any loss of profit, which may arise directly or indirectly from use of or reliance on such information. No representation or warranty is given as to the accuracy or completeness of the above information. While the produced information was obtained from sources deemed to be reliable, LMAX Group does not provide any guarantees about the reliability of such sources. Consequently any person acting on it does so entirely at his or her own risk. It is not a place to slander, use unacceptable language or to promote LMAX Group or any other FX and CFD provider and any such postings, excessive or unjust comments and attacks will not be allowed and will be removed from the site immediately.

Day Image
5th August 2025 | view in browser
Dollar holds steady after NFP selloff

The U.S. dollar held steady on Monday after Friday’s sharp selloff triggered by the Non-Farm Payrolls report. Looking ahead to Tuesday, markets await the U.S. trade balance, final PMIs, and ISM services data, which could influence expectations for a potential September rate cut.


Performance chart 30day v. USD (%)
Performance Chart
 
 
Technical & fundamental highlights
EURUSD: technical overview

The Euro has broken out from a multi-month consolidation off a critical longer-term low. This latest push through the 2023 high (1.1276) lends further support to the case for a meaningful bottom, setting the stage for a bullish structural shift and the next major upside extension targeting the 2021 high at 1.2350. Setbacks should be exceptionally well supported ahead of 1.1000.

EURUSD Chart
R2 1.1703 - 25 July low - Medium
R1 1.1600 - Figure - Medium
S1 1.1392 - 1 August low - Medium
S2 1.1210 - 29 May low - Strong
EURUSD: fundamental overview

The Euro plummeted in July due to robust US economic data, a hawkish Federal Reserve, and tensions over a new US-EU trade deal, but a weaker-than-expected US jobs report last Friday sparked a sharp rebound as hopes for earlier Fed rate cuts resurfaced. Some analysts speculate the Fed may opt for a significant 50bps rate cut in September if labor markets weaken further, contrasting with the ECB, which is nearing the end of its easing cycle as Eurozone inflation stabilizes. Despite resilient 0.1% growth in Q2, the Eurozone faces challenges from global trade tensions, with a sharp drop in August’s Sentix Investor Confidence to -3.7, driven by a 15% EU import tariff, particularly hitting Germany’s sentiment, signaling potential pressure on the ECB to reassess its cautious stance.

 
USDJPY: technical overview

There are signs of a meaningful top in place after the market put in a multi-year high in 2024. At this point, the door is now open for a deeper setback below the 2024 low at 139.58, exposing a retest of the 2023 low. Rallies should be well capped below 152.00.

USDJPY Chart
R2 150.92 - 1 August high - Strong
R1 149.00 - Figure - Medium
S1 146.81 - 25 July low - Medium
S2 145.85 - 24 July low - Strong
USDJPY: fundamental overview

Last Friday’s disappointing US jobs report triggered a dollar sell-off, shifting Federal Reserve policy expectations and weakening the USD against the yen, with USDJPY trading defensively this week. The Bank of Japan June meeting minutes reiterated plans for potential rate hikes if US tariff risks remain manageable, with a focus on predictable reductions in JGB purchases to maintain market stability; markets are more focused on the upcoming July meeting summary for fresh policy insights. The BOJ raised its inflation forecasts for 2025–2027, citing higher food prices, and slightly increased its 2025 growth forecast, though risks remain. Despite Governor Ueda’s dovish tone, analysts see hawkish signals in BOJ’s outlook, with 42% of economists predicting an October rate hike, driven partly by yen weakness, though political uncertainty and Japan’s fiscal challenges, including a potential extra budget to counter US tariffs, could complicate policy normalization.

 
AUDUSD: technical overview

There are signs of the potential formation of a longer-term base with the market trading down into a meaningful longer-term support zone. Only a monthly close below 0.5500 would give reason for rethink. A monthly close back above 0.7000 will take the big picture pressure off the downside and strengthen case for a bottom.

AUDUSD Chart
R2 0.6688 - 7 November 2024 high - Strong
R1 0.6625 - 24 July/2025 high - Medium
S1 0.6419 - 1 August low - Medium
S1 0.6373 - 23 June low - Strong
AUDUSD: fundamental overview

Last Friday, G10 currencies, particularly the Yen and Euro, rallied against the dollar due to softer-than-expected U.S. labor data, raising hopes for Federal Reserve rate cuts in September, though Trump’s tariff announcements tempered gains. Australian economic indicators showed strength, with July’s Melbourne Institute Inflation rising to 2.9% year-on-year, June retail sales surging 1.2% month-on-month, and building approvals jumping 11.9%, signaling robust consumer spending and a potential housing sector recovery despite high interest rates. While markets anticipate two RBA rate cuts this year, strong economic data may lead the RBA to pause, with analysts expecting a cautious stance at the upcoming August meeting, supported by upward revisions in July’s S&P Global Australia PMI data.

 
Suggested reading

The Fed Isn’t What John Cochrane Wants It to Be, Never Was, J. Tamny,  Forbes (August 3, 2025)

Regulatory Crypto Clarity Is Green Light for Wall Street, S. McBride, RiskHedge (August 1, 2025)


Any opinions, news, research, analyses, prices or other information ("information") contained on this Blog, constitutes marketing communication and it has not been prepared in accordance with legal requirements designed to promote the independence of investment research. Further, the information contained within this Blog does not contain (and should not be construed as containing) investment advice or an investment recommendation, or an offer of, or solicitation for, a transaction in any financial instrument. LMAX Group has not verified the accuracy or basis-in-fact of any claim or statement made by any third parties as comments for every Blog entry.

LMAX Group will not accept liability for any loss or damage, including without limitation to, any loss of profit, which may arise directly or indirectly from use of or reliance on such information. No representation or warranty is given as to the accuracy or completeness of the above information. While the produced information was obtained from sources deemed to be reliable, LMAX Group does not provide any guarantees about the reliability of such sources. Consequently any person acting on it does so entirely at his or her own risk. It is not a place to slander, use unacceptable language or to promote LMAX Group or any other FX and CFD provider and any such postings, excessive or unjust comments and attacks will not be allowed and will be removed from the site immediately.

Day Image
4th August 2025 | view in browser
Rate cut fever grips markets after weak US jobs

Global markets kick off the week on the back foot following a sharp repricing of U.S. rate expectations after Friday’s soft jobs data and ISM employment reading, which came in at its lowest since mid-2020.


Performance chart 30day v. USD (%)
Performance Chart
 
 
Technical & fundamental highlights
EURUSD: technical overview

The Euro has broken out from a multi-month consolidation off a critical longer-term low. This latest push through the 2023 high (1.1276) lends further support to the case for a meaningful bottom, setting the stage for a bullish structural shift and the next major upside extension targeting the 2021 high at 1.2350. Setbacks should be exceptionally well supported ahead of 1.1000.

EURUSD Chart
R2 1.1703 - 25 July low - Medium
R1 1.1600 - Figure - Medium
S1 1.1392 - 1 August low - Medium
S2 1.1210 - 29 May low - Strong
EURUSD: fundamental overview

Last week’s slightly higher German inflation and stable Euro area inflation aligned with ECB targets, suggesting the ECB may be nearing the end of its rate-cutting cycle. A weaker US jobs report last Friday triggered a sharp EURUSD rebound, as hopes for earlier Fed rate cuts grew, with some analysts predicting a potential 50bps cut in September if US labor markets weaken further. The euro outperformed most G10 currencies, boosted by unwinding short positions, while ECB official Christodoulos Patsalides highlighted the eurozone’s resilience despite global tensions and a US-EU trade deal, emphasizing data-dependent ECB policy. One institutional shop noted potential eurozone growth challenges from the trade deal’s 15% tariff but expect the euro to rise against a weakening dollar as global portfolios diversify. This week’s key Eurozone data includes the August Sentix Investor Confidence, June PPI, June Retail Sales, and the ECB Economic Bulletin, offering insights into monetary policy and economic projections.

 
USDJPY: technical overview

There are signs of a meaningful top in place after the market put in a multi-year high in 2024. At this point, the door is now open for a deeper setback below the 2024 low at 139.58, exposing a retest of the 2023 low. Rallies should be well capped below 152.00.

USDJPY Chart
R2 150.92 - 1 August high - Strong
R1 149.00 - Figure - Medium
S1 147.06 - 4 August low - Medium
S2 145.85 - 24 July low - Strong
USDJPY: fundamental overview

Last week, the USDJPY rose due to Japan’s political instability, a hawkish U.S. Federal Reserve, and the Bank of Japan’s unchanged 0.5% interest rate despite a higher 2.7% inflation forecast for 2025. A disappointing U.S. jobs report reversed this trend, triggering a dollar sell-off and erasing the week’s gains as traders exited long USDJPY positions. Looking ahead, markets will monitor Japan’s upcoming wage and household spending data, BOJ meeting minutes, and a 30-year JGB auction, alongside U.S. employment and inflation indicators, for signals on future rate changes. Political uncertainty in Japan and potential Fed policy shifts could further influence yen volatility, with USDJPY maintaining a bullish bias above 145.76-145.86, though a dovish Fed shift may weaken the dollar against G10 currencies.

 
AUDUSD: technical overview

There are signs of the potential formation of a longer-term base with the market trading down into a meaningful longer-term support zone. Only a monthly close below 0.5500 would give reason for rethink. A monthly close back above 0.7000 will take the big picture pressure off the downside and strengthen case for a bottom.

AUDUSD Chart
R2 0.6688 - 7 November 2024 high - Strong
R1 0.6625 - 24 July/2025 high - Medium
S1 0.6419 - 1 August low - Medium
S1 0.6373 - 23 June low - Strong
AUDUSD: fundamental overview

Last Friday, G10 currencies, particularly the Yen and Euro, rallied against the dollar due to weaker-than-expected U.S. labor data, boosting expectations for a Federal Reserve rate cut in September, though Trump’s tariff announcements tempered gains for antipodean currencies, which saw the smallest increase. In Australia, Q2 CPI data came in slightly below expectations, supporting a likely 25bps rate cut by the RBA in August, with inflation aligning with RBA projections and the unemployment rate at 4.3% still near full employment. Strong June retail sales (up 1.2% MoM) and building approvals (up 11.9% MoM) suggest resilient consumer spending and a potential housing sector recovery, but Bloomberg notes spending growth was driven by discounts and may not be sustainable, with markets anticipating at least two RBA rate cuts this year unless economic strength prompts a pause.

 
Suggested reading

The World’s 50 Most Valuable Private Companies, M. Lu,  Visual Capitalist (July 31, 2025)

Top 10 Jobs Least And Most Threatened By AI, N. Rothschild, Axios (July 31, 2025)


Any opinions, news, research, analyses, prices or other information ("information") contained on this Blog, constitutes marketing communication and it has not been prepared in accordance with legal requirements designed to promote the independence of investment research. Further, the information contained within this Blog does not contain (and should not be construed as containing) investment advice or an investment recommendation, or an offer of, or solicitation for, a transaction in any financial instrument. LMAX Group has not verified the accuracy or basis-in-fact of any claim or statement made by any third parties as comments for every Blog entry.

LMAX Group will not accept liability for any loss or damage, including without limitation to, any loss of profit, which may arise directly or indirectly from use of or reliance on such information. No representation or warranty is given as to the accuracy or completeness of the above information. While the produced information was obtained from sources deemed to be reliable, LMAX Group does not provide any guarantees about the reliability of such sources. Consequently any person acting on it does so entirely at his or her own risk. It is not a place to slander, use unacceptable language or to promote LMAX Group or any other FX and CFD provider and any such postings, excessive or unjust comments and attacks will not be allowed and will be removed from the site immediately.

Day Image
1st August 2025 | view in browser
Dollar rallies on strong US data

The US dollar strengthened, fueled by robust economic data and strong tech earnings from Meta and Microsoft, pushing recession fears to a new low and pressuring speculative short positions.


Performance chart 30day v. USD (%)
Performance Chart
 
 
Technical & fundamental highlights
EURUSD: technical overview

The Euro has broken out from a multi-month consolidation off a critical longer-term low. This latest push through the 2023 high (1.1276) lends further support to the case for a meaningful bottom, setting the stage for a bullish structural shift and the next major upside extension targeting the 2021 high at 1.2350. Setbacks should be exceptionally well supported ahead of 1.1000.

EURUSD Chart
R2 1.1600 - 29 July high - Medium
R1 1.1500 - Figure - Medium
S1 1.1313 - 30 May low - Medium
S2 1.1210 - 29 May low - Strong
EURUSD: fundamental overview

The Federal Reserve’s decision to maintain high interest rates at 4.5%, the highest among G10 central banks, reflects a cautious “wait and see” approach, potentially pressuring the EURUSD exchange rate in the near term. The euro area economy grew slightly by 0.1% in Q2, avoiding stagnation but showing weaknesses in Germany and Italy, partly due to uncertainties from new U.S. tariffs impacting trade. Despite these challenges, Pimco analysts predict the euro may strengthen against a weakening dollar as global portfolios diversify, with U.S. trade policies possibly reducing demand for U.S. assets. German inflation dipping below the ECB’s 2% target and a resilient labor market further support expectations of controlled inflation in the eurozone.

 
USDJPY: technical overview

There are signs of a meaningful top in place after the market put in a multi-year high in 2024. At this point, the door is now open for a deeper setback below the 2024 low at 139.58, exposing a retest of the 2023 low. Rallies should be well capped below 152.00.

USDJPY Chart
R2 151.21 - 28 March high - Strong
R1 150.00 - Psychological - Medium
S1 147.80 - 30 July low - Medium
S2 145.85 - 24 July low - Strong
USDJPY: fundamental overview

The Bank of Japan maintained its interest rate at 0.5% and raised its inflation forecasts for 2025–2027, citing higher food prices, while slightly increasing its 2025 growth projection. Governor Ueda downplayed the likelihood of an imminent rate hike, emphasizing uncertainties like U.S. tariffs and global trade, leading markets to reduce expectations for near-term policy tightening. The dovish stance, combined with wide rate differentials with the U.S. Federal Reserve, strengthened USDJPY, with potential for further yen weakness amid political challenges and limited expectations of intervention by Japan’s Ministry of Finance.

 
AUDUSD: technical overview

There are signs of the potential formation of a longer-term base with the market trading down into a meaningful longer-term support zone. Only a monthly close below 0.5500 would give reason for rethink. A monthly close back above 0.7000 will take the big picture pressure off the downside and strengthen case for a bottom.

AUDUSD Chart
R2 0.6688 - 7 November 2024 high - Strong
R1 0.6625 - 24 July/2025 high - Medium
S1 0.6400 - Figure - Medium
S1 0.6373 - 23 June low - Strong
AUDUSD: fundamental overview

Australia’s Q2 CPI rose slightly below expectations at 0.7% quarterly and 2.1% annually, supporting a likely 25bps rate cut by the RBA in August. The trimmed mean CPI of 2.7% aligned with RBA forecasts, indicating contained inflation. Despite a rise in unemployment to 4.3%, the RBA views it as near full employment. Strong retail sales (1.2% MoM) and building approvals (11.9% MoM) suggest robust consumer spending and a potential housing sector recovery, though sustained growth remains uncertain. Markets anticipate at least two rate cuts in 2025, but strong economic data could prompt the RBA to pause.

 
Suggested reading

What’s Your Real Risk Tolerance?, M. Hulbert,  MarketWatch (July 30, 2025)

Why Industrial Stocks Are Booming This Year, B. Albrecht, Morningstar (July 30, 2025)


Any opinions, news, research, analyses, prices or other information ("information") contained on this Blog, constitutes marketing communication and it has not been prepared in accordance with legal requirements designed to promote the independence of investment research. Further, the information contained within this Blog does not contain (and should not be construed as containing) investment advice or an investment recommendation, or an offer of, or solicitation for, a transaction in any financial instrument. LMAX Group has not verified the accuracy or basis-in-fact of any claim or statement made by any third parties as comments for every Blog entry.

LMAX Group will not accept liability for any loss or damage, including without limitation to, any loss of profit, which may arise directly or indirectly from use of or reliance on such information. No representation or warranty is given as to the accuracy or completeness of the above information. While the produced information was obtained from sources deemed to be reliable, LMAX Group does not provide any guarantees about the reliability of such sources. Consequently any person acting on it does so entirely at his or her own risk. It is not a place to slander, use unacceptable language or to promote LMAX Group or any other FX and CFD provider and any such postings, excessive or unjust comments and attacks will not be allowed and will be removed from the site immediately.

Day Image
31st July 2025 | view in browser
Dollar surges on strong data, hawkish Fed

The U.S. dollar strengthened for a fifth consecutive day on Wednesday, driven by robust U.S. GDP and employment data, which prompted investors to abandon bearish dollar positions.


Performance chart 30day v. USD (%)
Performance Chart
 
 
Technical & fundamental highlights
EURUSD: technical overview

The Euro has broken out from a multi-month consolidation off a critical longer-term low. This latest push through the 2023 high (1.1276) lends further support to the case for a meaningful bottom, setting the stage for a bullish structural shift and the next major upside extension targeting the 2021 high at 1.2350. Setbacks should be exceptionally well supported ahead of 1.1000.

EURUSD Chart
R2 1.1600 - 29 July high - Medium
R1 1.1500 - Figure - Medium
S1 1.1313 - 30 May low - Medium
S2 1.1210 - 29 May low - Strong
EURUSD: fundamental overview

After the FOMC meeting and strong US economic data, G10 currencies weakened against the dollar, with the euro stabilizing after a sharp sell-off pushed its RSI into oversold territory. The euro area economy grew by 0.1% in Q2, beating expectations but masking weaknesses in Germany and Italy, further pressured by new US-EU trade tariffs that could reduce GDP by 0.3-0.5%. Euro zone wage growth is projected to slow to 2.6% in Q1 2026, down from 3.1% in Q4 2025, raising concerns about undershooting the ECB’s 2% inflation target. Despite these challenges, the ECB remains cautious about further rate cuts, preferring to monitor economic developments before acting.

 
USDJPY: technical overview

There are signs of a meaningful top in place after the market put in a multi-year high in 2024. At this point, the door is now open for a deeper setback below the 2024 low at 139.58, exposing a retest of the 2023 low. Rallies should be well capped below 152.00.

USDJPY Chart
R2 150.00 - Psychological - Strong
R1 149.50 - 30 July high - Medium
S1 146.81 - 25 July low - Medium
S2 145.85 - 24 July low - Strong
USDJPY: fundamental overview

With the U.S. economy showing resilience and strengthening the dollar, attention turns to the upcoming Bank of Japan meeting, where rates are expected to remain steady while the BOJ may raise its inflation outlook. Despite recent data showing robust retail sales and industrial production, indicating economic momentum, the BOJ’s cautious “risk management approach” could signal no immediate rate hikes, potentially weakening the yen if markets perceive a dovish stance. Suntory Holdings CEO Takeshi Ninami urges the BOJ to raise rates to counter yen weakness and inflation pressures impacting daily life in Japan.

 
AUDUSD: technical overview

There are signs of the potential formation of a longer-term base with the market trading down into a meaningful longer-term support zone. Only a monthly close below 0.5500 would give reason for rethink. A monthly close back above 0.7000 will take the big picture pressure off the downside and strengthen case for a bottom.

AUDUSD Chart
R2 0.6688 - 7 November 2024 high - Strong
R1 0.6625 - 24 July/2025 high - Medium
S1 0.6426 - 30 July low - Medium
S1 0.6373 - 23 June low - Strong
AUDUSD: fundamental overview

Chinese trade negotiator Li Chenggang announced an extension of the US-China trade truce in Stockholm, though US Treasury Secretary Bessent noted that final approval from Trump is pending due to unresolved technical details. No major agreements were confirmed, but both sides appear committed to avoiding escalation, keeping future trade deal possibilities open. Meanwhile, China’s massive Yarlung Zangbo dam project could boost demand for heavy equipment and commodities like steel and cement, potentially benefiting Australia’s economy due to its iron ore exports. Australia’s Q2 CPI data came in below expectations at 0.7% QoQ and 2.1% YoY, supporting expectations for a 25bps rate cut by the RBA in August, with economists noting that inflation is under control and monetary policy may ease further.

 
Suggested reading

What Is Driving Inflation?, B. Ritholz,  The Big Picture (July 29, 2025)

Busting Three Myths, R. Detrick, Carson (July 29, 2025)


Any opinions, news, research, analyses, prices or other information ("information") contained on this Blog, constitutes marketing communication and it has not been prepared in accordance with legal requirements designed to promote the independence of investment research. Further, the information contained within this Blog does not contain (and should not be construed as containing) investment advice or an investment recommendation, or an offer of, or solicitation for, a transaction in any financial instrument. LMAX Group has not verified the accuracy or basis-in-fact of any claim or statement made by any third parties as comments for every Blog entry.

LMAX Group will not accept liability for any loss or damage, including without limitation to, any loss of profit, which may arise directly or indirectly from use of or reliance on such information. No representation or warranty is given as to the accuracy or completeness of the above information. While the produced information was obtained from sources deemed to be reliable, LMAX Group does not provide any guarantees about the reliability of such sources. Consequently any person acting on it does so entirely at his or her own risk. It is not a place to slander, use unacceptable language or to promote LMAX Group or any other FX and CFD provider and any such postings, excessive or unjust comments and attacks will not be allowed and will be removed from the site immediately.

Day Image
30th July 2025 | view in browser
Dollar dominates as global trade tilts

The Dollar Index has surged to its highest level since early June, driven by favorable trade developments that have prompted investors to unwind bearish bets.


Performance chart 30day v. USD (%)
Performance Chart
 
 
Technical & fundamental highlights
EURUSD: technical overview

The Euro has broken out from a multi-month consolidation off a critical longer-term low. This latest push through the 2023 high (1.1276) lends further support to the case for a meaningful bottom, setting the stage for a bullish structural shift and the next major upside extension targeting the 2021 high at 1.2350. Setbacks should be exceptionally well supported ahead of 1.1000.

EURUSD Chart
R2 1.1789 - 24 July high - Medium
R1 1.1700 - Figure - Medium
S1 1.1519 - 29 July low - Medium
S2 1.1446 - 19 June low - Strong
EURUSD: fundamental overview

Euro area inflation expectations dipped slightly to 2.6% for one year, while three-year expectations held steady at 2.4%, according to the ECB. ECB officials, including Gabriel Makhlouf and President Christine Lagarde, see no rush to cut interest rates, citing stable inflation and steady growth, though a new 15% US tariff on EU goods could slow economic progress despite reducing trade uncertainty. The euro weakened sharply after a perceived lopsided US-EU trade deal, sparking criticism of European Commission President Ursula von der Leyen and fueling market concerns that the non-binding agreement might unravel, with formal negotiations potentially taking years. European leaders and markets are now grappling with the deal’s implications, but some see it as a chance to push for economic reforms and diversify trade partnerships, while markets may soon focus on the EU avoiding a worse outcome and the possibility of prolonged ECB rate pauses.

 
USDJPY: technical overview

There are signs of a meaningful top in place after the market put in a multi-year high in 2024. At this point, the door is now open for a deeper setback below the 2024 low at 139.58, exposing a retest of the 2023 low. Rallies should be well capped below 152.00.

USDJPY Chart
R2 150.00 - Psychological - Strong
R1 149.19 - 16 July high - Medium
S1 146.81 - 25 July low - Medium
S2 145.85 - 24 July low - Strong
USDJPY: fundamental overview

Political turmoil in Japan is intensifying as a backlash against a US-Japan trade deal, criticized for threatening sovereignty, fuels speculation that Prime Minister Ishiba may be forced to resign. The deal, involving a disputed $550 billion Japanese investment in the US with unclear profit-sharing terms, has sparked confusion and market concerns, potentially weakening the yen further. As the Bank of Japan adopts a cautious “risk management” approach amid political and economic uncertainties, markets expect steady policy, which could pressure the yen if perceived as dovish. Upcoming June retail sales, industrial production, and housing data, particularly strong retail figures from firms like UNIQLO, may influence yen trading ahead of the BOJ meeting, while business leaders urge rate hikes to counter yen weakness and rising inflation.

 
AUDUSD: technical overview

There are signs of the potential formation of a longer-term base with the market trading down into a meaningful longer-term support zone. Only a monthly close below 0.5500 would give reason for rethink. A monthly close back above 0.7000 will take the big picture pressure off the downside and strengthen case for a bottom.

AUDUSD Chart
R2 0.6688 - 7 November 2024 high - Strong
R1 0.6625 - 24 July/2025 high - Medium
S1 0.6454 - 17 July low - Medium
S1 0.6373 - 23 June low - Strong
AUDUSD: fundamental overview

Markets are focused on US-China trade talks in Stockholm, with a potential extension of the August 12 truce deadline possibly boosting antipodean currencies like the Australian dollar. Australia’s Q2 CPI, due today, is expected to show inflation easing to 2.2% year-on-year, nearing the Reserve Bank of Australia’s 2%-3% target, potentially paving the way for a rate cut at the RBA’s August 11-12 meeting. However, RBA Governor Bullock’s recent comments on a resilient labor market and gradual inflation decline have tempered expectations for aggressive rate cuts, with markets now less certain of an August cut and scaling back hopes for consecutive cuts without stronger evidence of economic slowdown.

 
Suggested reading

Can new technologies supercharge solar power?, R. Millard,  Financial Times (July 29, 2025)

As Ether Outperforms Bitcoin, What’s Going on With Crypto?, C. Reilly, RiskHedge (July 28, 2025)


Any opinions, news, research, analyses, prices or other information ("information") contained on this Blog, constitutes marketing communication and it has not been prepared in accordance with legal requirements designed to promote the independence of investment research. Further, the information contained within this Blog does not contain (and should not be construed as containing) investment advice or an investment recommendation, or an offer of, or solicitation for, a transaction in any financial instrument. LMAX Group has not verified the accuracy or basis-in-fact of any claim or statement made by any third parties as comments for every Blog entry.

LMAX Group will not accept liability for any loss or damage, including without limitation to, any loss of profit, which may arise directly or indirectly from use of or reliance on such information. No representation or warranty is given as to the accuracy or completeness of the above information. While the produced information was obtained from sources deemed to be reliable, LMAX Group does not provide any guarantees about the reliability of such sources. Consequently any person acting on it does so entirely at his or her own risk. It is not a place to slander, use unacceptable language or to promote LMAX Group or any other FX and CFD provider and any such postings, excessive or unjust comments and attacks will not be allowed and will be removed from the site immediately.

Day Image
29th July 2025 | view in browser
US-EU trade deal shakes markets, Dollar surges

Financial markets have kicked off the week contending with what has been a significant US-EU trade deal. This deal has been behind a third consecutive day of US dollar strength against major currencies, particularly the Euro.


Performance chart 30day v. USD (%)
Performance Chart
 
 
Technical & fundamental highlights
EURUSD: technical overview

The Euro has broken out from a multi-month consolidation off a critical longer-term low. This latest push through the 2023 high (1.1276) lends further support to the case for a meaningful bottom, setting the stage for a bullish structural shift and the next major upside extension targeting the 2021 high at 1.2350. Setbacks should be exceptionally well supported ahead of 1.1000.

EURUSD Chart
R2 1.1789 - 24 July high - Medium
R1 1.1700 - Figure - Medium
S1 1.1557 - 17 July low - Medium
S2 1.1446 - 19 June low - Strong
EURUSD: fundamental overview

EU officials, initially aiming for a tariff-free trade deal with the US, settled for a 15% tariff rate, higher than the anticipated 10%, and made additional concessions. Lacking critical exports like rare earths, the EU, which mainly exports luxury goods, faced a weaker bargaining position, potentially pushing Europe to hasten economic reforms and diversify trade partners. The 15% tariff is unlikely to significantly disrupt EU growth or inflation, with the ECB maintaining its 2% deposit rate and viewing any inflation dip as temporary. While the euro weakened due to the lopsided deal, markets may soon focus on the EU avoiding a worse outcome, with expectations of divergent US and EU monetary policies influencing currency trends in the near term.

 
USDJPY: technical overview

There are signs of a meaningful top in place after the market put in a multi-year high in 2024. At this point, the door is now open for a deeper setback below the 2024 low at 139.58, exposing a retest of the 2023 low. Rallies should be well capped below 152.00.

USDJPY Chart
R2 150.00 - Psychological - Strong
R1 149.19 - 16 July high - Medium
S1 146.81 - 25 July low - Medium
S2 145.85 - 24 July low - Strong
USDJPY: fundamental overview

Despite the US-Japan trade deal, Prime Minister Ishiba’s position remains shaky due to the LDP minority status in both houses, with growing internal pressure for his resignation. If Ishiba steps down, Shinjiro Koizumi and Sanae Takaichi are leading contenders for LDP leadership; Koizumi supports the Bank of Japan’s independence, while Takaichi favors monetary easing and could resist BOJ rate hikes. The BOJ is expected to hold rates steady at its upcoming meeting, with markets focused on its inflation outlook and hints of future rate hikes, though a new “risk management approach” may justify caution despite strong inflation trends. June retail sales, industrial production, and housing data, particularly retail sales showing consumer strength, will influence yen trading before the BOJ meeting.

 
AUDUSD: technical overview

There are signs of the potential formation of a longer-term base with the market trading down into a meaningful longer-term support zone. Only a monthly close below 0.5500 would give reason for rethink. A monthly close back above 0.7000 will take the big picture pressure off the downside and strengthen case for a bottom.

AUDUSD Chart
R2 0.6688 - 7 November 2024 high - Strong
R1 0.6625 - 24 July/2025 high - Medium
S1 0.6454 - 17 July low - Medium
S1 0.6373 - 23 June low - Strong
AUDUSD: fundamental overview

The market is focused on the upcoming FOMC meeting, where the Federal Reserve is expected to maintain a cautious, data-driven stance, boosting the U.S. dollar against other G10 currencies. Australian super funds, managing a A$4.1 trillion asset base, are reassessing U.S. investments and increasing AUD hedging to mitigate potential declines in the AUDUSD exchange rate. Australia’s Q2 CPI, due July 30, is projected to show inflation easing to 2.2% YoY, potentially prompting an RBA rate cut in August, though Governor Bullock’s recent hawkish remarks suggest a slower approach to rate cuts, supported by a stable labor market and slightly lower-than-expected core inflation. While markets still anticipate an August cut, expectations for aggressive, consecutive cuts have waned, with two cuts projected by year-end, likely in August and November.

 
Suggested reading

Bernanke & Yellen’s Inflation Mystification Ails Fed, J. Tamny,  Forbes (July 27, 2025)

Quantitative Ranking of Federal Reserve Chairs, J. Divine, US News & World Report (July 24, 2025)


Any opinions, news, research, analyses, prices or other information ("information") contained on this Blog, constitutes marketing communication and it has not been prepared in accordance with legal requirements designed to promote the independence of investment research. Further, the information contained within this Blog does not contain (and should not be construed as containing) investment advice or an investment recommendation, or an offer of, or solicitation for, a transaction in any financial instrument. LMAX Group has not verified the accuracy or basis-in-fact of any claim or statement made by any third parties as comments for every Blog entry.

LMAX Group will not accept liability for any loss or damage, including without limitation to, any loss of profit, which may arise directly or indirectly from use of or reliance on such information. No representation or warranty is given as to the accuracy or completeness of the above information. While the produced information was obtained from sources deemed to be reliable, LMAX Group does not provide any guarantees about the reliability of such sources. Consequently any person acting on it does so entirely at his or her own risk. It is not a place to slander, use unacceptable language or to promote LMAX Group or any other FX and CFD provider and any such postings, excessive or unjust comments and attacks will not be allowed and will be removed from the site immediately.

Day Image
28th July 2025 | view in browser
Global markets brace for trade and political shifts

The US and EU agreed on a 15% tariff deal for most EU exports, though disagreements persist over whether pharmaceuticals are included, while Japan clarified that its $550 billion investment deal with the US depends on contributions, signaling ongoing trade negotiations and potential tensions under the Trump administration.


Performance chart 30day v. USD (%)
Performance Chart
 
 
Technical & fundamental highlights
EURUSD: technical overview

The Euro has broken out from a multi-month consolidation off a critical longer-term low. This latest push through the 2023 high (1.1276) lends further support to the case for a meaningful bottom, setting the stage for a bullish structural shift and the next major upside extension targeting the 2021 high at 1.2350. Setbacks should be exceptionally well supported ahead of 1.1000.

EURUSD Chart
R2 1.1830 - 1 July/2025 high - Strong
R1 1.1789 - 24 July high - Medium
S1 1.1557 - 17 July low - Medium
S2 1.1446 - 19 June low - Strong
EURUSD: fundamental overview

The US and EU reached a 15% tariff deal on most EU exports, though disputes remain over whether pharmaceuticals are included, with steel and aluminum facing quotas. The EU offered concessions like buying $750 billion in US energy and investing $600 billion in the US, but European industry groups criticized the deal as unbalanced. The Euro saw a muted response but could strengthen as the ECB’s 2% deposit rate pause may hold, supported by stable inflation forecasts (2.0% for 2025) and positive Eurozone data, including a strong Q1 2025 GDP growth of 0.6% and a rising Composite PMI of 51.0. With expectations of US rate cuts growing, diverging central bank policies may bolster the Euro.

 
USDJPY: technical overview

There are signs of a meaningful top in place after the market put in a multi-year high in 2024. At this point, the door is now open for a deeper setback below the 2024 low at 139.58, exposing a retest of the 2023 low. Rallies should be well capped below 152.00.

USDJPY Chart
R2 150.00 - Psychological - Strong
R1 149.19 - 16 July high - Medium
S1 146.11 - 23 July low - Medium
S2 145.85 - 24 July low - Strong
USDJPY: fundamental overview

Despite the US-Japan trade deal reducing economic uncertainty, it offers little political protection for Japanese Prime Minister Ishiba, whose leadership faces scrutiny at an informal LDP meeting today that could lead to a leadership contest, with Shinjiro Koizumi and Sanae Takaichi as potential successors. Koizumi supports BOJ independence, while Takaichi’s preference for monetary easing and a weaker Yen could hinder rate hikes if she becomes PM. The BOJ is likely to hold rates steady at its Thursday meeting, with markets awaiting its inflation outlook and hints of future rate hikes, supported by strong economic data like June retail sales, which early reports suggest may show robust consumer spending.

 
AUDUSD: technical overview

There are signs of the potential formation of a longer-term base with the market trading down into a meaningful longer-term support zone. Only a monthly close below 0.5500 would give reason for rethink. A monthly close back above 0.7000 will take the big picture pressure off the downside and strengthen case for a bottom.

AUDUSD Chart
R2 0.6688 - 7 November 2024 high - Strong
R1 0.6625 - 24 July/2025 high - Medium
S1 0.6454 - 17 July low - Medium
S1 0.6373 - 23 June low - Strong
AUDUSD: fundamental overview

The Australian Dollar is gaining strength due to positive market sentiment following US-Japan and US-EU trade deals, with expectations of a US-China tariff truce extension further boosting optimism. Australian super funds, managing A$4.1 trillion in assets, are likely increasing AUD hedging, supporting the currency’s rise to yearly highs. While the upcoming 2Q CPI report, expected to show inflation easing to 2.2% and core at 2.7%, may prompt an RBA rate cut in August, Governor Bullock’s recent comments downplaying aggressive cuts and highlighting a stable labor market despite a 4.3% unemployment rate have reduced expectations for multiple rate cuts, with markets now awaiting clearer signs of slowing inflation or weaker economic data.

 
Suggested reading

Parsing What the GENIUS Act Means for Markets, Fisher Investments (July 24, 2025)

The Best Time to Invest, B. Carlson, A Wealth of Common Sense (July 24, 2025)


Any opinions, news, research, analyses, prices or other information ("information") contained on this Blog, constitutes marketing communication and it has not been prepared in accordance with legal requirements designed to promote the independence of investment research. Further, the information contained within this Blog does not contain (and should not be construed as containing) investment advice or an investment recommendation, or an offer of, or solicitation for, a transaction in any financial instrument. LMAX Group has not verified the accuracy or basis-in-fact of any claim or statement made by any third parties as comments for every Blog entry.

LMAX Group will not accept liability for any loss or damage, including without limitation to, any loss of profit, which may arise directly or indirectly from use of or reliance on such information. No representation or warranty is given as to the accuracy or completeness of the above information. While the produced information was obtained from sources deemed to be reliable, LMAX Group does not provide any guarantees about the reliability of such sources. Consequently any person acting on it does so entirely at his or her own risk. It is not a place to slander, use unacceptable language or to promote LMAX Group or any other FX and CFD provider and any such postings, excessive or unjust comments and attacks will not be allowed and will be removed from the site immediately.

Day Image
25th July 2025 | view in browser
Dollar firms as Fed drama simmers

Markets remain on edge amid growing speculation that a political risk event could unfold, tied to President Trump escalating his campaign to remove Fed Chair Powell. The absence of the usual Fed criticism from both Trump and Treasury Secretary Bessent today may have supported a modest bounce in the dollar and weighed on Treasuries.


Performance chart 30day v. USD (%)
Performance Chart
 
 
Technical & fundamental highlights
EURUSD: technical overview

The Euro has broken out from a multi-month consolidation off a critical longer-term low. This latest push through the 2023 high (1.1276) lends further support to the case for a meaningful bottom, setting the stage for a bullish structural shift and the next major upside extension targeting the 2021 high at 1.2350. Setbacks should be exceptionally well supported ahead of 1.1000.

EURUSD Chart
R2 1.1830 - 1 July/2025 high - Strong
R1 1.1789 - 24 July high - Medium
S1 1.1557 - 17 July low - Medium
S2 1.1446 - 19 June low - Strong
EURUSD: fundamental overview

The European Central Bank kept its deposit rate at 2% as expected, awaiting clarity on US-Euro trade talks and offering no hints on future rate moves due to uncertain tariff outcomes. Eurozone economic data shows growing momentum, with the Composite PMI rising to 51.0 in July, driven by stronger manufacturing and services sectors, alongside robust Q1 2025 GDP growth of 0.6%. Analysts suggest the ECB may pause rate cuts longer than anticipated, with some predicting a shift toward rate hikes if inflation rises and trade uncertainties ease. A potential 15% US-EU tariff deal could strengthen the euro by reducing economic risks, potentially pushing the Euro toward 1.1900–1.2000, especially if US rate cut expectations grow.

 
USDJPY: technical overview

There are signs of a meaningful top in place after the market put in a multi-year high in 2024. At this point, the door is now open for a deeper setback below the 2024 low at 139.58, exposing a retest of the 2023 low. Rallies should be well capped below 152.00.

USDJPY Chart
R2 150.00 - Psychological - Strong
R1 149.19 - 16 July high - Medium
S1 146.11 - 23 July low - Medium
S2 145.85 - 24 July low - Strong
USDJPY: fundamental overview

The Bank of Japan’s Deputy Governor Shinichi Uchida noted that a US trade deal has reduced economic uncertainty, boosting market optimism for potential rate hikes, though USDJPY weakened. Persistent inflation, with Tokyo’s July CPI at 2.9% and core measures steady at 3.1%, supports the BOJ’s policy normalization, but political uncertainty following the LDP’s electoral setback and potential leadership change could impact monetary policy. A possible shift to Sanae Takaichi as PM, who favors monetary easing and a weaker yen, might pressure the BOJ to delay rate hikes, while proposed consumption tax cuts could raise bond yields and further weaken the yen.

 
AUDUSD: technical overview

There are signs of the potential formation of a longer-term base with the market trading down into a meaningful longer-term support zone. Only a monthly close below 0.5500 would give reason for rethink. A monthly close back above 0.7000 will take the big picture pressure off the downside and strengthen case for a bottom.

AUDUSD Chart
R2 0.6688 - 7 November 2024 high - Strong
R1 0.6625 - 24 July/2025 high - Medium
S1 0.6454 - 17 July low - Medium
S1 0.6373 - 23 June low - Strong
AUDUSD: fundamental overview

The Australian Dollar gained strength due to improved market optimism following a US-Japan trade deal, raising hopes for similar agreements with Europe and China. RBA Governor Michele Bullock’s recent comments reduced expectations for aggressive rate cuts, emphasizing a resilient labor market despite a rise in unemployment to 4.3% in June, which aligns with RBA forecasts. She highlighted that inflation is gradually approaching the 2.5% target, though the upcoming Q1 core inflation may be slightly below the expected 2.6%, and cautioned against overreacting to single data points. Bullock’s hawkish stance, noting the RBA’s restrained rate hikes in 2022-2023, led to higher Australian bond yields and a stronger AUD, with markets now less certain about an August rate cut and scaling back expectations for consecutive cuts without clearer signs of economic slowdown.

 
Suggested reading

Germany’s spending gamble, D. Garahan, Financial Times (July 24, 2025)

Active Investing Is A Loser’s Game, L. Swedroe, Morningstar (July 23, 2025)


Any opinions, news, research, analyses, prices or other information ("information") contained on this Blog, constitutes marketing communication and it has not been prepared in accordance with legal requirements designed to promote the independence of investment research. Further, the information contained within this Blog does not contain (and should not be construed as containing) investment advice or an investment recommendation, or an offer of, or solicitation for, a transaction in any financial instrument. LMAX Group has not verified the accuracy or basis-in-fact of any claim or statement made by any third parties as comments for every Blog entry.

LMAX Group will not accept liability for any loss or damage, including without limitation to, any loss of profit, which may arise directly or indirectly from use of or reliance on such information. No representation or warranty is given as to the accuracy or completeness of the above information. While the produced information was obtained from sources deemed to be reliable, LMAX Group does not provide any guarantees about the reliability of such sources. Consequently any person acting on it does so entirely at his or her own risk. It is not a place to slander, use unacceptable language or to promote LMAX Group or any other FX and CFD provider and any such postings, excessive or unjust comments and attacks will not be allowed and will be removed from the site immediately.