Day Image
25th July 2025 | view in browser
Dollar firms as Fed drama simmers

Markets remain on edge amid growing speculation that a political risk event could unfold, tied to President Trump escalating his campaign to remove Fed Chair Powell. The absence of the usual Fed criticism from both Trump and Treasury Secretary Bessent today may have supported a modest bounce in the dollar and weighed on Treasuries.


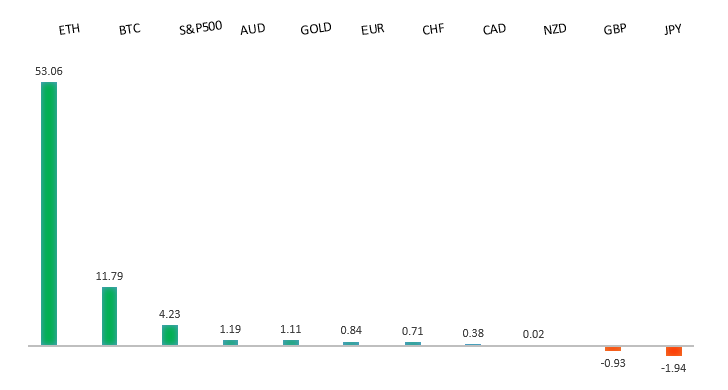
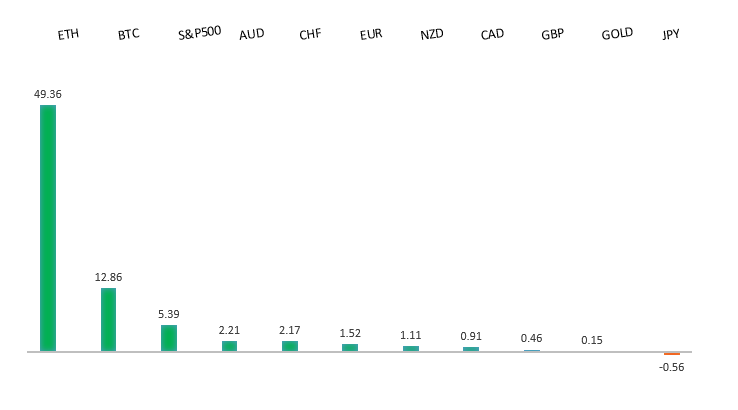
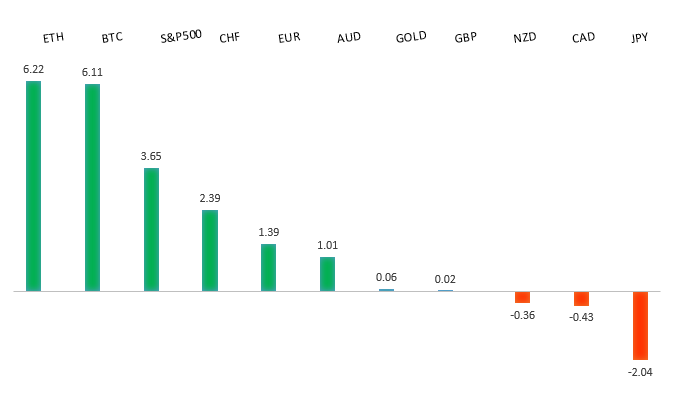
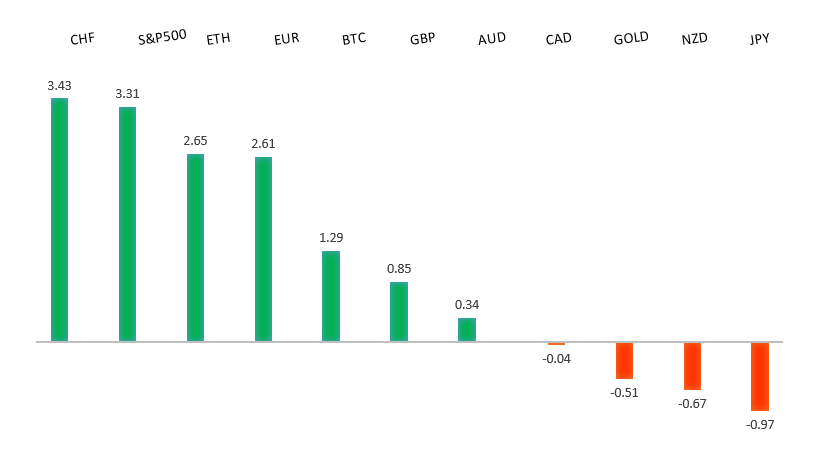
Performance chart 30day v. USD (%)
Performance Chart
 
 
Technical & fundamental highlights
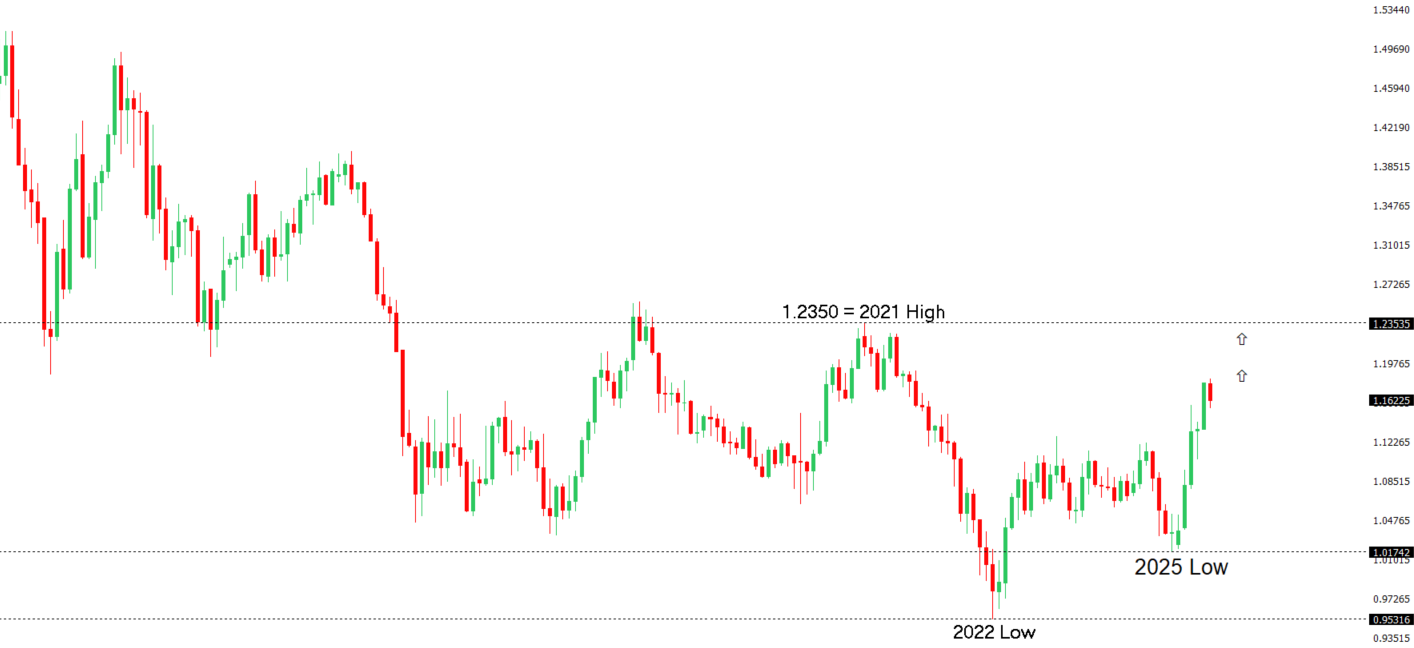
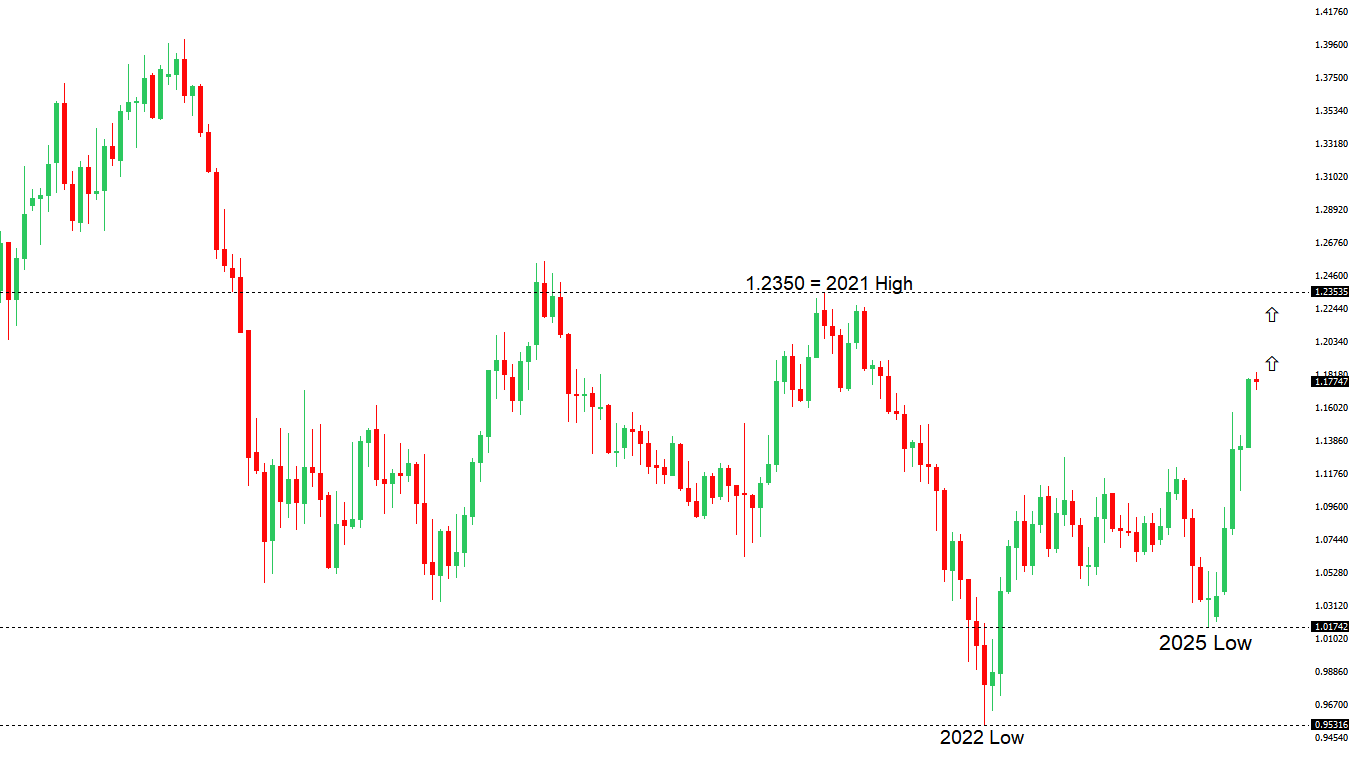
EURUSD: technical overview

The Euro has broken out from a multi-month consolidation off a critical longer-term low. This latest push through the 2023 high (1.1276) lends further support to the case for a meaningful bottom, setting the stage for a bullish structural shift and the next major upside extension targeting the 2021 high at 1.2350. Setbacks should be exceptionally well supported ahead of 1.1000.

EURUSD Chart
R2 1.1830 - 1 July/2025 high - Strong
R1 1.1789 - 24 July high - Medium
S1 1.1557 - 17 July low - Medium
S2 1.1446 - 19 June low - Strong
EURUSD: fundamental overview

The European Central Bank kept its deposit rate at 2% as expected, awaiting clarity on US-Euro trade talks and offering no hints on future rate moves due to uncertain tariff outcomes. Eurozone economic data shows growing momentum, with the Composite PMI rising to 51.0 in July, driven by stronger manufacturing and services sectors, alongside robust Q1 2025 GDP growth of 0.6%. Analysts suggest the ECB may pause rate cuts longer than anticipated, with some predicting a shift toward rate hikes if inflation rises and trade uncertainties ease. A potential 15% US-EU tariff deal could strengthen the euro by reducing economic risks, potentially pushing the Euro toward 1.1900–1.2000, especially if US rate cut expectations grow.

 
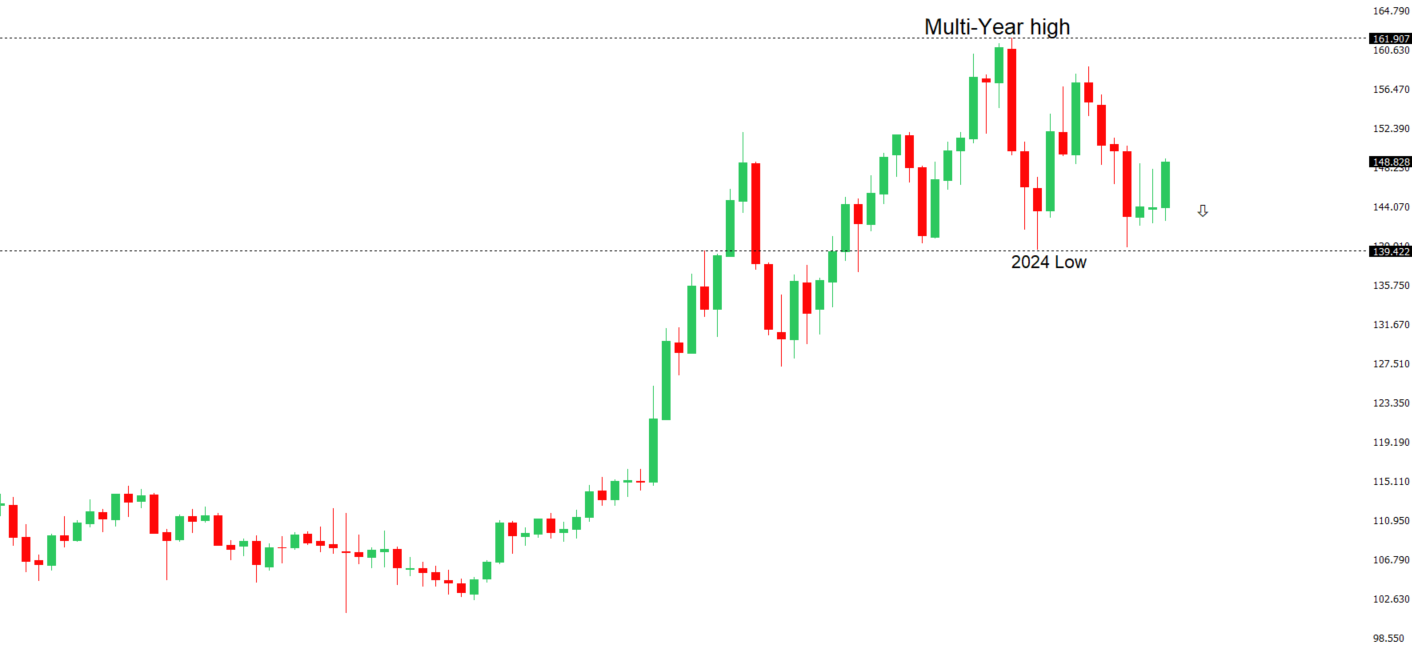
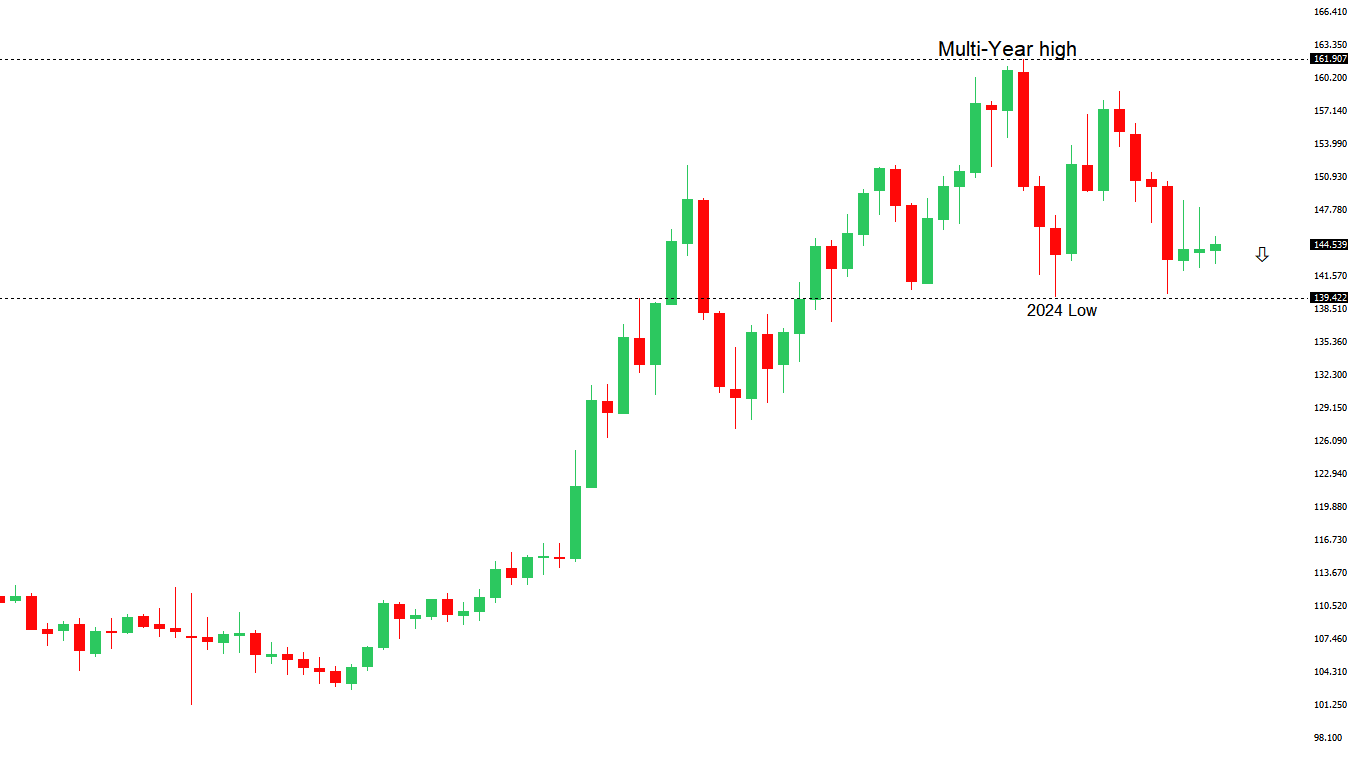
USDJPY: technical overview

There are signs of a meaningful top in place after the market put in a multi-year high in 2024. At this point, the door is now open for a deeper setback below the 2024 low at 139.58, exposing a retest of the 2023 low. Rallies should be well capped below 152.00.

USDJPY Chart
R2 150.00 - Psychological - Strong
R1 149.19 - 16 July high - Medium
S1 146.11 - 23 July low - Medium
S2 145.85 - 24 July low - Strong
USDJPY: fundamental overview

The Bank of Japan’s Deputy Governor Shinichi Uchida noted that a US trade deal has reduced economic uncertainty, boosting market optimism for potential rate hikes, though USDJPY weakened. Persistent inflation, with Tokyo’s July CPI at 2.9% and core measures steady at 3.1%, supports the BOJ’s policy normalization, but political uncertainty following the LDP’s electoral setback and potential leadership change could impact monetary policy. A possible shift to Sanae Takaichi as PM, who favors monetary easing and a weaker yen, might pressure the BOJ to delay rate hikes, while proposed consumption tax cuts could raise bond yields and further weaken the yen.

 
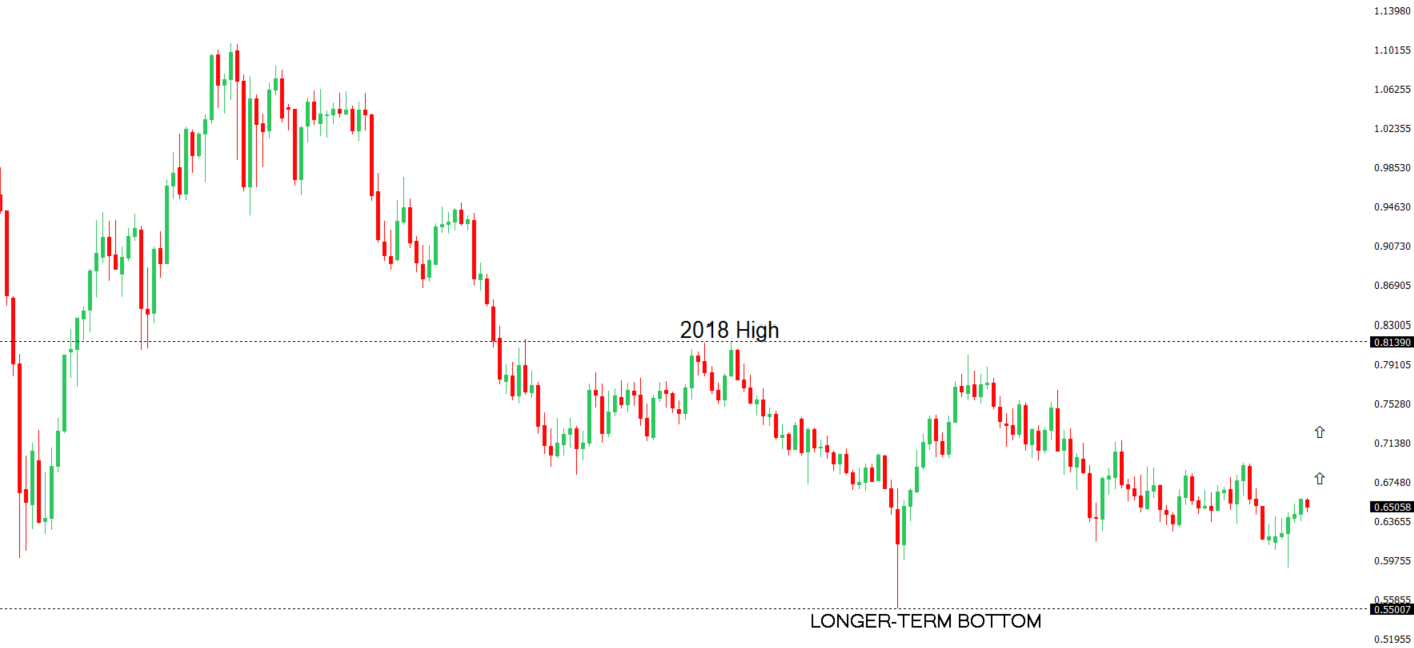
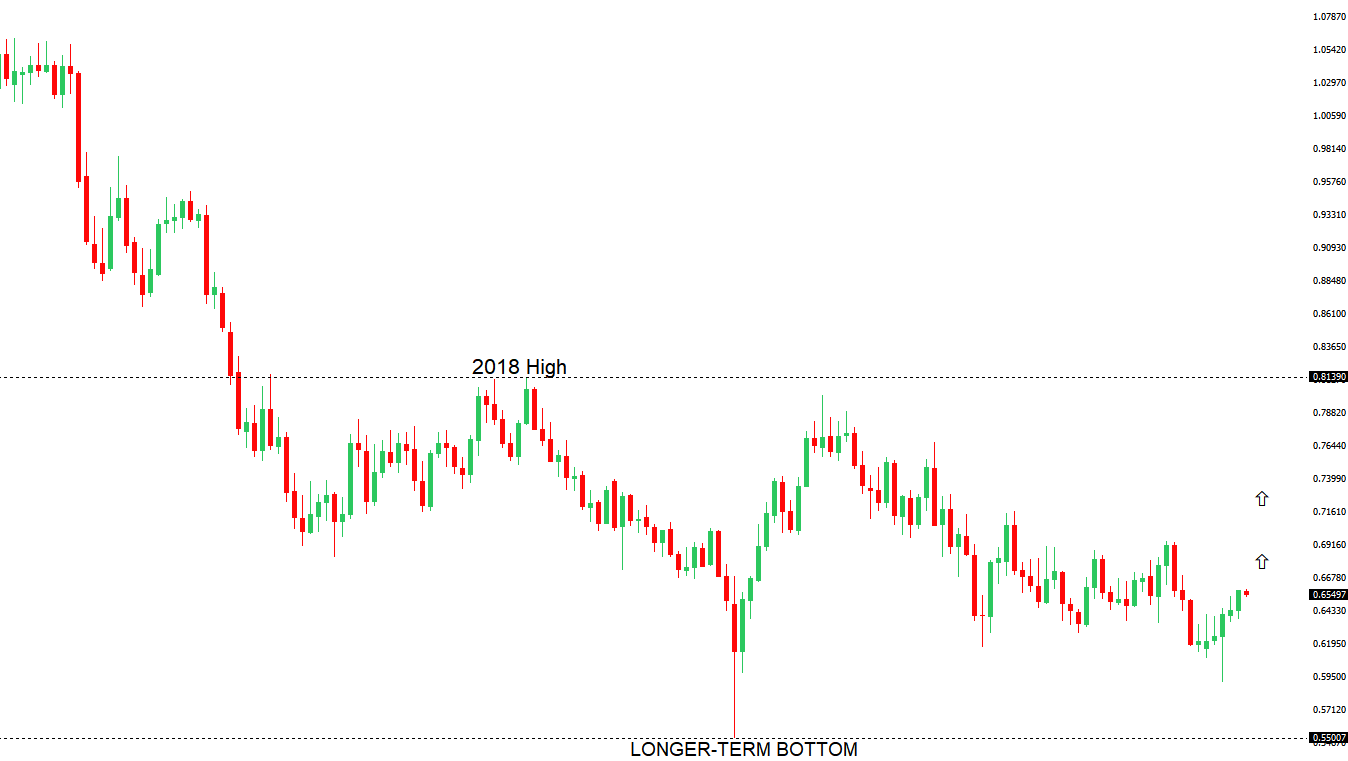
AUDUSD: technical overview

There are signs of the potential formation of a longer-term base with the market trading down into a meaningful longer-term support zone. Only a monthly close below 0.5500 would give reason for rethink. A monthly close back above 0.7000 will take the big picture pressure off the downside and strengthen case for a bottom.

AUDUSD Chart
R2 0.6688 - 7 November 2024 high - Strong
R1 0.6625 - 24 July/2025 high - Medium
S1 0.6454 - 17 July low - Medium
S1 0.6373 - 23 June low - Strong
AUDUSD: fundamental overview

The Australian Dollar gained strength due to improved market optimism following a US-Japan trade deal, raising hopes for similar agreements with Europe and China. RBA Governor Michele Bullock’s recent comments reduced expectations for aggressive rate cuts, emphasizing a resilient labor market despite a rise in unemployment to 4.3% in June, which aligns with RBA forecasts. She highlighted that inflation is gradually approaching the 2.5% target, though the upcoming Q1 core inflation may be slightly below the expected 2.6%, and cautioned against overreacting to single data points. Bullock’s hawkish stance, noting the RBA’s restrained rate hikes in 2022-2023, led to higher Australian bond yields and a stronger AUD, with markets now less certain about an August rate cut and scaling back expectations for consecutive cuts without clearer signs of economic slowdown.

 
Suggested reading

Germany’s spending gamble, D. Garahan, Financial Times (July 24, 2025)

Active Investing Is A Loser’s Game, L. Swedroe, Morningstar (July 23, 2025)


Any opinions, news, research, analyses, prices or other information ("information") contained on this Blog, constitutes marketing communication and it has not been prepared in accordance with legal requirements designed to promote the independence of investment research. Further, the information contained within this Blog does not contain (and should not be construed as containing) investment advice or an investment recommendation, or an offer of, or solicitation for, a transaction in any financial instrument. LMAX Group has not verified the accuracy or basis-in-fact of any claim or statement made by any third parties as comments for every Blog entry.

LMAX Group will not accept liability for any loss or damage, including without limitation to, any loss of profit, which may arise directly or indirectly from use of or reliance on such information. No representation or warranty is given as to the accuracy or completeness of the above information. While the produced information was obtained from sources deemed to be reliable, LMAX Group does not provide any guarantees about the reliability of such sources. Consequently any person acting on it does so entirely at his or her own risk. It is not a place to slander, use unacceptable language or to promote LMAX Group or any other FX and CFD provider and any such postings, excessive or unjust comments and attacks will not be allowed and will be removed from the site immediately.

Day Image
24th July 2025 | view in browser
Dollar dives as Fed pressure and trade noise build

The dollar fell for a fourth day as political pressure on the Fed and trade uncertainty weighed on sentiment. The euro gained on U.S.-EU tariff deal hopes, while housing data and Fed independence concerns added to market caution.


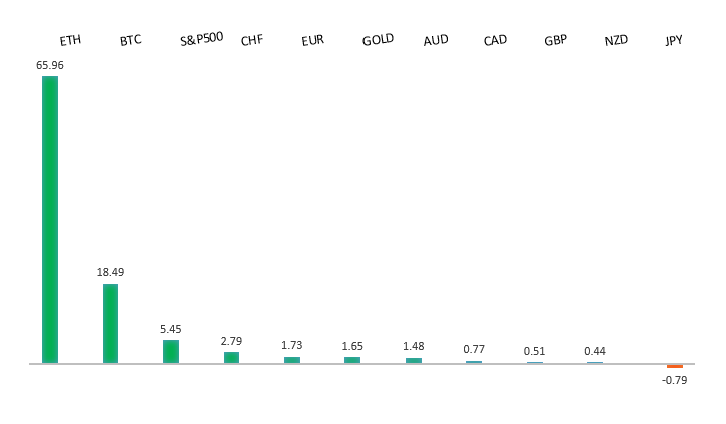
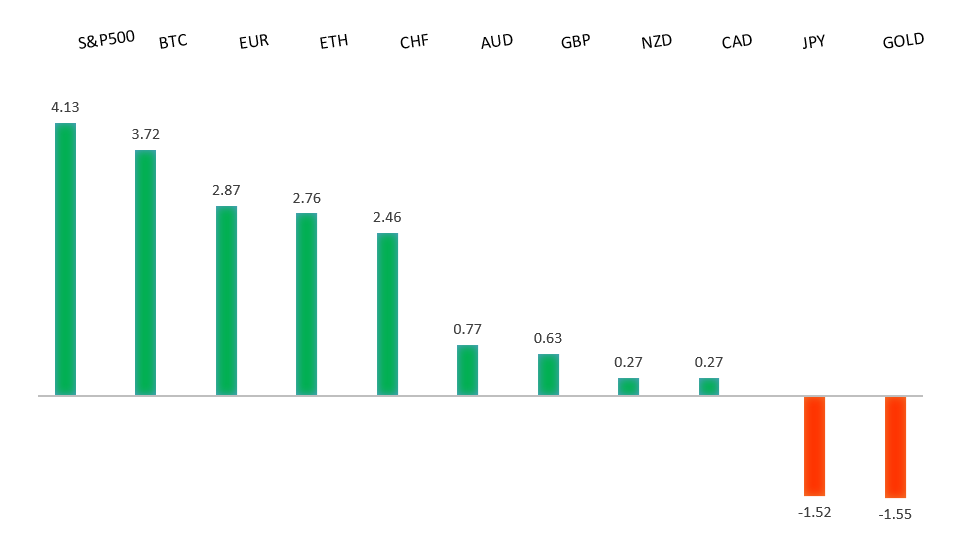
Performance chart 30day v. USD (%)
Performance Chart
 
 
Technical & fundamental highlights
EURUSD: technical overview

The Euro has broken out from a multi-month consolidation off a critical longer-term low. This latest push through the 2023 high (1.1276) lends further support to the case for a meaningful bottom, setting the stage for a bullish structural shift and the next major upside extension targeting the 2021 high at 1.2350. Setbacks should be exceptionally well supported ahead of 1.1000.

EURUSD Chart
R2 1.1830 - 1 July/2025 high - Strong
R1 1.1800 - Figure - Medium
S1 1.1557 - 17 July low - Medium
S2 1.1446 - 19 June low - Strong
EURUSD: fundamental overview

The Euro has been better bid amid rumors of a potential US-EU trade deal, similar to a recent US-Japan agreement, with the EU possibly facing 15% US tariffs instead of the threatened 30%. However, US trade advisor Peter Navarro cautioned against taking these rumors at face value. The European Central Bank is expected to pause its rate-cutting cycle today, maintaining the main rate at 2.15% and the deposit rate at 2%, as inflation hits the 2% target and the strong Euro curbs imported inflation. Eurozone economic data, including manufacturing and services PMIs, will be closely watched for signs of resilience amid trade uncertainties, with GDP growth projected to remain weak at 0.1% in Q3 2025 and 0.2% in Q4.

 
USDJPY: technical overview

There are signs of a meaningful top in place after the market put in a multi-year high in 2024. At this point, the door is now open for a deeper setback below the 2024 low at 139.58, exposing a retest of the 2023 low. Rallies should be well capped below 152.00.

USDJPY Chart
R2 150.00 - Psychological - Strong
R1 149.19 - 16 July high - Medium
S1 146.11 - 23 July low - Medium
S2 145.75 - 10 July low - Strong
USDJPY: fundamental overview

Rumors of Prime Minister Ishiba resigning by August have surfaced, despite his denials, following his coalition’s loss of the upper house majority. Japanese markets, however, are thriving, with the Nikkei surging 3.5% to a one-year high and Toyota shares soaring 14%, boosted by a favorable US-Japan trade deal reducing tariffs from 25% to 15% and Japan pledging $550 billion in US investments. The Yen strengthened against the dollar, though bond markets showed strain with 10-year JGB yields hitting a 2008 peak of 1.59%. Economic indicators are mixed. The Japan Composite PMI held steady at 51.5, signaling modest growth, but manufacturing contracted (PMI 48.8), while the services sector expanded strongly (PMI 53.5). Political uncertainty and trade developments could further influence Japan’s economic outlook.

 
AUDUSD: technical overview

There are signs of the potential formation of a longer-term base with the market trading down into a meaningful longer-term support zone. Only a monthly close below 0.5500 would give reason for rethink. A monthly close back above 0.7000 will take the big picture pressure off the downside and strengthen case for a bottom.

AUDUSD Chart
R2 0.6688 - 7 November 2024 high - Strong
R1 0.6602 - 23 July/2025 high - Medium
S1 0.6454 - 17 July low - Medium
S1 0.6373 - 23 June low - Strong
AUDUSD: fundamental overview

The Australian dollar is gaining strength for the fourth consecutive session, driven by improved global trade sentiment following a tariff deal with Japan and progress in US-China trade talks. Australia’s economy is showing positive signs, with the Composite PMI rising to 53.6 in July, reflecting strong growth in both manufacturing and services sectors. However, caution persists due to a slowdown in the Westpac Leading Index, weaker commodity prices, and declining business confidence, while the Reserve Bank of Australia remains cautious, favoring gradual policy easing as inflation trends are monitored.

 
Suggested reading

Tariffs Are Here To Stay, Even After Trump, C. Smart, Barron’s (July 22, 2025)

The Money Fight That Will Shape Europe’s Future, C. Bildt, Project Syndicate (July 23, 2025)


Any opinions, news, research, analyses, prices or other information ("information") contained on this Blog, constitutes marketing communication and it has not been prepared in accordance with legal requirements designed to promote the independence of investment research. Further, the information contained within this Blog does not contain (and should not be construed as containing) investment advice or an investment recommendation, or an offer of, or solicitation for, a transaction in any financial instrument. LMAX Group has not verified the accuracy or basis-in-fact of any claim or statement made by any third parties as comments for every Blog entry.

LMAX Group will not accept liability for any loss or damage, including without limitation to, any loss of profit, which may arise directly or indirectly from use of or reliance on such information. No representation or warranty is given as to the accuracy or completeness of the above information. While the produced information was obtained from sources deemed to be reliable, LMAX Group does not provide any guarantees about the reliability of such sources. Consequently any person acting on it does so entirely at his or her own risk. It is not a place to slander, use unacceptable language or to promote LMAX Group or any other FX and CFD provider and any such postings, excessive or unjust comments and attacks will not be allowed and will be removed from the site immediately.

Day Image
23rd July 2025 | view in browser
Dollar dips as politics cloud Fed picture

The dollar extended its slide on Tuesday, weighed down by soft U.S. regional data and renewed political pressure on the Fed reinforcing the market’s dovish bias.


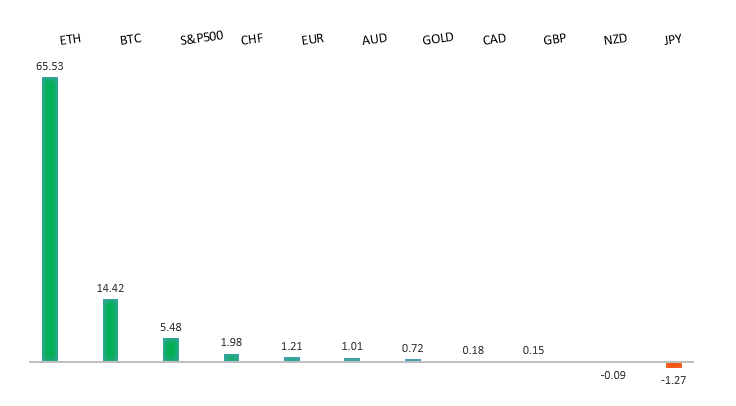
Performance chart 30day v. USD (%)
Performance Chart
 
 
Technical & fundamental highlights
EURUSD: technical overview

The Euro has broken out from a multi-month consolidation off a critical longer-term low. This latest push through the 2023 high (1.1276) lends further support to the case for a meaningful bottom, setting the stage for a bullish structural shift and the next major upside extension targeting the 2021 high at 1.2350. Setbacks should be exceptionally well supported ahead of 1.1000.

EURUSD Chart
R2 1.1800 - Figure - Medium
R1 1.1766 - 8 July high - Medium
S1 1.1557 - 17 July low - Medium
S2 1.1446 - 19 June low - Strong
EURUSD: fundamental overview

The ECB’s 2Q25 Bank Lending Survey indicates stabilized lending conditions in the euro area, with interest rates no longer significantly impacting firm loan demand and rising mortgage demand suggesting a more accommodative ECB policy, especially after the deposit rate dropped to 2.00%. One European bank notes the ECB may resume rate cuts if U.S. tariffs exceed 20% post-August 1, but could hold steady if tariffs fall to 10-15% with limited retaliation, awaiting clarity on EU-U.S. trade. Markets anticipate the ECB will maintain rates on Thursday but may signal a slight dovish tilt due to tariff uncertainties and the euro’s strength, while a potential U.S.-Europe trade deal could reduce downside risks, possibly stabilizing ECB rates as they approach a neutral zone.

 
USDJPY: technical overview

There are signs of a meaningful top in place after the market put in a multi-year high in 2024. At this point, the door is now open for a deeper setback below the 2024 low at 139.58, exposing a retest of the 2023 low. Rallies should be well capped below 152.00.

USDJPY Chart
R2 150.00 - Psychological - Strong
R1 149.19 - 16 July high - Medium
S1 146.30 - 22 July low - Medium
S2 145.75 - 10 July low - Strong
USDJPY: fundamental overview

President Trump announced a trade deal with Japan, involving a $550 billion Japanese investment in the U.S. and 15% tariffs on Japanese imports, with provisions for increased U.S. automobile and agricultural exports to Japan. Details on the elimination of existing 25% tariffs on Japanese cars remain unclear, and the yen faces potential further weakness as markets await more information. Political instability in Japan, following the LDP-Komeito coalition’s loss of majority in the upper house, may push Prime Minister Ishiba to resign, complicating the Bank of Japan’s plans for rate hikes. The LDP will meet on July 31 to discuss election results and Ishiba’s leadership, while opposition parties advocate for fiscal stimulus and looser monetary policies, potentially pressuring the BOJ to delay tightening despite rising inflation.

 
AUDUSD: technical overview

There are signs of the potential formation of a longer-term base with the market trading down into a meaningful longer-term support zone. Only a monthly close below 0.5500 would give reason for rethink. A monthly close back above 0.7000 will take the big picture pressure off the downside and strengthen case for a bottom.

AUDUSD Chart
R2 0.6596 - 11 July/2025 high - Strong
R1 0.6576 - 15 July high - Medium
S1 0.6454 - 17 July low - Medium
S1 0.6373 - 23 June low - Strong
AUDUSD: fundamental overview

The Reserve Bank of Australia maintained the Official Cash Rate at 3.85% for the third time in four meetings, with six of nine members voting to hold rates, favoring a cautious approach to monetary policy. The RBA noted that policy remains modestly restrictive, awaiting confirmation that inflation is sustainably nearing its target, with upcoming second-quarter inflation data likely pivotal for a potential rate cut in August. Weak jobs data, showing unemployment rising to 4.3%, has increased expectations for an August cut, with markets anticipating 66 basis points of cuts by year-end. Additionally, the RBA believes tariff fears have peaked, and China’s stable economy reduces pressure for immediate stimulus, potentially limiting Australian dollar strength in the near term.

 
Suggested reading

Jerome Powell Has Already Fallen to Stalkers, J. Calhoun, Alhambra (July 20, 2025)

The Nvidia of crypto, S. McBride, RiskHedge (July 21, 2025)


Any opinions, news, research, analyses, prices or other information ("information") contained on this Blog, constitutes marketing communication and it has not been prepared in accordance with legal requirements designed to promote the independence of investment research. Further, the information contained within this Blog does not contain (and should not be construed as containing) investment advice or an investment recommendation, or an offer of, or solicitation for, a transaction in any financial instrument. LMAX Group has not verified the accuracy or basis-in-fact of any claim or statement made by any third parties as comments for every Blog entry.

LMAX Group will not accept liability for any loss or damage, including without limitation to, any loss of profit, which may arise directly or indirectly from use of or reliance on such information. No representation or warranty is given as to the accuracy or completeness of the above information. While the produced information was obtained from sources deemed to be reliable, LMAX Group does not provide any guarantees about the reliability of such sources. Consequently any person acting on it does so entirely at his or her own risk. It is not a place to slander, use unacceptable language or to promote LMAX Group or any other FX and CFD provider and any such postings, excessive or unjust comments and attacks will not be allowed and will be removed from the site immediately.

Day Image
22nd July 2025 | view in browser
Trade tensions and Fed scrutiny hit dollar

The US Dollar got off to a soft start to the week, though thinner summer trading conditions have restrained activity across G10 and emerging markets


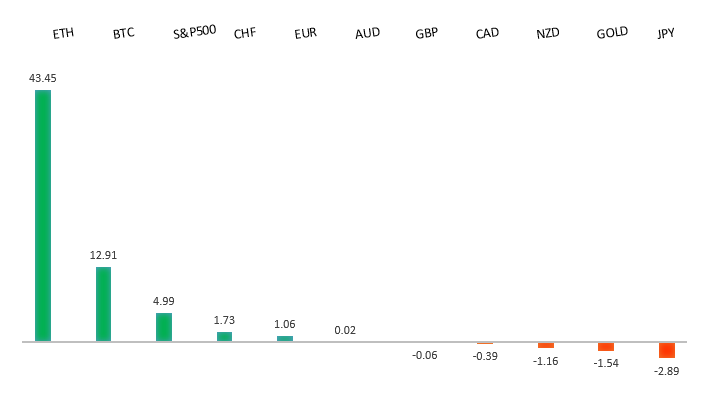
Performance chart 30day v. USD (%)
Performance Chart
 
 
Technical & fundamental highlights
EURUSD: technical overview

The Euro has broken out from a multi-month consolidation off a critical longer-term low. This latest push through the 2023 high (1.1276) lends further support to the case for a meaningful bottom, setting the stage for a bullish structural shift and the next major upside extension targeting the 2021 high at 1.2350. Setbacks should be exceptionally well supported ahead of 1.1000.

EURUSD Chart
R2 1.1800 - Figure - Medium
R1 1.1722 - 16 July high - Medium
S1 1.1557 - 17 July low - Medium
S2 1.1446 - 19 June low - Strong
EURUSD: fundamental overview

ECB President Lagarde expressed confidence in managing inflation from over 10% in 2022 without triggering a eurozone recession, with the ECB expected to maintain its 2% deposit rate at Thursday’s meeting. Despite President Trump’s threatened 30% tariffs on EU imports, which could slow growth and inflation if exceeding 10%, the ECB is likely to hold off on immediate action, possibly signaling a September rate cut if risks intensify. Markets anticipate the ECB’s next cut may be its last this cycle, while expecting more Fed cuts, boosting EURUSD optimism. The ECB’s bank lending survey, upcoming PMI data, and Germany’s IFO index will provide insights into tariff impacts, as the EU, led by countries like Germany, prepares potential “anti-coercion” countermeasures against the U.S. if trade talks fail. Meanwhile, the Kremlin supports new Ukraine peace talks, but significant diplomatic gaps remain.

 
USDJPY: technical overview

There are signs of a meaningful top in place after the market put in a multi-year high in 2024. At this point, the door is now open for a deeper setback below the 2024 low at 139.58, exposing a retest of the 2023 low. Rallies should be well capped below 152.00.

USDJPY Chart
R2 150.00 - Psychological - Strong
R1 149.19 - 16 July high - Medium
S1 146.91 - 16 July low - Medium
S2 145.75 - 10 July low - Strong
USDJPY: fundamental overview

Japanese Prime Minister Shigeru Ishiba faces growing pressure after his coalition’s loss of its upper house majority, potentially complicating U.S.-Japan trade talks and increasing calls for his resignation if he fails to prevent steep U.S. auto tariffs. The yen weakened as expected, with markets having anticipated the coalition’s defeat, but the USDJPY rise is likely capped as focus shifts to coalition negotiations and ongoing trade discussions. The Bank of Japan’s monetary normalization faces hurdles due to political pressure for fiscal stimulus, though sustained wage growth and firm inflation expectations should keep gradual normalization on track. However, yen bullish factors, like a swift U.S.-Japan trade deal or BOJ policy progress, now face higher obstacles, potentially fueling further yen weakness if bond market volatility prompts BOJ adjustments.

 
AUDUSD: technical overview

There are signs of the potential formation of a longer-term base with the market trading down into a meaningful longer-term support zone. Only a monthly close below 0.5500 would give reason for rethink. A monthly close back above 0.7000 will take the big picture pressure off the downside and strengthen case for a bottom.

AUDUSD Chart
R2 0.6596 - 11 July/2025 high - Strong
R1 0.6555 - 16 July high - Medium
S1 0.6454 - 17 July low - Medium
S1 0.6373 - 23 June low - Strong
AUDUSD: fundamental overview

The Australian dollar weakened slightly against the US dollar, after the Reserve Bank of Australia minutes revealed a cautious approach to further interest rate cuts, emphasizing a “gradual” easing strategy. The RBA is awaiting confirmation that inflation will sustainably hit its target, with next week’s Q2 CPI data and updated staff forecasts critical for its August 12 meeting. Attention now turns to RBA Governor Bullock’s upcoming speech, especially after June’s unexpected unemployment rise to 4.3%.

 
Suggested reading

Why I’m moving to Abu Dhabi, S. McBride, RiskHedge (July 18, 2025)

Kevin Hassett Wants To Be Fed Chairman, J. Tamny Forbes (July 20, 2025)


Any opinions, news, research, analyses, prices or other information ("information") contained on this Blog, constitutes marketing communication and it has not been prepared in accordance with legal requirements designed to promote the independence of investment research. Further, the information contained within this Blog does not contain (and should not be construed as containing) investment advice or an investment recommendation, or an offer of, or solicitation for, a transaction in any financial instrument. LMAX Group has not verified the accuracy or basis-in-fact of any claim or statement made by any third parties as comments for every Blog entry.

LMAX Group will not accept liability for any loss or damage, including without limitation to, any loss of profit, which may arise directly or indirectly from use of or reliance on such information. No representation or warranty is given as to the accuracy or completeness of the above information. While the produced information was obtained from sources deemed to be reliable, LMAX Group does not provide any guarantees about the reliability of such sources. Consequently any person acting on it does so entirely at his or her own risk. It is not a place to slander, use unacceptable language or to promote LMAX Group or any other FX and CFD provider and any such postings, excessive or unjust comments and attacks will not be allowed and will be removed from the site immediately.

 
Day Image
20th July 2025 | view in browser
Powell faces pressure amid Fed rate debate
Federal Reserve members Waller, Warsh, and Bowman have been out advocating for lower interest rates, but the majority of the Fed prefers a cautious, data-driven approach, favoring a “wait and see” stance.
Performance chart 30day v. USD (%)
Performance Chart
Technical & fundamental highlights
EURUSD: technical overview
The Euro has broken out from a multi-month consolidation off a critical longer-term low. This latest push through the 2023 high (1.1276) lends further support to the case for a meaningful bottom, setting the stage for a bullish structural shift and the next major upside extension targeting the 2021 high at 1.2350. Setbacks should be exceptionally well supported ahead of 1.1000.
EURUSD Chart
R2 1.1800 - Figure - Medium R1 1.1722 - 16 July high - Medium S1 1.1557 - 17 July low - Medium S2 1.1446 - 19 June low - Strong
EURUSD: fundamental overview
Dimitar Radev, Bulgaria’s central bank chief and incoming ECB interest rate setter, warns that political uncertainties, such as France’s fiscal issues and U.S. trade policies under Trump, pose growing risks for central banks, requiring them to integrate these factors into their risk assessments. Incoming Austrian central bank Governor Martin Kocher criticizes Trump’s attacks on Fed independence, cautioning that undermining monetary policy could fuel inflation or even hyperinflation. The ECB is expected to maintain its 2% deposit rate at its July meeting, staying resilient against Trump’s threatened 30% EU import tariffs and France’s political instability, while potentially signaling a September rate cut if risks intensify. EU envoys will meet to plan countermeasures for a possible no-deal scenario, with key Eurozone data this week, including consumer confidence, PMI, and business surveys, likely to influence ECB policy expectations.
USDJPY: technical overview
There are signs of a meaningful top in place after the market put in a multi-year high in 2024. At this point, the door is now open for a deeper setback below the 2024 low at 139.58, exposing a retest of the 2023 low. Rallies should be well capped below 152.00.
USDJPY Chart
R2 150.00 - Psychological - Strong R1 149.19 - 16 July high - Medium S1 146.91 - 16 July low - Medium S2 145.75 - 10 July low - Strong
USDJPY: fundamental overview
Prime Minister Shigeru Ishiba’s Liberal Democratic Party and its coalition partner Komeito lost their majority in Japan’s upper house election, marking the first time since 1955 that the LDP lacks control in either legislative chamber. Despite this, Ishiba plans to stay in office, focusing on wage growth, GDP targets, and security issues, though historical precedent suggests recent LDP leaders resigned shortly after similar losses. The opposition, while gaining seats, is too fragmented to form a stable government, pushing the LDP to seek ad hoc alliances to pass legislation. This outcome aligns with market expectations, limiting significant yen weakening, though fiscal risks may rise if the opposition demands larger stimulus. The loss complicates US-Japan trade talks and adds pressure on the Bank of Japan’s monetary normalization, but sustained economic growth and inflation should keep the BOJ’s gradual policy shift on track.
AUDUSD: technical overview
There are signs of the potential formation of a longer-term base with the market trading down into a meaningful longer-term support zone. Only a monthly close below 0.5500 would give reason for rethink. A monthly close back above 0.7000 will take the big picture pressure off the downside and strengthen case for a bottom.
AUDUSD Chart
R2 0.6596 - 11 July/2025 high - Strong R1 0.6555 - 16 July high - Medium S1 0.6454 - 17 July low - Medium S1 0.6373 - 23 June low - Strong
AUDUSD: fundamental overview
Australia’s labor market resilience and inflation concerns led the Reserve Bank of Australia to pause rate changes in July, despite weak economic momentum and low consumer confidence. Last week’s disappointing jobs data, with unemployment rising from 4.1% to 4.3%, has increased expectations for an RBA rate cut in August, along with a likely downgrade in its employment forecast. Markets are awaiting further clues from the RBA’s July meeting minutes and Governor Michele Bullock’s upcoming speech.
Suggested reading
Debt Reckoning, M. Childs, Harper’s Magazine (July 20, 2025) Why China Should Revalue the Renminbi, M. Pettis Carnegie Endowment (July 15, 2025)

Any opinions, news, research, analyses, prices or other information ("information") contained on this Blog, constitutes marketing communication and it has not been prepared in accordance with legal requirements designed to promote the independence of investment research. Further, the information contained within this Blog does not contain (and should not be construed as containing) investment advice or an investment recommendation, or an offer of, or solicitation for, a transaction in any financial instrument. LMAX Group has not verified the accuracy or basis-in-fact of any claim or statement made by any third parties as comments for every Blog entry.

LMAX Group will not accept liability for any loss or damage, including without limitation to, any loss of profit, which may arise directly or indirectly from use of or reliance on such information. No representation or warranty is given as to the accuracy or completeness of the above information. While the produced information was obtained from sources deemed to be reliable, LMAX Group does not provide any guarantees about the reliability of such sources. Consequently any person acting on it does so entirely at his or her own risk. It is not a place to slander, use unacceptable language or to promote LMAX Group or any other FX and CFD provider and any such postings, excessive or unjust comments and attacks will not be allowed and will be removed from the site immediately.

Day Image
11th July 2025 | view in browser
Dollar at a crossroads as policy shifts loom

Following the One Big Beautiful bill’s passage, the administration is focused on boosting nominal GDP and resolving trade negotiations by August 1, though extensions are possible despite Trump’s firm deadline.


Performance chart 30day v. USD (%)
Performance Chart
 
 
Technical & fundamental highlights
EURUSD: technical overview

The Euro has broken out from a multi-month consolidation off a critical longer-term low. This latest push through the 2023 high lends further support to the case for a meaningful bottom, setting the stage for a bullish structural shift and the next major upside extension targeting the 2021 high at 1.2350. Setbacks should be exceptionally well supported below 1.1500.

EURUSD Chart
R2 1.1900 - Figure - Medium
R1 1.1830 - 1 July/2025 high - Medium
S1 1.1662 - 10 July low - Medium
S2 1.1654 - 26 June low - Medium
EURUSD: fundamental overview

One major bank’s economists note the ECB is cautiously approaching further interest rate cuts, despite a stronger euro potentially pushing inflation below the 2% target, as rate changes take time to impact the economy and the euro’s rise is less significant against a basket of currencies. Eurozone companies, facing profit pressures, are encouraged to use the stronger euro to rebuild margins rather than lower prices. Large-scale fiscal spending is expected to offset any negative effects of the euro’s strength, while market expectations of limited Fed rate cuts and potential U.S. trade developments support a bullish outlook for the euro against the dollar.

 
USDJPY: technical overview

There are signs of a meaningful top in place after the market put in a multi-year high in 2024. At this point, the door is now open for a deeper setback below the 2024 low at 139.58 over the coming weeks, exposing a retest of the 2023 low. Rallies should be well capped below 150.00.

USDJPY Chart
R2 148.03 - 23 June high - Strong
R1 147.19 - 9 July high - Medium
S1 144.18 - 4 July low - Medium
S2 142.68 - 1 July low - Strong
USDJPY: fundamental overview

Investors doubt a significant rebound in longer-dated Japanese Government Bonds due to expectations of increased government spending following Japan’s upper house election on July 20, 2025, as the ruling LDP’s low approval ratings may force PM Ishiba’s minority government to concede to opposition demands for more fiscal stimulus. The Bank of Japan is unlikely to raise interest rates soon, as rising long-term yields already tighten financial conditions, compounded by threats of U.S. tariffs and a record 19.4% drop in vehicle export prices, which could hurt automakers’ profitability and wage growth—a key BOJ goal. With negative real interest rates in Japan and widening U.S.-Japan yield differentials, the USDJPY exchange rate may test higher levels, with markets eyeing upcoming U.S. CPI data.

 
AUDUSD: technical overview

There are signs of the potential formation of a longer-term base with the market trading down into a meaningful longer-term support zone. Only a monthly close below 0.5500 would give reason for rethink. A monthly close back above 0.7000 will take the big picture pressure off the downside and strengthen case for a bottom.

AUDUSD Chart
R2 0.6600 - Medium - Strong
R1 0.6596 - 11 July/2025 high - Medium
S1 0.6484 - 25 June low - Medium
S1 0.6373 - 23 June low - Strong
AUDUSD: fundamental overview

The Australian dollar has held strong above its 50-day moving average after the Reserve Bank of Australia unexpectedly kept the Official Cash Rate at 3.85%, defying market expectations of a cut. Prime Minister Albanese’s upcoming visit to China from July 12-18 aims to improve trade and diplomatic ties, potentially boosting Australian exports and supporting the AUD. Additionally, China’s efforts to stabilize its economy, curb price wars, and achieve strong 5.4% GDP growth in Q1 2025 create a favorable environment for Australian exports, further strengthening the Australian Dollar.

 
Suggested reading

A Front-Row Seat To An All-New Industrial Revolution, L. Navellier, InvestorPlace(July 9, 2025)

The Shadowy Past of the Secret Bank That Controls the World, J. Levy American Thinker (July 9, 2025)


Any opinions, news, research, analyses, prices or other information ("information") contained on this Blog, constitutes marketing communication and it has not been prepared in accordance with legal requirements designed to promote the independence of investment research. Further, the information contained within this Blog does not contain (and should not be construed as containing) investment advice or an investment recommendation, or an offer of, or solicitation for, a transaction in any financial instrument. LMAX Group has not verified the accuracy or basis-in-fact of any claim or statement made by any third parties as comments for every Blog entry.

LMAX Group will not accept liability for any loss or damage, including without limitation to, any loss of profit, which may arise directly or indirectly from use of or reliance on such information. No representation or warranty is given as to the accuracy or completeness of the above information. While the produced information was obtained from sources deemed to be reliable, LMAX Group does not provide any guarantees about the reliability of such sources. Consequently any person acting on it does so entirely at his or her own risk. It is not a place to slander, use unacceptable language or to promote LMAX Group or any other FX and CFD provider and any such postings, excessive or unjust comments and attacks will not be allowed and will be removed from the site immediately.

Day Image
10th July 2025 | view in browser
Fed split on tariffs, Dollar dips

The release of the June FOMC minutes revealed a divided Federal Reserve, concerned about tariff-related uncertainties impacting inflation, though data has yet to confirm these effects.


Performance chart 30day v. USD (%)
Performance Chart
 
 
Technical & fundamental highlights
EURUSD: technical overview

The Euro has broken out from a multi-month consolidation off a critical longer-term low. This latest push through the 2023 high lends further support to the case for a meaningful bottom, setting the stage for a bullish structural shift and the next major upside extension targeting the 2021 high at 1.2350. Setbacks should be exceptionally well supported below 1.1500.

EURUSD Chart
R2 1.1900 - Figure - Medium
R1 1.1830 - 1 July/2025 high - Medium
S1 1.1682 - 8 July low - Medium
S2 1.1654 - 26 June low - Medium
EURUSD: fundamental overview

ECB Governing Council members Robert Holzmann and Joachim Nagel expressed caution on further interest rate cuts, with Holzmann suggesting current rates may suffice for economic stimulus and Nagel advocating for a flexible, data-driven approach amid global uncertainties like trade tensions and geopolitical risks. Meanwhile, France and the UK signed a historic declaration to coordinate their nuclear deterrents, signaling deeper European integration and a potential shift from U.S. reliance. Markets anticipate limited ECB rate cuts this year, expect two from the Fed, and see a favorable euro outlook due to monetary policy divergence, potential U.S. trade deals, and seasonal dollar weakness, supporting a bullish stance on EURUSD.

 
USDJPY: technical overview

There are signs of a meaningful top in place after the market put in a multi-year high in 2024. At this point, the door is now open for a deeper setback below the 2024 low at 139.58 over the coming weeks, exposing a retest of the 2023 low. Rallies should be well capped below 150.00.

USDJPY Chart
R2 148.03 - 23 June high - Strong
R1 147.19 - 9 July high - Medium
S1 144.18 - 4 July low - Medium
S2 142.68 - 1 July low - Strong
USDJPY: fundamental overview

Japanese officials are frustrated with the US administration’s tariff strategy, as Japan’s restrained response contrasts with the EU, Canada, and China’s threats of countermeasures. A former official suggested Japan might reconsider its tariff concessions on US goods, noting that diplomacy may not sway the White House, which seems to respond only to leverage. Meanwhile, Japan’s bond market anticipates increased government spending after the July 20 upper house election, reducing expectations for a rebound in longer-dated Japanese Government Bonds. The Bank of Japan is cautious about raising interest rates due to rising long-term yields and potential US tariffs, despite inflation exceeding the 2% target, leading markets to doubt policy normalization in 2025. Japan’s producer price inflation slowed to 2.9% in June, signaling easing cost pressures, though consumer prices remain elevated due to factors like service inflation and tourism demand. With negative real interest rates and widening US-Japan yield differentials, USDJPY is likely to test higher levels, with markets eyeing upcoming US CPI data.

 
AUDUSD: technical overview

There are signs of the potential formation of a longer-term base with the market trading down into a meaningful longer-term support zone. Only a monthly close below 0.5500 would give reason for rethink. A monthly close back above 0.7000 will take the big picture pressure off the downside and strengthen case for a bottom.

AUDUSD Chart
R2 0.6600 - Medium - Strong
R1 0.6591 - 1 July/2025 high - Medium
S1 0.6484 - 25 June low - Medium
S1 0.6373 - 23 June low - Strong
AUDUSD: fundamental overview

Markets are increasingly viewing the August 1 deadline as an extension, with the U.S. administration leaning toward trade deals rather than reverting to high tariffs, fostering a risk-on trading environment that supports the Australian dollar above its 50-day moving average. The Reserve Bank of Australia unexpectedly kept the Official Cash Rate at 3.85%, boosting AUD optimism, as it awaits quarterly CPI data to ensure inflation is sustainably nearing the 2.5% target amid global and domestic uncertainties, including trade policy risks. With Australia’s robust labor market and low unemployment reducing the need for immediate rate cuts, the RBA noted that the effects of this year’s 50 basis points of cuts are still unfolding, with markets now expecting two rate cuts in 2025 instead of three.

 
Suggested reading

How Inflation Is Eating The Labor Market, A. Bustamante, Barron’s (July 9, 2025)

This Indicator Says Recession Risks Are Rising, M. Hulbert, MarketWatch (July 9, 2025)


Any opinions, news, research, analyses, prices or other information ("information") contained on this Blog, constitutes marketing communication and it has not been prepared in accordance with legal requirements designed to promote the independence of investment research. Further, the information contained within this Blog does not contain (and should not be construed as containing) investment advice or an investment recommendation, or an offer of, or solicitation for, a transaction in any financial instrument. LMAX Group has not verified the accuracy or basis-in-fact of any claim or statement made by any third parties as comments for every Blog entry.

LMAX Group will not accept liability for any loss or damage, including without limitation to, any loss of profit, which may arise directly or indirectly from use of or reliance on such information. No representation or warranty is given as to the accuracy or completeness of the above information. While the produced information was obtained from sources deemed to be reliable, LMAX Group does not provide any guarantees about the reliability of such sources. Consequently any person acting on it does so entirely at his or her own risk. It is not a place to slander, use unacceptable language or to promote LMAX Group or any other FX and CFD provider and any such postings, excessive or unjust comments and attacks will not be allowed and will be removed from the site immediately.

Day Image
8th July 2025 | view in browser
Dollar dips as Fed expectations cool

The U.S. dollar weakened after the New York Fed’s 1-year inflation expectations cooled off. Meanwhile, President Trump’s criticism of Federal Reserve Chair Powell and his demand for Powell’s resignation added pressure, though there is a sense the Buck won’t be wanting to drop too much more ahead of next week’s CPI release.


Performance chart 30day v. USD (%)
Performance Chart
 
 
Technical & fundamental highlights
EURUSD: technical overview

The Euro has broken out from a multi-month consolidation off a critical longer-term low. This latest push through the 2023 high lends further support to the case for a meaningful bottom, setting the stage for a bullish structural shift and the next major upside extension targeting the 2021 high at 1.2350. Setbacks should be exceptionally well supported below 1.1500.

EURUSD Chart
R2 1.1900 - Figure - Medium
R1 1.1830 - 1 July/2025 high - Medium
S1 1.1682 - 8 July low - Medium
S2 1.1654 - 26 June low - Medium
EURUSD: fundamental overview

One major European bank strategist suggests the U.S. administration favors a weaker dollar to address trade deficits, citing Treasury official Bessent’s comments that the dollar’s recent drop is due to a stronger euro, driven by Europe’s fiscal policies. The strategist predicts the euro could hit $1.20 this year, potentially reaching $1.25, supported by monetary policy differences as the ECB is near a neutral rate with only one more cut expected, while the Fed faces pressure from Trump for dovish policies despite no rate cuts in July. The euro, up 2.72% last month, is the second-best performing G10 currency, boosted by optimism over a potential U.S.-EU trade deal. However, German exports fell 1.4% in May, worse than expected, due to U.S. tariffs, risking further economic strain if no trade agreement is reached.

 
USDJPY: technical overview

There are signs of a meaningful top in place after the market put in a multi-year high in 2024. At this point, the door is now open for a deeper setback below the 2024 low at 139.58 over the coming weeks, exposing a retest of the 2023 low. Rallies should be well capped below 150.00.

USDJPY Chart
R2 148.03 - 23 June high - Strong
R1 147.00 - Figure - Medium
S1 144.18 - 4 July low - Medium
S2 142.68 - 1 July low - Strong
USDJPY: fundamental overview
Japan, led by Prime Minister Shigeru Ishiba, is negotiating with the U.S. to reach a trade deal by August 1, with U.S. auto tariffs a major hurdle, as Japan’s trade negotiator Ryosei Akazawa emphasized the auto industry’s critical role. Facing July 20 elections, a corruption scandal, and low approval ratings, Ishiba’s government may adopt expansionary fiscal policies, driving up 30-year JGB yields above 3% and prompting a cautious Bank of Japan to maintain gradual tightening with no 2025 rate hikes expected. Widening U.S.-Japan yield differentials and negative real interest rates in Japan make USDJPY shorts costly, with the pair potentially in position to move a little higher before gravitating back towards medium-term support, especially if election outcomes weaken the LDP, increasing fiscal spending pressure and delaying BOJ policy normalization. Recent data shows Japan’s June M2 and M3 money stock growth at 0.9% and 0.4% year-over-year, respectively, up from 0.6% and 0.2%.
 
AUDUSD: technical overview

There are signs of the potential formation of a longer-term base with the market trading down into a meaningful longer-term support zone. Only a monthly close below 0.5500 would give reason for rethink. A monthly close back above 0.7000 will take the big picture pressure off the downside and strengthen case for a bottom.

AUDUSD Chart
R2 0.6600 - Medium - Strong
R1 0.6591 - 1 July/2025 high - Medium
S1 0.6484 - 25 June low - Medium
S1 0.6373 - 23 June low - Strong
AUDUSD: fundamental overview
The Australian dollar held above its 50-day moving average as markets view the August 1 U.S. trade deadline as a potential extension, favoring deals over high tariffs that previously disrupted markets. The Reserve Bank of Australia kept the Official Cash Rate at 3.85%, citing robust employment, low unemployment, and the need for more data to ensure inflation sustainably hits 2.5%, with upcoming CPI data being key. Despite global and domestic uncertainties, including trade policy risks, the RBA noted that prior rate cuts are still impacting the economy, and while the board was split, it leaned toward future easing, with markets now expecting two rate cuts in 2025 instead of three.
 
Suggested reading

Don’t Sleep on China, S. McBride, RiskHedge (July 7, 2025)

What A Falling Dollar Means For Inflation, T. Slok, Apollo Academy (July 6, 2025)


Any opinions, news, research, analyses, prices or other information ("information") contained on this Blog, constitutes marketing communication and it has not been prepared in accordance with legal requirements designed to promote the independence of investment research. Further, the information contained within this Blog does not contain (and should not be construed as containing) investment advice or an investment recommendation, or an offer of, or solicitation for, a transaction in any financial instrument. LMAX Group has not verified the accuracy or basis-in-fact of any claim or statement made by any third parties as comments for every Blog entry.

LMAX Group will not accept liability for any loss or damage, including without limitation to, any loss of profit, which may arise directly or indirectly from use of or reliance on such information. No representation or warranty is given as to the accuracy or completeness of the above information. While the produced information was obtained from sources deemed to be reliable, LMAX Group does not provide any guarantees about the reliability of such sources. Consequently any person acting on it does so entirely at his or her own risk. It is not a place to slander, use unacceptable language or to promote LMAX Group or any other FX and CFD provider and any such postings, excessive or unjust comments and attacks will not be allowed and will be removed from the site immediately.

Day Image
8th July 2025 | view in browser
New tariffs fuel dollar rally, equities decline

On Monday, the U.S. dollar strengthened as President Trump announced new tariffs, including 25% on Japan, South Korea, Malaysia, and Kazakhstan, 30% on South Africa, and 40% on Laos, prompting widespread selling in U.S. stocks and Treasuries.


Performance chart 30day v. USD (%)
Performance Chart
 
 
Technical & fundamental highlights
EURUSD: technical overview

The Euro has broken out from a multi-month consolidation off a critical longer-term low. This latest push through the 2023 high lends further support to the case for a meaningful bottom, setting the stage for a bullish structural shift and the next major upside extension targeting the 2021 high at 1.2350. Setbacks should be exceptionally well supported below 1.1500.

EURUSD Chart
R2 1.1900 - Figure - Medium
R1 1.1830 - 1 July/2025 high - Medium
S1 1.1687 - 7 July low - Medium
S2 1.1654 - 26 June low - Medium
EURUSD: fundamental overview

The European Union is pushing to finalize a trade deal with the United States before the July 9 deadline, following positive talks between EU Commission President Ursula von der Leyen and President Trump, with a potential 10% tariff deal on the table. Recent Eurozone data shows mixed signals: July’s Sentix Investor Confidence surged to 4.5, the highest since February 2022, indicating fading recession fears and optimism for recovery, while Germany’s industrial production rebounded strongly in May. However, May retail sales in the Eurozone dipped slightly more than expected, though annual growth remains positive, suggesting resilient consumer demand but waning momentum. Overall, the data reflects early signs of economic stabilization, which could strengthen if US-EU trade uncertainties are resolved.

 
USDJPY: technical overview

There are signs of a meaningful top in place after the market put in a multi-year high in 2024. At this point, the door is now open for a deeper setback below the 2024 low at 139.58 over the coming weeks, exposing a retest of the 2023 low. Rallies should be well capped below 150.00.

USDJPY Chart
R2 148.03 - 23 June high - Strong
R1 147.00 - Figure - Medium
S1 144.18 - 4 July low - Medium
S2 142.68 - 1 July low - Strong
USDJPY: fundamental overview

Trump announced a 25% tariff on Japan effective August 1, giving Prime Minister Ishiba time to negotiate a trade deal before the July 20 upper house elections. Recent wage data showed weakness, with real wages dropping 2.9% in May—the steepest decline in 20 months—and nominal wages rising only 1%, below expectations. Despite this, stable full-time worker wages grew 2.4%, supporting the Bank of Japan’s view of a forming wage-price cycle that could justify future rate hikes. However, the tariff threat and weak wage data may complicate BOJ’s plans, as higher US tariffs could pressure corporate profits, particularly for manufacturers, making rate hikes more challenging without a favorable trade deal.

 
AUDUSD: technical overview

There are signs of the potential formation of a longer-term base with the market trading down into a meaningful longer-term support zone. Only a monthly close below 0.5500 would give reason for rethink. A monthly close back above 0.7000 will take the big picture pressure off the downside and strengthen case for a bottom.

AUDUSD Chart
R2 0.6600 - Medium - Strong
R1 0.6591 - 1 July/2025 high - Medium
S1 0.6484 - 25 June low - Medium
S1 0.6373 - 23 June low - Strong
AUDUSD: fundamental overview

Trump’s threat of 10% tariffs on BRICS nations has raised fears of a renewed global trade war, complicating the fragile US-China trade truce. In Australia, mixed May spending data shows cautious retail but a surge in discretionary household spending, potentially reducing the urgency for aggressive rate cuts by the RBA. While markets expect a second RBA rate cut to 3.6% and more by year-end, one major US bank predicts a pause due to stable inflation, a tight labor market, and global uncertainties, with Governor Bullock’s comments likely to clarify the RBA’s stance. Recent data highlights labor market resilience, with June job ads up 1.8%.

 
Suggested reading

Say It Repeatedly, The Fed Isn’t Nor Can It Be ‘Independent’, J. Tamny, Forbes (July 6, 2025)

Investing a Lump Sum at All-Time Highs, B. Carlson, AWOCS (July 4, 2025)


Any opinions, news, research, analyses, prices or other information ("information") contained on this Blog, constitutes marketing communication and it has not been prepared in accordance with legal requirements designed to promote the independence of investment research. Further, the information contained within this Blog does not contain (and should not be construed as containing) investment advice or an investment recommendation, or an offer of, or solicitation for, a transaction in any financial instrument. LMAX Group has not verified the accuracy or basis-in-fact of any claim or statement made by any third parties as comments for every Blog entry.

LMAX Group will not accept liability for any loss or damage, including without limitation to, any loss of profit, which may arise directly or indirectly from use of or reliance on such information. No representation or warranty is given as to the accuracy or completeness of the above information. While the produced information was obtained from sources deemed to be reliable, LMAX Group does not provide any guarantees about the reliability of such sources. Consequently any person acting on it does so entirely at his or her own risk. It is not a place to slander, use unacceptable language or to promote LMAX Group or any other FX and CFD provider and any such postings, excessive or unjust comments and attacks will not be allowed and will be removed from the site immediately.

Day Image
6th July 2025 | view in browser
Dollar faces pressure from tariffs, political gridlock

Last week’s strong Non-Farm Payroll report and the Fourth of July holiday prompted markets to reduce some dollar short positions, though the recovery remains cautious.


Performance chart 30day v. USD (%)
Performance Chart
 
 
Technical & fundamental highlights
EURUSD: technical overview

The Euro has broken out from a multi-month consolidation off a critical longer-term low. This latest push through the 2023 high lends further support to the case for a meaningful bottom, setting the stage for a bullish structural shift and the next major upside extension targeting the 2021 high at 1.2350. Setbacks should be exceptionally well supported below 1.1500.

EURUSD Chart
R2 1.1900 - Figure - Medium
R1 1.1830 - 1 July/2025 high - Medium
S1 1.1708 - 30 June low - Medium
S2 1.1654 - 26 June low - Medium
EURUSD: fundamental overview

ECB’s Makhlouf predicts a long-term decline in the US dollar’s dominance but notes the euro isn’t ready to replace it due to Europe’s lack of financial and economic integration. He attributes the euro’s recent rise against the dollar to concerns about US rule of law, not euro strength, and urges Europe to enhance its security, market integration, and sovereignty. This week, focus is on whether the EU and US can agree on a trade framework before the July 9 deadline to avoid 50% tariffs on EU exports, with Bloomberg estimating a 0.3-1.4% GDP hit to the euro area depending on tariff scenarios. Optimism persists for a deal, as both sides aim to avoid a trade war, with the EU open to a 10% tariff and the US extending negotiations until August 1.

 
USDJPY: technical overview

There are signs of a meaningful top in place after the market put in a multi-year high in 2024. At this point, the door is now open for a deeper setback below the 2024 low at 139.58 over the coming weeks, exposing a retest of the 2023 low. Rallies should be well capped below 150.00.

USDJPY Chart
R2 146.19 - 24 June high - Medium
R1 145.27 - 26 June high - Medium
S1 143.00 - Figure - Medium
S2 142.68 - 1 July low - Medium
USDJPY: fundamental overview

Japan’s household spending in May surged 4.7%, exceeding expectations and marking the strongest growth since 2022, potentially bolstering the economy against U.S. tariff impacts and supporting the Bank of Japan’s case for future rate hikes. Despite this, concerns linger due to volatile data, a sharp -2.9% drop in real wages, and a modest 1% rise in nominal wages, casting doubts on sustained consumption strength. However, stable full-time worker wages, up 2.4% for 21 months, signal solid underlying trends, though a favorable trade deal may be crucial for the BOJ to confidently resume rate hikes amidst U.S. policy uncertainties.

 
AUDUSD: technical overview

There are signs of the potential formation of a longer-term base with the market trading down into a meaningful longer-term support zone. Only a monthly close below 0.5500 would give reason for rethink. A monthly close back above 0.7000 will take the big picture pressure off the downside and strengthen case for a bottom.

AUDUSD Chart
R2 0.6600 - Medium - Strong
R1 0.6591 - 1 July/2025 high - Medium
S1 0.6484 - 25 June low - Medium
S1 0.6373 - 23 June low - Strong
AUDUSD: fundamental overview

Australia’s May spending data showed mixed signals: cautious consumer spending in retail but a surge in discretionary household spending across various categories. This may reduce the urgency for immediate aggressive rate cuts by the Reserve Bank of Australia, which might wait for Q2 inflation data before deciding on further rate reductions. While markets expect a second rate cut in July to lower the cash rate to 3.6% and anticipate a terminal rate of 3.1% (or even 2.85% by some economists), one large US bank predicts the RBA will pause, citing stable inflation near the 2-3% target, a tight jobs market, expected economic growth, and a stable Chinese yuan. Upcoming ANZ-Indeed Job Advertisements data will provide further economic insights.

 
Suggested reading

Can Volkswagen reinvent itself for the electric era?, P. Nilsson, Financial Times (July 3, 2025)

Drill, Baby, Drill: These 3 Countries Are Gushing Oil, C. Mellow, Barron’s (July 3, 2025)


Any opinions, news, research, analyses, prices or other information ("information") contained on this Blog, constitutes marketing communication and it has not been prepared in accordance with legal requirements designed to promote the independence of investment research. Further, the information contained within this Blog does not contain (and should not be construed as containing) investment advice or an investment recommendation, or an offer of, or solicitation for, a transaction in any financial instrument. LMAX Group has not verified the accuracy or basis-in-fact of any claim or statement made by any third parties as comments for every Blog entry.

LMAX Group will not accept liability for any loss or damage, including without limitation to, any loss of profit, which may arise directly or indirectly from use of or reliance on such information. No representation or warranty is given as to the accuracy or completeness of the above information. While the produced information was obtained from sources deemed to be reliable, LMAX Group does not provide any guarantees about the reliability of such sources. Consequently any person acting on it does so entirely at his or her own risk. It is not a place to slander, use unacceptable language or to promote LMAX Group or any other FX and CFD provider and any such postings, excessive or unjust comments and attacks will not be allowed and will be removed from the site immediately.