Day Image
3rd July 2025 | view in browser
US trade deals lift antipodean currencies

Markets ended a subdued session as attention turned to the upcoming U.S. jobs report, with the dollar retreating after a surprising ADP jobs print, far below what was expected.


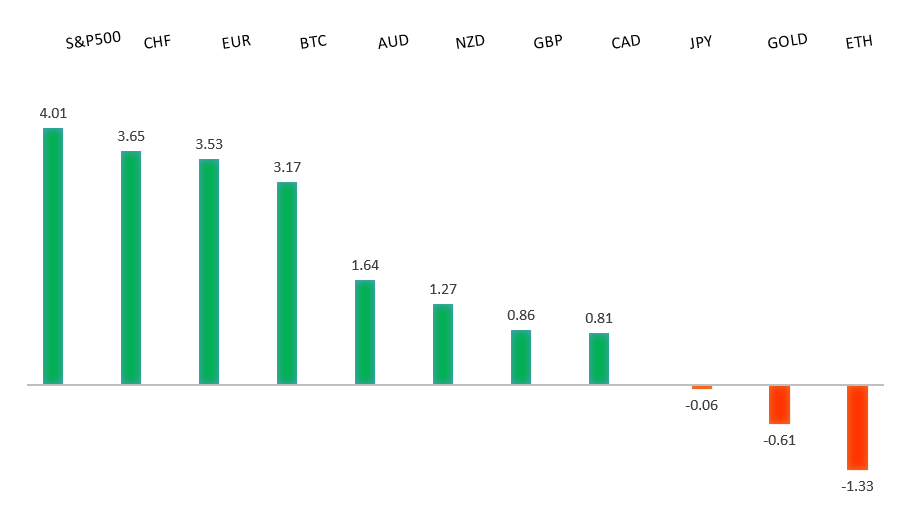
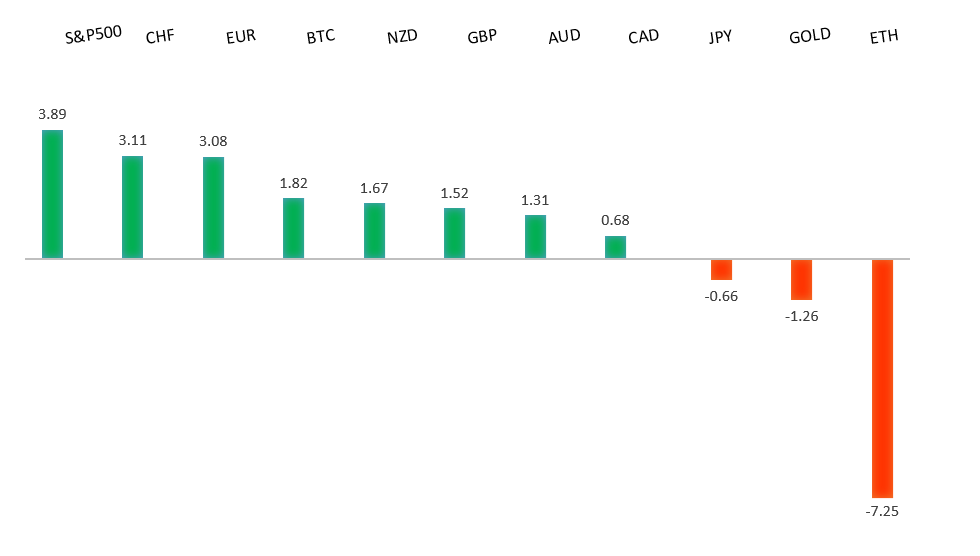
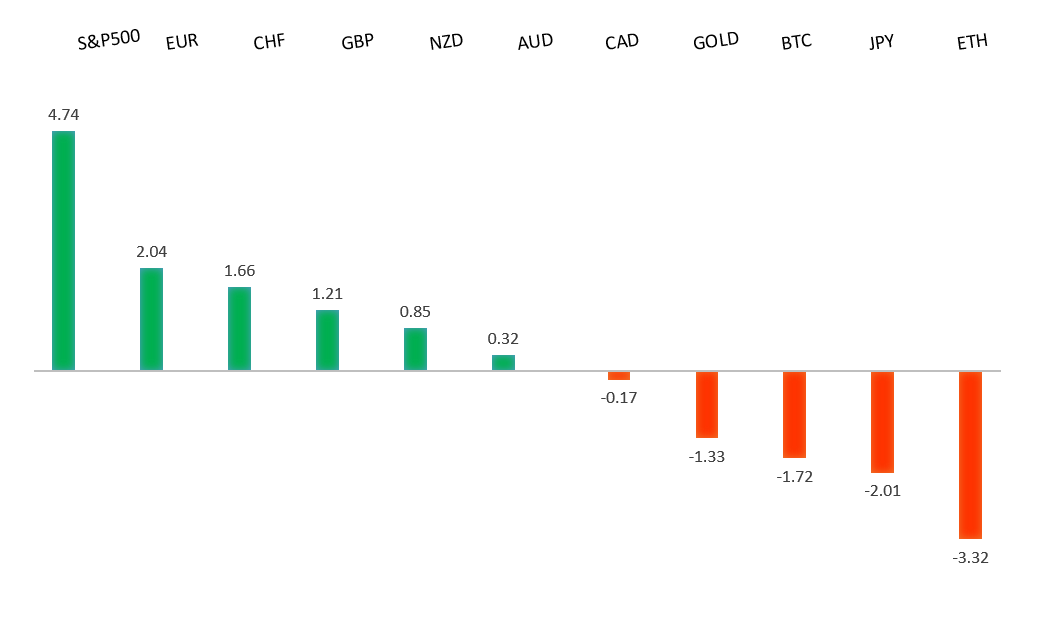
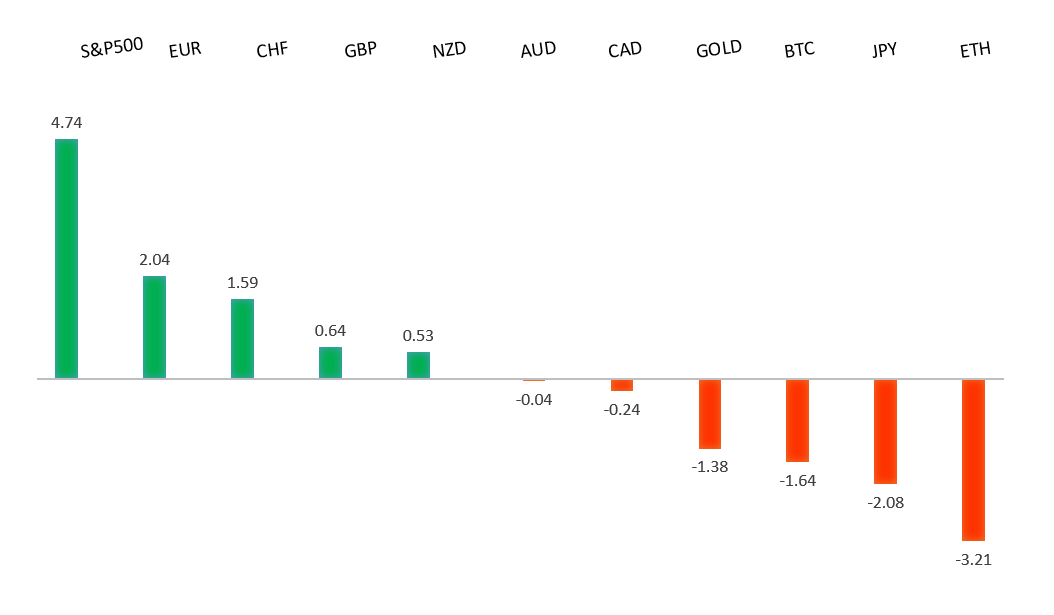
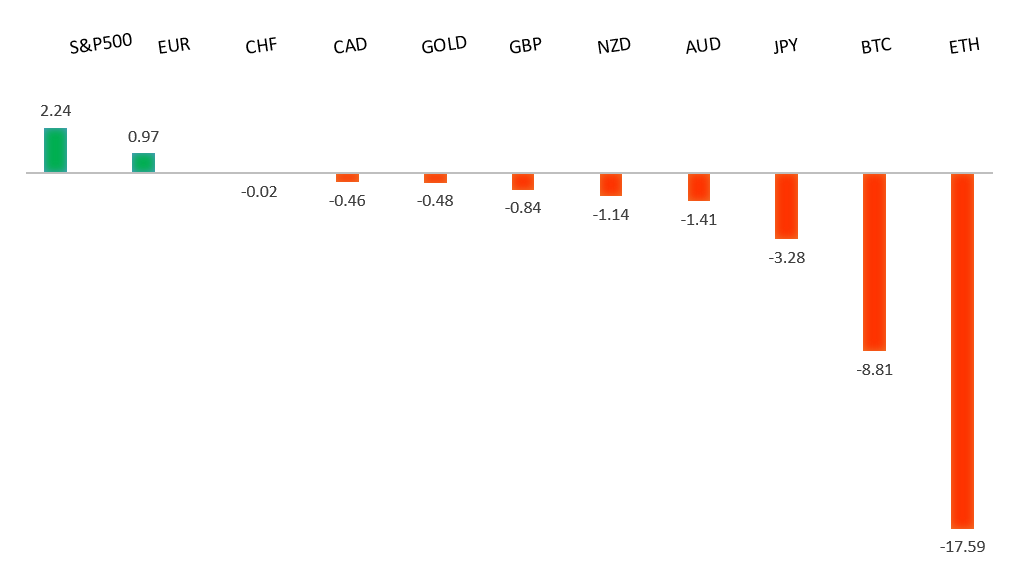
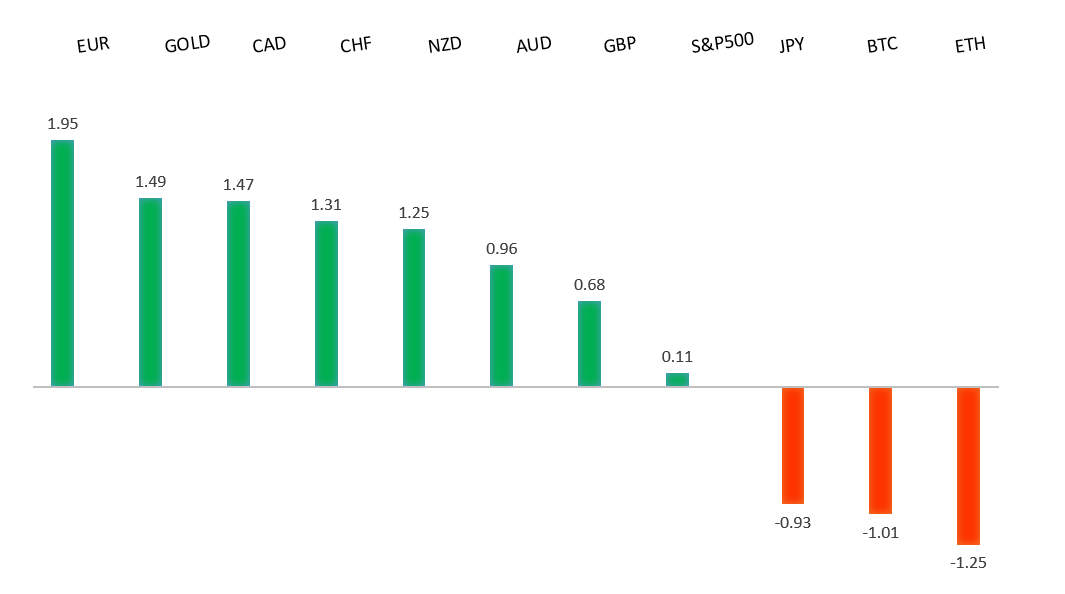
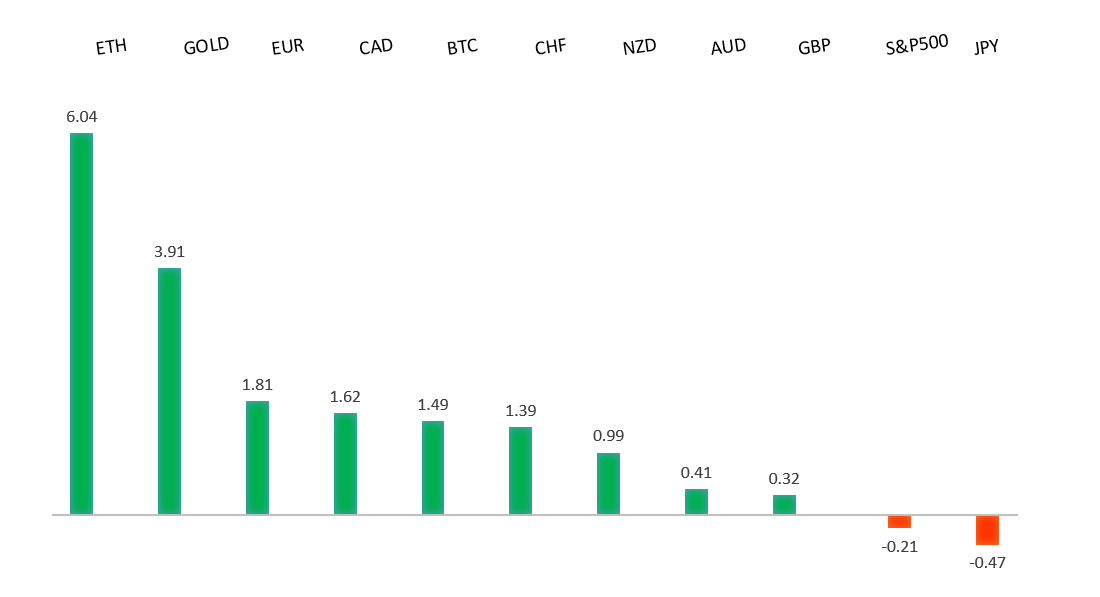
Performance chart 30day v. USD (%)
Performance Chart
 
 
Technical & fundamental highlights
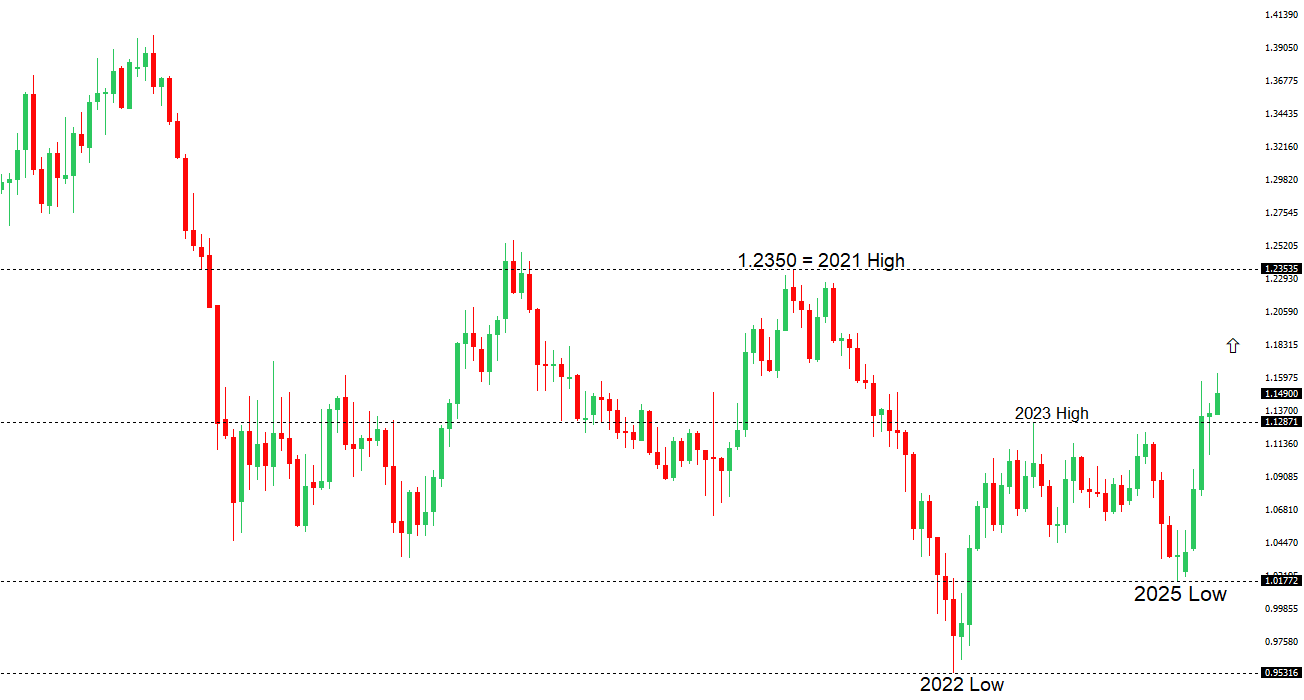
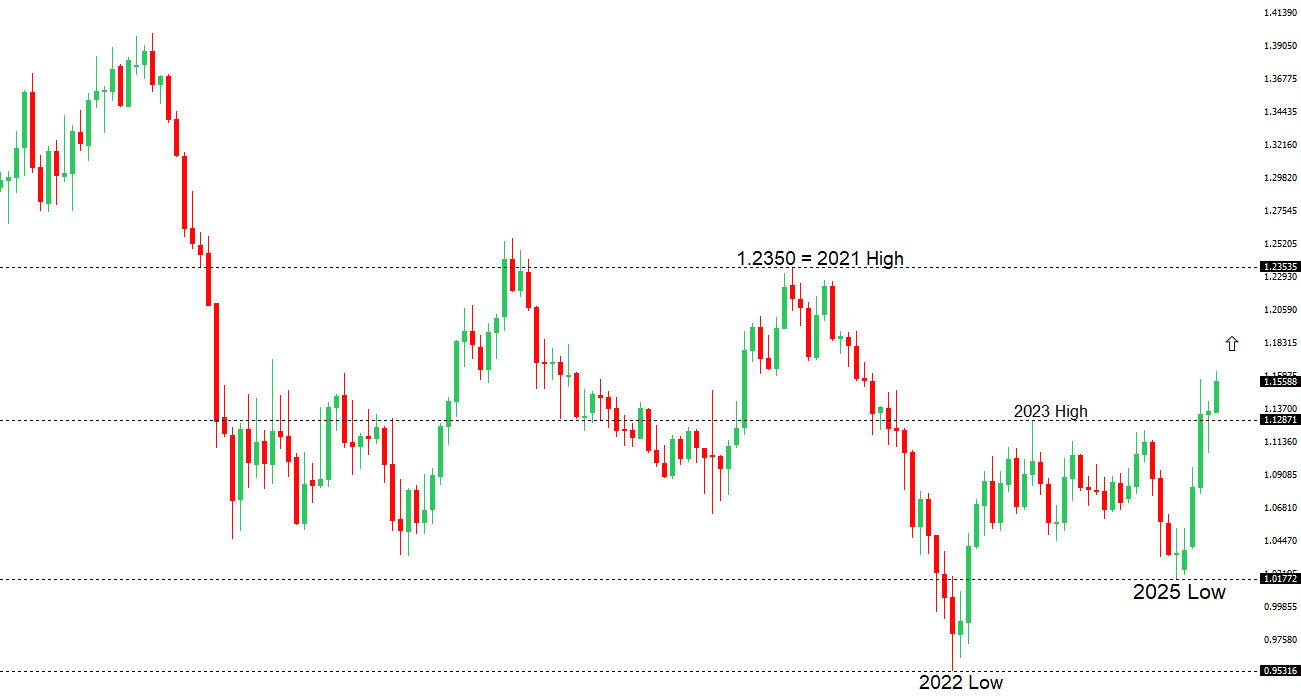
EURUSD: technical overview

The Euro has finally broken out from a multi-month consolidation off a critical longer-term low. This latest push through the 2023 high lends further support to the case for a meaningful bottom, setting the stage for a bullish structural shift and the next major upside extension targeting the 2021 high at 1.2350. Setbacks should be exceptionally well supported below 1.1500.

EURUSD Chart
R2 1.1900 - Figure - Medium
R1 1.1830 - 1 July/2025 high - Medium
S1 1.1708 - 30 June low - Medium
S2 1.1654 - 26 June low - Medium
EURUSD: fundamental overview

The euro’s recent rise has paused as ECB officials, including Vice President Luis de Guindos, expressed concerns about its rapid appreciation, fearing it could hinder efforts to maintain 2% inflation, particularly if it exceeds $1.20. ECB Chief Economist Philip Lane noted a durable shift by investors toward the euro, while one major bank warned that further euro strengthening could harm Europe’s export industry, potentially justifying more rate cuts. Despite this, markets expect only one more ECB rate cut this year, and with a potential long-term dollar bear market, the euro could continue to rise, with ECB warnings likely to intensify if it reaches $1.30 or $1.40.

 
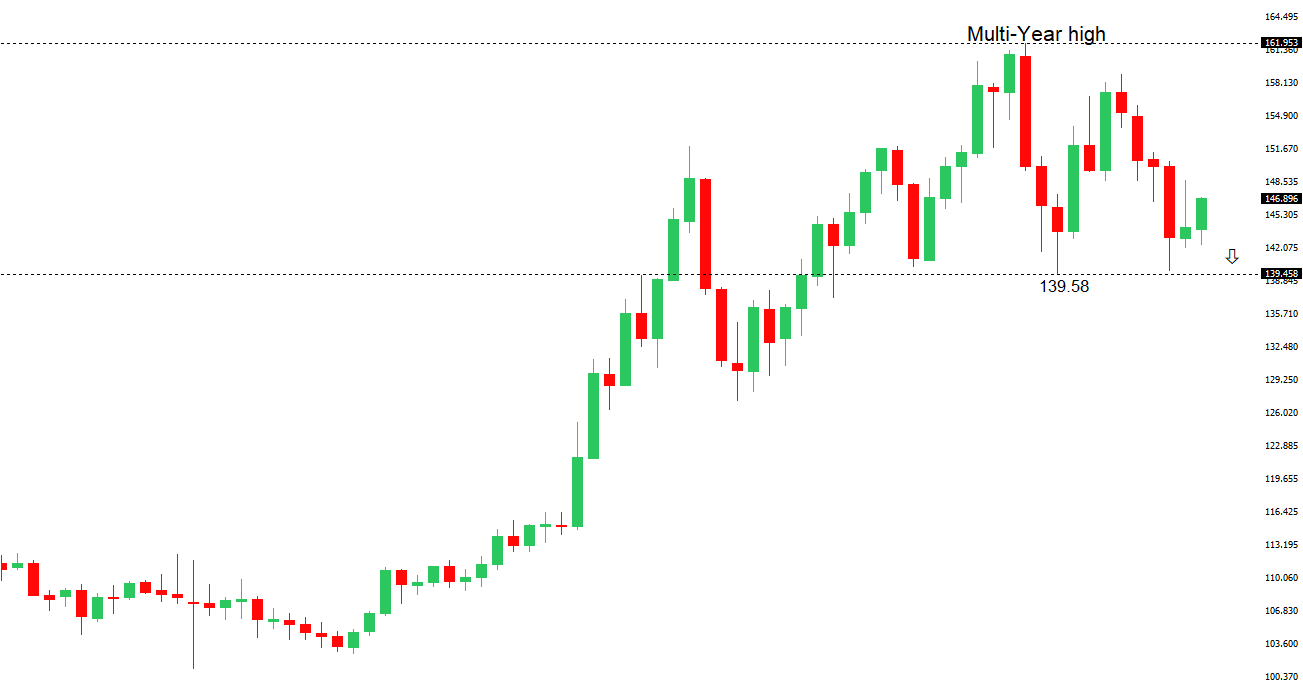
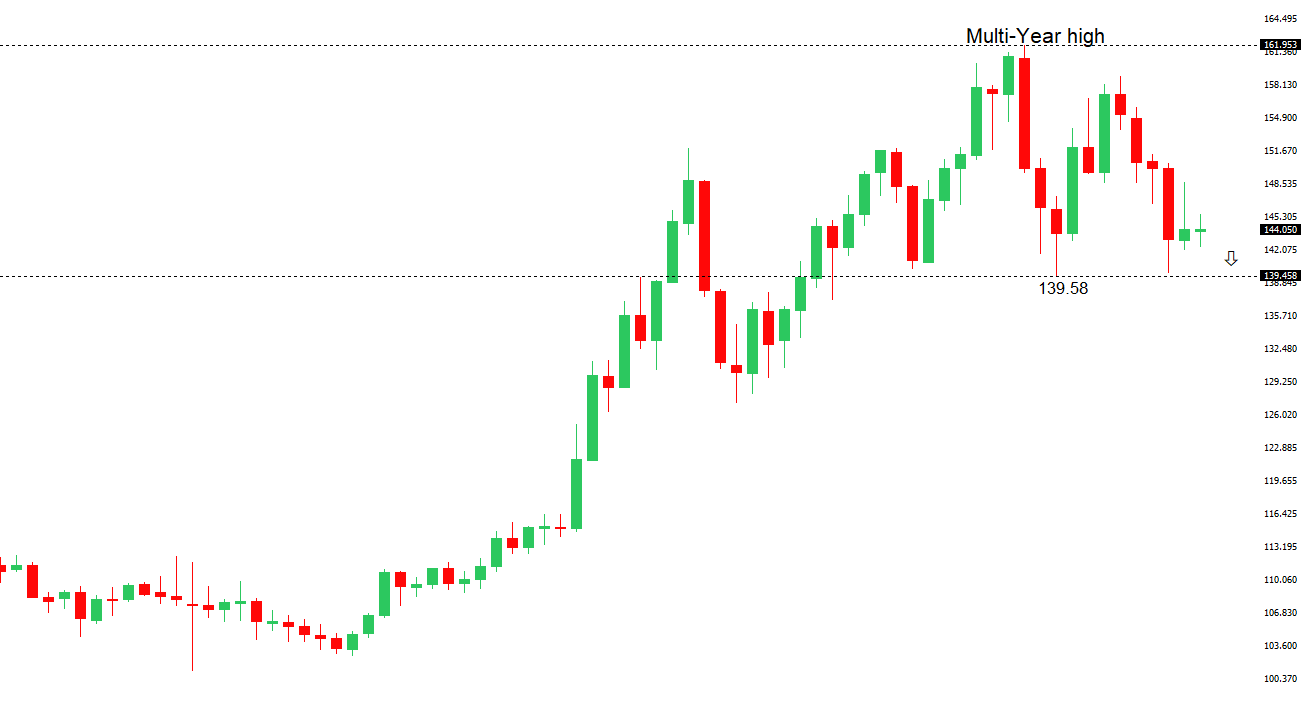
USDJPY: technical overview

There are signs of a meaningful top in place after the market put in a multi-year high in 2024. At this point, the door is now open for a deeper setback below the 2024 low at 139.58 over the coming weeks, exposing a retest of the 2023 low. Rallies should be well capped below 150.00.

USDJPY Chart
R2 146.19 - 24 June high - Medium
R1 145.27 - 26 June high - Medium
S1 143.00 - Figure - Medium
S2 142.68 - 1 July low - Medium
USDJPY: fundamental overview

A favorable trade deal could give the Bank of Japan more flexibility for a potential rate hike, but markets are skeptical about a significant increase soon, as BOJ Governor Ueda indicated at the ECB Sintra forum that Japan’s low policy rates will likely persist while inflation gradually rises. The prolonged 0.5% rate cap has led to doubts about policy normalization, weakening the yen against the dollar compared to other G10 currencies. Meanwhile, Japan faces pressure from looming U.S. tariffs under Trump, who is pushing for a trade deal by July 9 and threatening 30-35% tariffs, while Japan’s negotiator, Ryosei Akazawa, emphasizes protecting national interests ahead of a July 20 national vote.

 
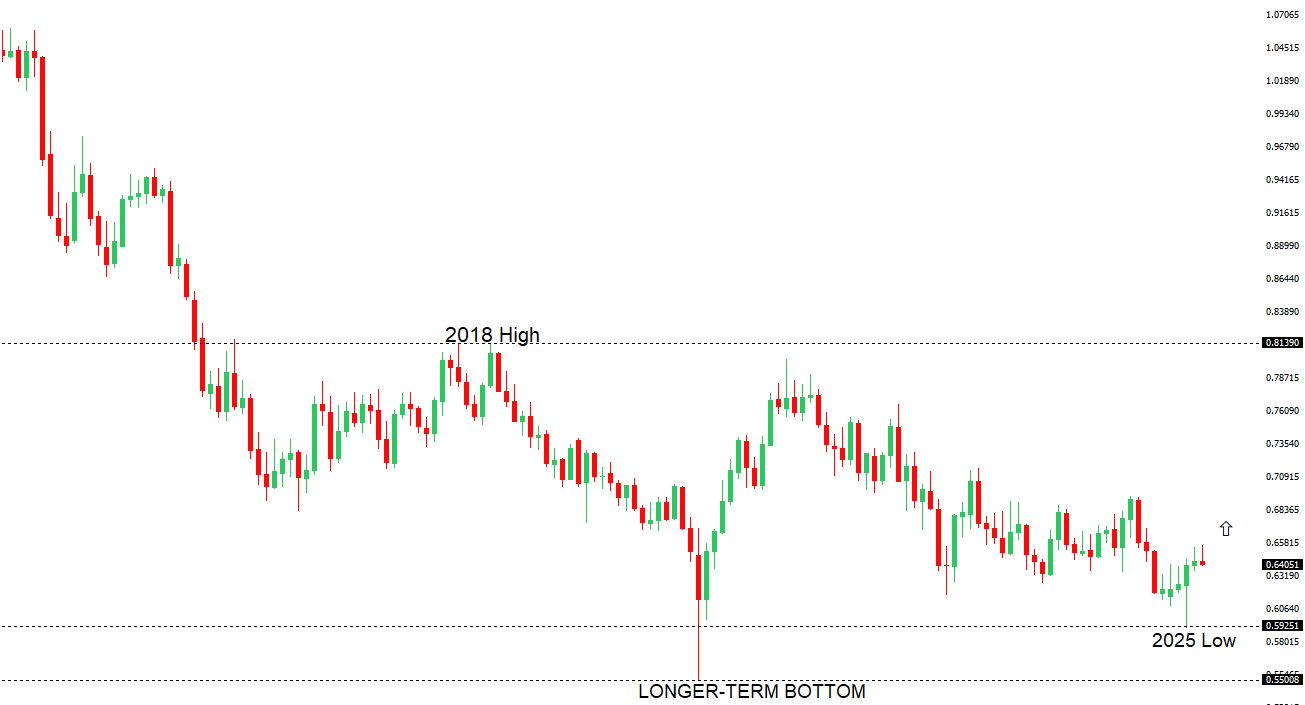
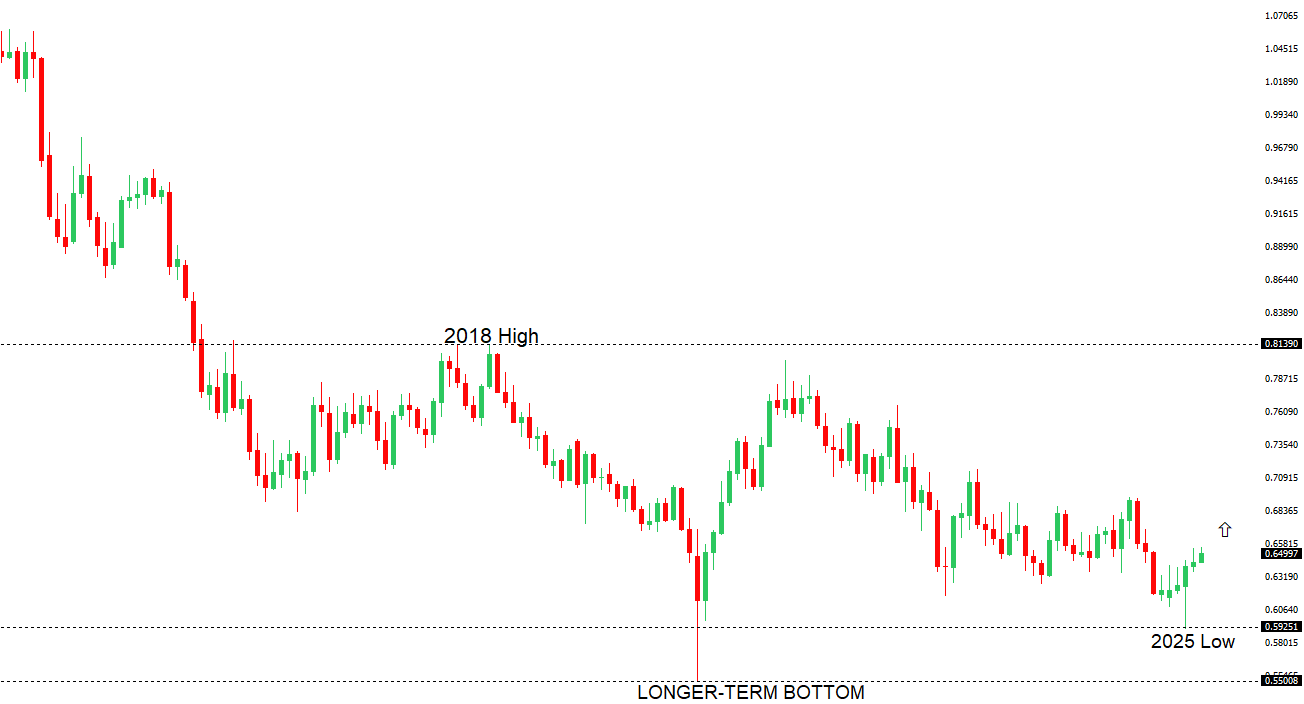
AUDUSD: technical overview

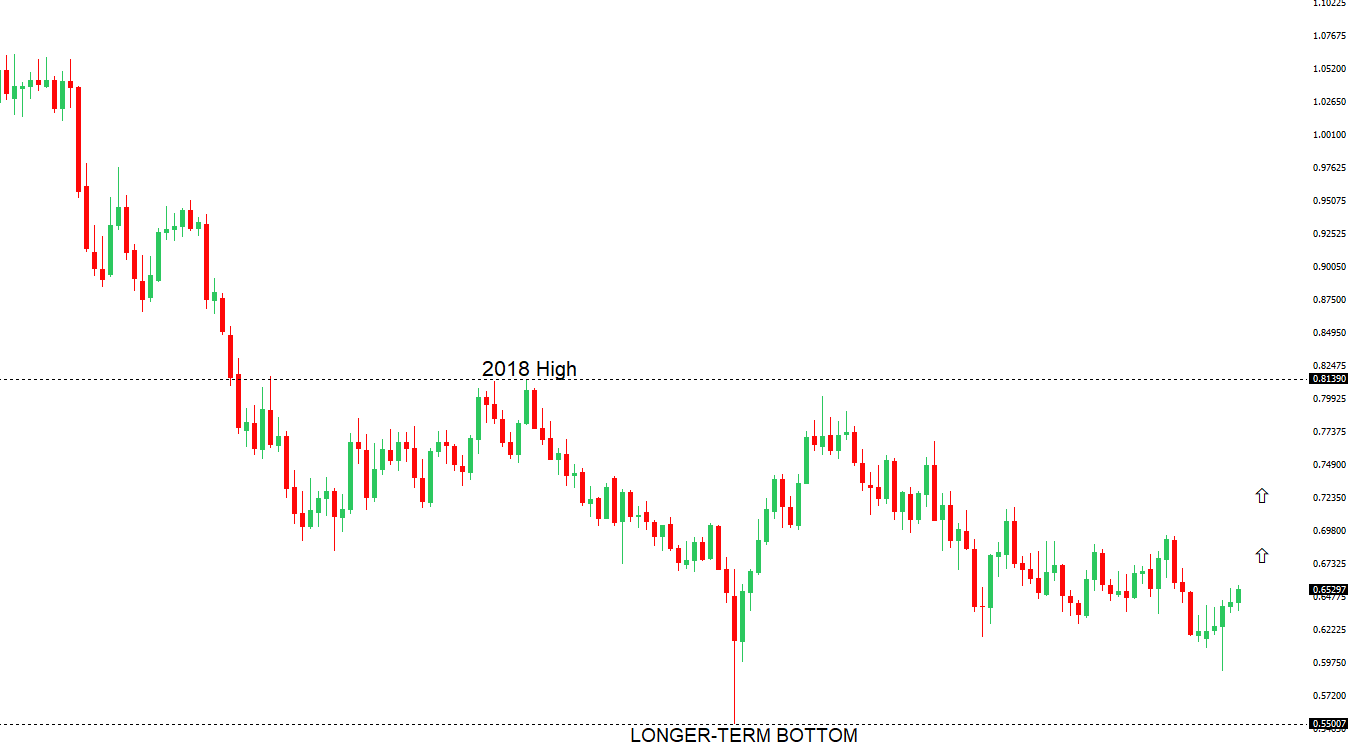
There are signs of the potential formation of a longer-term base with the market trading down into a meaningful longer-term support zone. Only a monthly close below 0.5500 would give reason for rethink. A monthly close back above 0.7000 will take the big picture pressure off the downside and strengthen case for a bottom.

AUDUSD Chart
R2 0.6600 - Medium - Strong
R1 0.6591 - 1 July/2025 high - Medium
S1 0.6484 - 25 June low - Medium
S1 0.6373 - 23 June low - Strong
AUDUSD: fundamental overview

Australia’s retail sales grew by just 0.2% month-on-month, below the expected 0.5%, signaling weaker economic momentum as consumers remain cautious despite earlier RBA rate cuts. Upcoming Household Spending data will be closely watched for further signs of reduced discretionary spending, with markets anticipating three more RBA rate cuts this year, potentially lowering the terminal rate to 2.85% or 3.10%. The Australian dollar holds steady, supported by optimism around improving US-China trade relations, easing Middle East tensions, and signs of recovery in China’s economy, Australia’s key trade partner. A potential US presidential visit to China with business leaders could further boost risk sentiment and support antipodean currencies.

 
Suggested reading

The Best, Most Contrarian Investment Right Now: China, J. Rimmer, MarketWat (July 1, 2025)

About That ‘Worst Start on Record’ for the Dollar, Fisher Investments (July 1, 2025)


Any opinions, news, research, analyses, prices or other information ("information") contained on this Blog, constitutes marketing communication and it has not been prepared in accordance with legal requirements designed to promote the independence of investment research. Further, the information contained within this Blog does not contain (and should not be construed as containing) investment advice or an investment recommendation, or an offer of, or solicitation for, a transaction in any financial instrument. LMAX Group has not verified the accuracy or basis-in-fact of any claim or statement made by any third parties as comments for every Blog entry.

LMAX Group will not accept liability for any loss or damage, including without limitation to, any loss of profit, which may arise directly or indirectly from use of or reliance on such information. No representation or warranty is given as to the accuracy or completeness of the above information. While the produced information was obtained from sources deemed to be reliable, LMAX Group does not provide any guarantees about the reliability of such sources. Consequently any person acting on it does so entirely at his or her own risk. It is not a place to slander, use unacceptable language or to promote LMAX Group or any other FX and CFD provider and any such postings, excessive or unjust comments and attacks will not be allowed and will be removed from the site immediately.

Day Image
2nd July 2025 | view in browser
Dollar steadies as Powell hints at rate cut delay

Strong economic data, including ISM prices paid and JOLTS job openings, briefly bolstered the U.S. dollar, along with comments from Federal Reserve Chair Jerome Powell who indicated uncertainty around the Trump administration’s trade and tariff policies was delaying a potential rate cut.


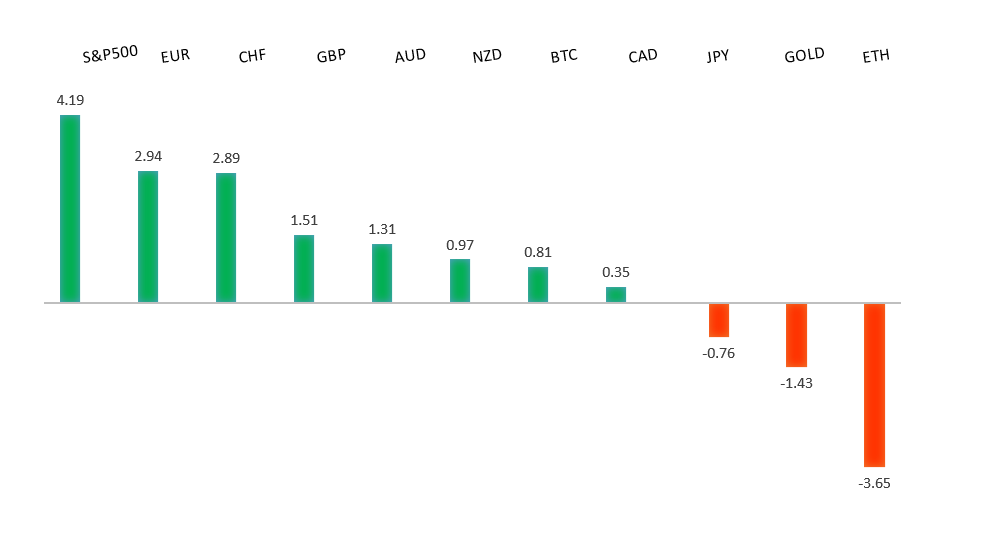
Performance chart 30day v. USD (%)
Performance Chart
 
 
Technical & fundamental highlights
EURUSD: technical overview

The Euro has finally broken out from a multi-month consolidation off a critical longer-term low. This latest push through the 2023 high lends further support to the case for a meaningful bottom, setting the stage for a bullish structural shift and the next major upside extension targeting the 2021 high at 1.2350. Setbacks should be exceptionally well supported below 1.1500.

EURUSD Chart
R2 1.1900 - Figure - Medium
R1 1.1830 - 1 July/2025 high - Medium
S1 1.1708 - 30 June low - Medium
S2 1.1654 - 26 June low - Medium
EURUSD: fundamental overview

Eurozone inflation rose to 2.0% in June, meeting the ECB’s target, while core inflation held steady at 2.3% and services inflation edged up to 3.3%, reflecting persistent price pressures. Despite Germany’s softer inflation, the ECB is likely to keep rates unchanged in July, with President Lagarde emphasizing vigilance due to risks like U.S. tariffs. A stronger euro, lower energy prices, and easing wage growth may pave the way for a rate cut later this year, contrasting with markets expecting more aggressive Fed cuts, boosting euro bullishness.

 
USDJPY: technical overview

There are signs of a meaningful top in place after the market put in a multi-year high in 2024. At this point, the door is now open for a deeper setback below the 2024 low at 139.58 over the coming weeks, exposing a retest of the 2023 low. Rallies should be well capped below 150.00.

USDJPY Chart
R2 146.19 - 24 June high - Medium
R1 145.27 - 26 June high - Medium
S1 143.00 - Figure - Medium
S2 142.68 - 1 July low - Medium
USDJPY: fundamental overview

Japan’s June Consumer Confidence Index rose to 34.5, surpassing expectations and marking a second month of gains, signaling a broadening economic recovery alongside positive manufacturing sentiment from the Tankan survey. Despite looming 25% auto tariffs, the weak yen at 144 supports Japan’s auto exports, while large firms plan an 11.5% capex increase, bolstering GDP growth. However, markets remain skeptical about a near-term Bank of Japan rate hike, and with Trump’s July 9 tariff deadline approaching, Japan faces pressure to secure a favorable trade deal amid threats of higher duties and tensions over U.S. rice exports, especially with a national vote on July 20.

 
AUDUSD: technical overview

There are signs of the potential formation of a longer-term base with the market trading down into a meaningful longer-term support zone. Only a monthly close below 0.5500 would give reason for rethink. A monthly close back above 0.7000 will take the big picture pressure off the downside and strengthen case for a bottom.

AUDUSD Chart
R2 0.6600 - Medium - Strong
R1 0.6591 - 1 July/2025 high - Medium
S1 0.6484 - 25 June low - Medium
S1 0.6373 - 23 June low - Strong
AUDUSD: fundamental overview

Australia’s retail sales and household spending data, due today and July 4, could confirm expectations for an RBA rate cut on July 8, with markets pricing in three additional cuts this year to a terminal rate of 3.10%, though some economists predict 2.85%. Despite this, the Australian dollar holds strong against the U.S. dollar, driven by expectations of the Fed’s easing cycle resuming and a positive market mood fueled by easing Middle East tensions and optimism for new U.S. and global trade deals.

 
Suggested reading

How Denmark learned to love a plant-based diet, S. Savage, Financial Times (July 1, 2025)

How Uncertainty Rules Everything Around Me, J. Calhoun, Alhambra Investments (June 29, 2025)


Any opinions, news, research, analyses, prices or other information ("information") contained on this Blog, constitutes marketing communication and it has not been prepared in accordance with legal requirements designed to promote the independence of investment research. Further, the information contained within this Blog does not contain (and should not be construed as containing) investment advice or an investment recommendation, or an offer of, or solicitation for, a transaction in any financial instrument. LMAX Group has not verified the accuracy or basis-in-fact of any claim or statement made by any third parties as comments for every Blog entry.

LMAX Group will not accept liability for any loss or damage, including without limitation to, any loss of profit, which may arise directly or indirectly from use of or reliance on such information. No representation or warranty is given as to the accuracy or completeness of the above information. While the produced information was obtained from sources deemed to be reliable, LMAX Group does not provide any guarantees about the reliability of such sources. Consequently any person acting on it does so entirely at his or her own risk. It is not a place to slander, use unacceptable language or to promote LMAX Group or any other FX and CFD provider and any such postings, excessive or unjust comments and attacks will not be allowed and will be removed from the site immediately.

Day Image
1st July 2025 | view in browser
The US Dollar’s structural challenges

Despite U.S. interest rates exceeding those of most G10 peers and the dollar being considered oversold, it’s struggling to gain traction. Federal Reserve Chair Powell’s reluctance to cut rates is delaying what could be an even sharper decline.


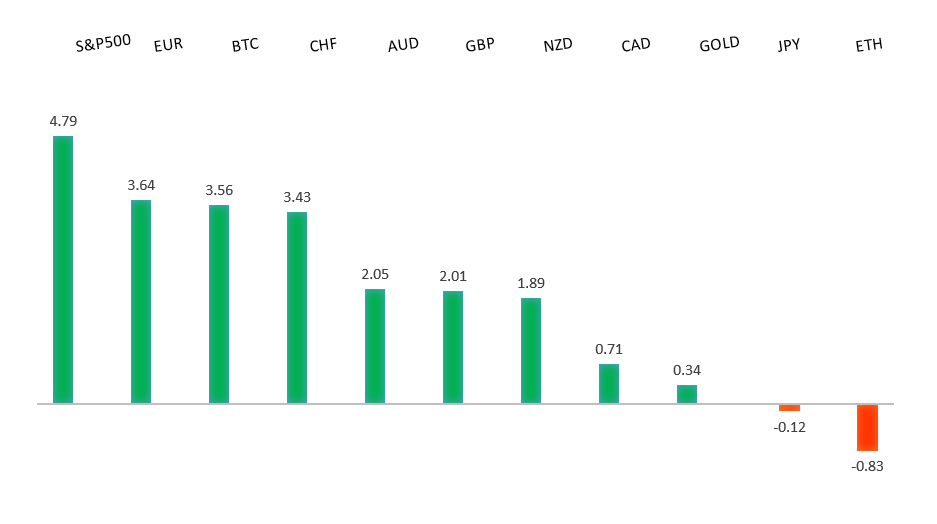
Performance chart 30day v. USD (%)
Performance Chart
 
 
Technical & fundamental highlights
EURUSD: technical overview

The Euro has finally broken out from a multi-month consolidation off a critical longer-term low. This latest push through the 2023 high lends further support to the case for a meaningful bottom, setting the stage for a bullish structural shift and the next major upside extension targeting the 2021 high at 1.2350. Setbacks should be exceptionally well supported below 1.1500.

EURUSD Chart
R2 1.1900 - Figure - Medium
R1 1.1795 - 1 July/2025 high - Medium
S1 1.1708 - 30 June low - Medium
S2 1.1654 - 26 June low - Medium
EURUSD: fundamental overview

The European Central Bank has introduced a robust strategy to tackle significant inflation swings, aiming to keep inflation near its 2% target and prevent public expectations of persistent price changes, which could trigger wage and price hikes. This approach responds to uncertainties from geopolitical issues, AI growth, demographic shifts, and environmental challenges. Meanwhile, a major bank strategist predicts a U.S. interest rate cut could weaken the dollar, pushing EURUSD toward 1.20 as investors hedge against dollar weakness. On trade, EU official Antonio Costa suggests NATO’s 5% defense spending deal, favoring U.S. arms purchases, could facilitate a U.S.-EU trade agreement, though France prefers boosting European industries. The EU is open to a U.S. trade deal with a 10% tariff on exports but seeks lower tariffs on key sectors like pharmaceuticals and automobiles, aiming for an interim agreement by July 9 to extend talks.

 
USDJPY: technical overview

There are signs of a meaningful top in place after the market put in a multi-year high in 2024. At this point, the door is now open for a deeper setback below the 2024 low at 139.58 over the coming weeks, exposing a retest of the 2023 low. Rallies should be well capped below 150.00.

USDJPY Chart
R2 146.19 - 24 June high - Medium
R1 145.27 - 26 June high - Medium
S1 143.00 - Figure - Medium
S2 142.79 - 13 June low - Medium
USDJPY: fundamental overview

Japan’s trade talks with the U.S. last Friday yielded no major progress, with both sides restating their positions on U.S. tariffs but committing to further negotiations, as Japan’s negotiator Akazawa extended his U.S. visit. Trump highlighted the U.S.-Japan trade imbalance, particularly in autos, suggesting Japan import more U.S. goods like oil to address it, with the 25% auto tariff remaining a key issue. Despite tariff concerns, Japan’s weak yen supports auto exporters, and strong Q2 Tankan data—large manufacturing index and robust capital expenditure plans—signals economic resilience, potentially easing pressure on the Bank of Japan for stimulus. However, markets remain skeptical about a full BOJ rate hike soon, and small firms show weaker sentiment, facing cost and competitive pressures, while the yen strengthens amid expectations of U.S. Federal Reserve rate cuts.

 
AUDUSD: technical overview

There are signs of the potential formation of a longer-term base with the market trading down into a meaningful longer-term support zone. Only a monthly close below 0.5500 would give reason for rethink. A monthly close back above 0.7000 will take the big picture pressure off the downside and strengthen case for a bottom.

AUDUSD Chart
R2 0.6600 - Medium - Strong
R1 0.6584 - 1 July/2025 high - Medium
S1 0.6484 - 25 June low - Medium
S1 0.6373 - 23 June low - Strong
AUDUSD: fundamental overview

Australia’s commodity export earnings dropped 7% to A$385 billion in the year to June, driven by weak iron ore and natural gas prices despite high gold prices, with further declines expected over the next two years due to trade barriers and slowing global growth, according to a government report. May inflation fell to 2.1%, below the expected 2.3%, with trimmed mean CPI at 2.4%, prompting economists to predict an earlier Reserve Bank of Australia rate cut, possibly at the July 8 meeting, with markets pricing three cuts to a 3.10% terminal rate, some forecasting 2.85%. Despite this, the Australian dollar is strengthening against the U.S. dollar, boosted by anticipated U.S. Federal Reserve easing, easing Middle East tensions, optimism for global trade deals, and signs of recovery in China, Australia’s key trade partner.

 
Suggested reading

With the S&P Back to Even, Notes On a Round Trip, Fisher Investments (June 27, 2025)

If Fed Cuts Fuel Inflation, Then Powell Has Nothing To Fear, J. Tamny, Forbes (June 29, 2025)


Any opinions, news, research, analyses, prices or other information ("information") contained on this Blog, constitutes marketing communication and it has not been prepared in accordance with legal requirements designed to promote the independence of investment research. Further, the information contained within this Blog does not contain (and should not be construed as containing) investment advice or an investment recommendation, or an offer of, or solicitation for, a transaction in any financial instrument. LMAX Group has not verified the accuracy or basis-in-fact of any claim or statement made by any third parties as comments for every Blog entry.

LMAX Group will not accept liability for any loss or damage, including without limitation to, any loss of profit, which may arise directly or indirectly from use of or reliance on such information. No representation or warranty is given as to the accuracy or completeness of the above information. While the produced information was obtained from sources deemed to be reliable, LMAX Group does not provide any guarantees about the reliability of such sources. Consequently any person acting on it does so entirely at his or her own risk. It is not a place to slander, use unacceptable language or to promote LMAX Group or any other FX and CFD provider and any such postings, excessive or unjust comments and attacks will not be allowed and will be removed from the site immediately.

Day Image
29th June 2025 | view in browser
Trump’s trade moves shake markets

The U.S. dollar stabilized into last week’s close, as Treasury yields paused and the S&P 500 hit new year-to-date highs, with markets encouraged by progress in trade deals with the UK, China, and potentially India, alongside possible extensions to the July 9 tariff deadline.


Performance chart 30day v. USD (%)
Performance Chart
 
 
Technical & fundamental highlights
EURUSD: technical overview

The Euro has finally broken out from a multi-month consolidation off a critical longer-term low. This latest push through the 2023 high lends further support to the case for a meaningful bottom, setting the stage for a bullish structural shift and the next major upside extension targeting the 2021 high at 1.2350. Setbacks should be exceptionally well supported below 1.1000.

EURUSD Chart
R2 1.1800 - Figure - Medium
R1 1.1755 - 27 June/2025 high - Medium
S1 1.1573 - 24 June low - Medium
S2 1.1446 - 19 June low - Strong
EURUSD: fundamental overview

The dollar’s ongoing bear market is expected to drive the euro higher, with one major bank predicting it could reach 1.20 to 1.23 by year-end, fueled by faster U.S. interest rate declines compared to other G10 nations. At the ECB’s Sintra forum from June 30 to July 2, central bankers will discuss monetary policy adjustments amid uncertainties tied to Trump’s policies. French Finance Minister Eric Lombard expressed optimism about securing a trade deal with the U.S. before July 9, potentially involving increased European purchases of American LNG. Meanwhile, Ukraine faces escalating Russian missile and drone attacks, with Russia pushing territorial demands and proposing further talks in Istanbul.

 
USDJPY: technical overview

There are signs of a meaningful top in place after the market put in a multi-year high in 2024. At this point, the door is now open for a deeper setback below the 2024 low at 139.58 over the coming weeks, exposing a retest of the 2023 low. Rallies should be well capped below 150.00.

USDJPY Chart
R2 148.65 - 12 May high - Medium
R1 148.03 - 23 June high - Medium
S1 144.32 - 18 June low - Medium
S2 142.79 - 13 June low - Medium
USDJPY: fundamental overview

Japan’s Chief Trade Negotiator Akazawa and US Commerce Secretary Lutnick met last Friday but made no significant progress, reaffirming their positions on US tariffs while committing to further talks, with Akazawa extending his US visit. Markets are focused on the upcoming BOJ Tankan Survey, expected to show softened business sentiment due to US 25% tariffs on autos and steel, high food prices, and modest capital expenditure growth for large firms, with potential Yen and Nikkei gains if results exceed expectations. Recent data revealed weaker-than-expected industrial production for May, signaling a fragile economic recovery and ongoing challenges from trade tensions and weak demand, which may keep the BOJ cautious about tightening policy.

 
AUDUSD: technical overview

There are signs of the potential formation of a longer-term base with the market trading down into a meaningful longer-term support zone. Only a monthly close below 0.5500 would give reason for rethink. A monthly close back above 0.7000 will take the big picture pressure off the downside and strengthen case for a bottom.

AUDUSD Chart
R2 0.6600 - Medium - Strong
R1 0.6564 - 26 June/2025 high - Medium
S1 0.6373 - 23 June low - Medium
S1 0.6344 - 24 April low - Strong
AUDUSD: fundamental overview

Australia’s commodity export earnings dropped 7% to A$385 billion due to weak iron ore and natural gas prices, despite high gold prices, with further declines expected over the next two years due to trade barriers and slowing global growth. Inflation in May fell to 2.1%, below expectations, prompting economists to predict an earlier Reserve Bank of Australia rate cut in July, with markets anticipating three cuts this year to a terminal rate of around 2.85%-3.10%. The Australian dollar is strengthening against the US dollar, supported by expectations of US Federal Reserve easing, reduced Middle East tensions, and a new US-China trade deal boosting risk currencies. Key upcoming data includes June inflation and May private sector credit figures.

 
Suggested reading

$40 Oil Isn’t Happening , P. Domm, Barrons (June 26, 2025)

Passive Investing Is Fueling the Rise of Mega-Firms, L. Swedroe, Morningstar (June 26, 2025)


Any opinions, news, research, analyses, prices or other information ("information") contained on this Blog, constitutes marketing communication and it has not been prepared in accordance with legal requirements designed to promote the independence of investment research. Further, the information contained within this Blog does not contain (and should not be construed as containing) investment advice or an investment recommendation, or an offer of, or solicitation for, a transaction in any financial instrument. LMAX Group has not verified the accuracy or basis-in-fact of any claim or statement made by any third parties as comments for every Blog entry.

LMAX Group will not accept liability for any loss or damage, including without limitation to, any loss of profit, which may arise directly or indirectly from use of or reliance on such information. No representation or warranty is given as to the accuracy or completeness of the above information. While the produced information was obtained from sources deemed to be reliable, LMAX Group does not provide any guarantees about the reliability of such sources. Consequently any person acting on it does so entirely at his or her own risk. It is not a place to slander, use unacceptable language or to promote LMAX Group or any other FX and CFD provider and any such postings, excessive or unjust comments and attacks will not be allowed and will be removed from the site immediately.

Day Image
26th June 2025 | view in browser
Euro extends to another yearly high

Reports from the Wall Street Journal have opened more downside pressure on the Buck, while fueling fresh 2025 highs in currencies like the Euro and Pound. These reports say President Trump is frustrated with the Federal Reserve’s slow approach to cutting interest rates.


Performance chart 30day v. USD (%)
Performance Chart
 
 
Technical & fundamental highlights
EURUSD: technical overview

The Euro has finally broken out from a multi-month consolidation off a critical longer-term low. This latest push through the 2023 high lends further support to the case for a meaningful bottom, setting the stage for a bullish structural shift and the next major upside extension targeting the 2021 high at 1.2350. Setbacks should be exceptionally well supported below 1.1000.

EURUSD Chart
R2 1.1718 - 26 June/2025 high - Medium
R1 1.1700 - Figure - Medium
S1 1.1573 - 24 June low - Medium
S2 1.1446 - 19 June low - Strong
EURUSD: fundamental overview

The euro has surpassed the key 1.17 level, with bank strategists forecasting a rise to 1.20 or even 1.23 by year-end, driven by faster U.S. interest rate declines compared to other G10 nations. NATO leaders have agreed to increase defense spending to 5% of GDP by 2035, a historic shift from 2%, prompted by Russian threats, with Germany aiming to lead Europe’s military buildup. This deal, a win for both President Trump and European leaders, signals greater European unity and strategic autonomy, potentially boosting the euro’s value and reserve currency status, though concerns remain about crowding out private investment and rising public debt. Germany’s Gfk Consumer Confidence Index is expected to improve slightly to -19.2 in July from -19.9, reflecting fragile economic optimism that could be disrupted by trade or geopolitical tensions.

 
USDJPY: technical overview

There are signs of a meaningful top in place after the market put in a multi-year high in 2024. At this point, the door is now open for a deeper setback below the 2024 low at 139.58 over the coming weeks, exposing a retest of the 2023 low. Rallies should be well capped below 150.00.

USDJPY Chart
R2 148.65 - 12 May high - Medium
R1 148.03 - 23 June high - Medium
S1 144.32 - 18 June low - Medium
S2 142.79 - 13 June low - Medium
USDJPY: fundamental overview

Bank of Japan Board member Naoki Tamura indicated that the central bank might need to raise interest rates decisively if inflation risks increase, potentially achieving price stability sooner than anticipated due to stronger-than-expected inflation data. Despite these risks, the BOJ plans to maintain its current monetary policy due to economic uncertainties, including U.S. tariffs and Middle East tensions. Tamura noted a low but non-zero chance of a rate hike during ongoing U.S.-Japan trade talks, which focus on U.S. tariffs on Japanese automobiles, with Japan emphasizing its significant investments and job creation in the U.S. A favorable trade deal could strengthen the Yen and support BOJ’s policy normalization, while upcoming data, including a steady 2.5% jobless rate and a slightly softer Tokyo CPI of 3.3%, reflects a tight labor market and persistent inflationary pressures, keeping the BOJ on track for monetary normalization.

 
AUDUSD: technical overview

There are signs of the potential formation of a longer-term base with the market trading down into a meaningful longer-term support zone. Only a monthly close below 0.5500 would give reason for rethink. A monthly close back above 0.7000 will take the big picture pressure off the downside and strengthen case for a bottom.

AUDUSD Chart
R2 0.6553 - 16 June/2025 high - Strong
R1 0.6537 - 26 June high - Medium
S1 0.6373 - 23 June low - Medium
S1 0.6344 - 24 April low - Strong
AUDUSD: fundamental overview

Australia’s economy is projected to grow by 1.7% in 2025, 2.3% in 2026, and 2.5% in 2027, according to a Bloomberg survey of economists. Inflation is expected to remain steady at 2.5% in 2025 and 2.7% in 2026, with May 2025 inflation at 2.1%, below the consensus of 2.3%. The Reserve Bank of Australia’s interest rate is forecasted to reach 3.60% by Q3 2025, and upcoming retail sales and household spending data could influence a potential rate cut at the RBA’s July 8 meeting. Job vacancies rose 2.9% in the three months to May 2025, a significant improvement from the prior quarter’s -4.3%, though they remain 28.5% below their May 2022 peak, signaling cautious optimism in the labor market.

 
Suggested reading

The Stock Market’s Irrational Exuberance, D. Lachman, AEIdeas (June 23, 2025)

Being Human Means Being a Bad Investor, J. Wiggins, Behavioral Investment (June 24, 2025)


Any opinions, news, research, analyses, prices or other information ("information") contained on this Blog, constitutes marketing communication and it has not been prepared in accordance with legal requirements designed to promote the independence of investment research. Further, the information contained within this Blog does not contain (and should not be construed as containing) investment advice or an investment recommendation, or an offer of, or solicitation for, a transaction in any financial instrument. LMAX Group has not verified the accuracy or basis-in-fact of any claim or statement made by any third parties as comments for every Blog entry.

LMAX Group will not accept liability for any loss or damage, including without limitation to, any loss of profit, which may arise directly or indirectly from use of or reliance on such information. No representation or warranty is given as to the accuracy or completeness of the above information. While the produced information was obtained from sources deemed to be reliable, LMAX Group does not provide any guarantees about the reliability of such sources. Consequently any person acting on it does so entirely at his or her own risk. It is not a place to slander, use unacceptable language or to promote LMAX Group or any other FX and CFD provider and any such postings, excessive or unjust comments and attacks will not be allowed and will be removed from the site immediately.

Day Image
25th June 2025 | view in browser
Ceasefire holds, Fed rate cuts in focus

The Israel-Iran ceasefire continues to hold, easing geopolitical tensions, while markets focus on rising odds of Fed rate cuts by July, with Fed Chair Powell’s testimony today at 2:00 PM GMT expected to provide further clarity.


Performance chart 30day v. USD (%)
Performance Chart
 
 
Technical & fundamental highlights
EURUSD: technical overview

The Euro has finally broken out from a multi-month consolidation off a critical longer-term low. This latest push through the 2023 high lends further support to the case for a meaningful bottom, setting the stage for a bullish structural shift and the next major upside extension targeting the 2021 high at 1.2350. Setbacks should be exceptionally well supported below 1.1000.

EURUSD Chart
R2 1.1693 - 28 October 2024 high - Strong
R1 1.1642 - 24 June/2025 high - Medium
S1 1.1446 - 19 June low - Medium
S2 1.1373 - 10 June low - Medium
EURUSD: fundamental overview

A recent OMFIF report forecasts that 16% of central banks will increase euro holdings in the next 12-24 months, potentially raising the euro’s global reserve share to 25% by decade’s end, driven by EU bond market expansion and rising demand in cross-currency swaps, which could make borrowing in euros costlier than dollars. Dovish Fed signals from Waller and Bowman, alongside weak U.S. data, boost expectations for 2025 rate cuts, while the ECB nears the end of its easing cycle with inflation near 2%, supporting EURUSD strength. Germany’s plan to borrow €118.5 billion in 2025 for public and military spending signals sustained fiscal stimulus, further bolstering the euro. Upcoming German Gfk Consumer Confidence data, expected to rise to -19.2, reflects cautious optimism but remains sensitive to geopolitical or economic shocks.

 
USDJPY: technical overview

There are signs of a meaningful top in place after the market put in a multi-year high in 2024. At this point, the door is now open for a deeper setback below the 2024 low at 139.58 over the coming weeks, exposing a retest of the 2023 low. Rallies should be well capped below 150.00.

USDJPY Chart
R2 148.65 - 12 May high - Medium
R1 148.03 - 23 June high - Medium
S1 144.32 - 18 June low - Medium
S2 142.79 - 13 June low - Medium
USDJPY: fundamental overview

The Yen is recovering as oil prices ease following a ceasefire between Israel and Iran, reducing pressure on Japan’s energy-dependent economy after U.S. strikes on Iranian nuclear sites had driven oil higher. Dovish comments from Fed officials Waller and Bowman, hinting at a possible July rate cut, have weakened the USDJPY pair, while Japan’s tariff negotiator prepares for U.S. talks on June 26, aiming to secure a favorable trade deal to support BOJ rate hike expectations. BOJ’s Tamura advocates for decisive rate hikes if inflation risks rise, with Tokyo’s June CPI data on June 26 potentially adding pressure for action, as May’s PPI Services at 3.3% signals persistent domestic inflation. Declining department store sales (-7.0% YoY nationwide, -9.1% in Tokyo) highlight retail challenges, but markets expect tariff uncertainties to stabilize as Trump focuses on economic stimulus, potentially extending tariff deadlines.

 
AUDUSD: technical overview

There are signs of the potential formation of a longer-term base with the market trading down into a meaningful longer-term support zone. Only a monthly close below 0.5500 would give reason for rethink. A monthly close back above 0.7000 will take the big picture pressure off the downside and strengthen case for a bottom.

AUDUSD Chart
R2 0.6553 - 16 June/2025 high - Strong
R1 0.6500 - Psychological - Medium
S1 0.6373 - 23 June low - Medium
S1 0.6344 - 24 April low - Strong
AUDUSD: fundamental overview

The Australian dollar is regaining ground, tracking the Chinese yuan’s strength (fixed at 7.1656, its highest since November), as Trump’s Israel-Iran ceasefire reduces the dollar’s geopolitical risk premium. Australia’s May CPI fell to 2.1%, below the expected 2.3%, with trimmed mean CPI dropping to 2.4% from 2.8%, signaling easing inflation pressures and increasing the likelihood of an RBA rate cut on July 8. Markets now await early July retail sales and household spending data, where weak figures could confirm the case for monetary easing.

 
Suggested reading

The fight to save Filipino chocolate, B. Harani, Financial Times (June 25, 2025)

More Than Trump Grasps, the Fed Is Irrelevant, J. Calhoun, Alhambra (June 22, 2025)


Any opinions, news, research, analyses, prices or other information ("information") contained on this Blog, constitutes marketing communication and it has not been prepared in accordance with legal requirements designed to promote the independence of investment research. Further, the information contained within this Blog does not contain (and should not be construed as containing) investment advice or an investment recommendation, or an offer of, or solicitation for, a transaction in any financial instrument. LMAX Group has not verified the accuracy or basis-in-fact of any claim or statement made by any third parties as comments for every Blog entry.

LMAX Group will not accept liability for any loss or damage, including without limitation to, any loss of profit, which may arise directly or indirectly from use of or reliance on such information. No representation or warranty is given as to the accuracy or completeness of the above information. While the produced information was obtained from sources deemed to be reliable, LMAX Group does not provide any guarantees about the reliability of such sources. Consequently any person acting on it does so entirely at his or her own risk. It is not a place to slander, use unacceptable language or to promote LMAX Group or any other FX and CFD provider and any such postings, excessive or unjust comments and attacks will not be allowed and will be removed from the site immediately.

Day Image
24th June 2025 | view in browser
Ceasefire hope fuels uptick in risk appetite

President Trump announced a ceasefire between Israel and Iran on social media, though Iran’s Foreign Minister denied a formal agreement, stating attacks would stop if Israel ceased aggression by 4 am Tehran time.


Performance chart 30day v. USD (%)
Performance Chart
 
 
Technical & fundamental highlights
EURUSD: technical overview

The Euro has finally broken out from a multi-month consolidation off a critical longer-term low. This latest push through the 2023 high lends further support to the case for a meaningful bottom, setting the stage for a bullish structural shift and the next major upside extension targeting the 2021 high at 1.2350. Setbacks should be exceptionally well supported below 1.1000.

EURUSD Chart
R2 1.1632 - 12 June/2025 high - Strong
R1 1.1600 - Figure - Medium
S1 1.1373 - 10 June low - Medium
S2 1.1210 - 29 May low - Strong
EURUSD: fundamental overview

Recent weak US economic data and dovish comments from Federal Reserve officials have increased expectations for US rate cuts in late 2025, while the ECB, after eight rate reductions, suggests its easing cycle may slow as euro-area inflation nears 2% and unemployment stays low. ECB President Christine Lagarde emphasized a flexible, data-driven approach to policy amid high uncertainty, noting that a weaker dollar due to US policies could bolster the euro. Germany’s June IFO Business Climate index, expected to rise slightly to 88.0, may signal a gradual economic recovery, though businesses remain cautious, and any setback could heighten calls for more policy support.

 
USDJPY: technical overview

There are signs of a meaningful top in place after the market put in a multi-year high in 2024. At this point, the door is now open for a deeper setback below the 2024 low at 139.58 over the coming weeks, exposing a retest of the 2023 low. Rallies should be well capped below 150.00.

USDJPY Chart
R2 148.65 - 12 May high - Medium
R1 148.03 - 23 June high - Medium
S1 144.32 - 18 June low - Medium
S2 142.79 - 13 June low - Medium
USDJPY: fundamental overview

Rising oil prices, triggered by U.S. strikes on Iranian nuclear sites, have hit Japan’s economy hard, as the country relies heavily on Middle Eastern energy imports, dampening expectations for Bank of Japan rate hikes. For the yen to rebound, Japan needs a favorable U.S.-Japan trade deal and a significant drop in oil prices, which already seems like it’s happening with reports of Iran agreeing to a U.S.-proposed ceasefire. Japan’s tariff negotiator, Ryosei Akazawa, is set to visit the U.S. on June 26 to discuss tariffs on Japanese automobiles, potentially boosting yen optimism. Meanwhile, a recent 20-year Japanese Government Bond auction showed solid demand with a bid-to-cover ratio of 3.11, though market concerns linger about upcoming longer-term bond sales due to the Ministry of Finance’s plans to cut debt issuance.

 
AUDUSD: technical overview

There are signs of the potential formation of a longer-term base with the market trading down into a meaningful longer-term support zone. Only a monthly close below 0.5500 would give reason for rethink. A monthly close back above 0.7000 will take the big picture pressure off the downside and strengthen case for a bottom.

AUDUSD Chart
R2 0.6553 - 16 June/2025 high - Strong
R1 0.6500 - Psychological - Medium
S1 0.6373 - 23 June low - Medium
S1 0.6344 - 24 April low - Strong
AUDUSD: fundamental overview

Iran’s missile attack on a Qatar airbase was intercepted, with no casualties, prompting Trump to thank Iran for the early warning and urge both Iran and Israel toward peace, signaling potential de-escalation. If the Israel-Iran conflict remains contained or shifts to diplomacy, markets may refocus on trade uncertainties, U.S. fiscal concerns, and capital rotation, likely resuming the dollar’s downtrend and supporting antipodean currencies like the Australian dollar. Australia’s May CPI is expected to ease to 2.3% from 2.4%, within the RBA’s 2-3% target, influencing the July rate decision with an 84% chance of a rate cut, though some economists suggest the RBA can remain patient due to low unemployment and inflation within target.

 
Suggested reading

No, Yet Again, Federal Reserve Did Not Cause the Depression, J. Tamny, Forbes (June 22, 2025)

As He Prepares To Step Down, Buffett Leaves a Great Legacy, A. Bary, Barron’s (June 20, 2025)


Any opinions, news, research, analyses, prices or other information ("information") contained on this Blog, constitutes marketing communication and it has not been prepared in accordance with legal requirements designed to promote the independence of investment research. Further, the information contained within this Blog does not contain (and should not be construed as containing) investment advice or an investment recommendation, or an offer of, or solicitation for, a transaction in any financial instrument. LMAX Group has not verified the accuracy or basis-in-fact of any claim or statement made by any third parties as comments for every Blog entry.

LMAX Group will not accept liability for any loss or damage, including without limitation to, any loss of profit, which may arise directly or indirectly from use of or reliance on such information. No representation or warranty is given as to the accuracy or completeness of the above information. While the produced information was obtained from sources deemed to be reliable, LMAX Group does not provide any guarantees about the reliability of such sources. Consequently any person acting on it does so entirely at his or her own risk. It is not a place to slander, use unacceptable language or to promote LMAX Group or any other FX and CFD provider and any such postings, excessive or unjust comments and attacks will not be allowed and will be removed from the site immediately.

Day Image
23rd June 2025 | view in browser
Dollar holds firm amid geopolitical risks

Last week’s soft U.S. economic data, including a weaker-than-expected Philadelphia Fed Business Outlook and a negative Leading Index print, has fueled speculation about Federal Reserve policy, with Governor Waller advocating for proactive rate cuts despite a cautious committee.


Performance chart 30day v. USD (%)
Performance Chart
 
 
Technical & fundamental highlights
EURUSD: technical overview

The Euro has finally broken out from a multi-month consolidation off a critical longer-term low. This latest push through the 2023 high lends further support to the case for a meaningful bottom, setting the stage for a bullish structural shift and the next major upside extension targeting the 2021 high at 1.2350. Setbacks should be exceptionally well supported below 1.1000.

EURUSD Chart
R2 1.1632 - 12 June/2025 high - Strong
R1 1.1600 - Figure - Medium
S1 1.1373 - 10 June low - Medium
S2 1.1210 - 29 May low - Strong
EURUSD: fundamental overview

Weak U.S. economic data has raised expectations for Federal Reserve cuts rates later this year, while the ECB, after eight rate reductions, may pause as inflation nears 2% and unemployment stays low. The ECB’s July meeting is likely to maintain current rates, with its latest bulletin forecasting steady euro area GDP growth (0.9% in 2025) and inflation at 2% in 2025, though trade tensions and a stronger euro pose risks. In Germany, manufacturing PMI shows signs of stabilization despite ongoing contraction, while a sharp drop in services PMI (47.1 in May) threatens near-term growth.

 
USDJPY: technical overview

There are signs of a meaningful top in place after the market put in a multi-year high in 2024. At this point, the door is now open for a deeper setback below the 2024 low at 139.58 over the coming weeks, exposing a retest of the 2023 low. Rallies should be well capped below 150.00.

USDJPY Chart
R2 148.65 - 12 May high - Medium
R1 147.67 - 14 May high - Medium
S1 144.32 - 18 June low - Medium
S2 142.11 - 27 May low - Strong
USDJPY: fundamental overview

Recent weak US economic data have increased expectations for two Federal Reserve rate cuts in late 2025, but the yen struggles to gain traction as doubts persist about the Bank of Japan’s ability to tighten policy. The BOJ’s cautious approach to reducing Japanese Government Bond purchases, coupled with weak demand for long-term bonds, has led Japan’s Ministry of Finance to cut issuance of 20-, 30-, and 40-year bonds. Geopolitical tensions and uncertainty over US-Japan trade talks, with a July 9, 2025, tariff deadline approaching, further pressure the yen and complicate BOJ policy. However, Japan’s June PMI data shows improvement, with manufacturing returning to growth (50.4) and services expanding (51.5), signaling economic stabilization, though the recovery remains fragile and BOJ rate hike expectations are low without a favorable trade deal resolution.

 
AUDUSD: technical overview

There are signs of the potential formation of a longer-term base with the market trading down into a meaningful longer-term support zone. Only a monthly close below 0.5500 would give reason for rethink. A monthly close back above 0.7000 will take the big picture pressure off the downside and strengthen case for a bottom.

AUDUSD Chart
R2 0.6553 - 16 June/2025 high - Strong
R1 0.6500 - Psychological - Medium
S1 0.6387 - 16 May low - Medium
S1 0.6344 - 24 April low - Strong
AUDUSD: fundamental overview

Australia’s June 2025 preliminary PMI data shows modest economic expansion, with the Composite PMI at 51.2 (up from 50.5), Manufacturing PMI steady at 51.0, and Services PMI at 51.3 (up from 50.6). Following the RBA’s rate cuts in May 2025, these figures suggest a positive but cautious economic response, supporting the RBA’s gradual monetary easing approach. The RBA will consider these PMIs and upcoming inflation data at its next meeting to decide on further rate adjustments, with markets expecting three more cuts in 2025, potentially lowering the cash rate to 3.10%.

 
Suggested reading

Tariffs Will Not Repeal The Laws Of Economics, H. Marks, Oaktree (June 18, 2025)

China’s Industrial Policy Has An Unprofitability Problem, N. Smith, Noahopinion (June 20, 2025)


Any opinions, news, research, analyses, prices or other information ("information") contained on this Blog, constitutes marketing communication and it has not been prepared in accordance with legal requirements designed to promote the independence of investment research. Further, the information contained within this Blog does not contain (and should not be construed as containing) investment advice or an investment recommendation, or an offer of, or solicitation for, a transaction in any financial instrument. LMAX Group has not verified the accuracy or basis-in-fact of any claim or statement made by any third parties as comments for every Blog entry.

LMAX Group will not accept liability for any loss or damage, including without limitation to, any loss of profit, which may arise directly or indirectly from use of or reliance on such information. No representation or warranty is given as to the accuracy or completeness of the above information. While the produced information was obtained from sources deemed to be reliable, LMAX Group does not provide any guarantees about the reliability of such sources. Consequently any person acting on it does so entirely at his or her own risk. It is not a place to slander, use unacceptable language or to promote LMAX Group or any other FX and CFD provider and any such postings, excessive or unjust comments and attacks will not be allowed and will be removed from the site immediately.

Day Image
20th June 2025 | view in browser
Geopolitical uncertainty keeps investors cautious

The Dollar Index hit a weekly high on Thursday amid escalating tensions in the Israel-Iran conflict, with the White House indicating President Trump will decide within two weeks on potential U.S. involvement.


Performance chart 30day v. USD (%)
Performance Chart
 
 
Technical & fundamental highlights
EURUSD: technical overview

The Euro has finally broken out from a multi-month consolidation off a critical longer-term low. This latest push through the 2023 high lends further support to the case for a meaningful bottom, setting the stage for a bullish structural shift and the next major upside extension targeting the 2021 high at 1.2350. Setbacks should be exceptionally well supported below 1.1000.

EURUSD Chart
R2 1.1632 - 12 June/2025 high - Strong
R1 1.1600 - Figure - Medium
S1 1.1373 - 10 June low - Medium
S2 1.1210 - 29 May low - Strong
EURUSD: fundamental overview

EU Economy Commissioner Valdis Dombrovskis reported progress in intensive EU-US trade talks, dismissing speculation of a 10% reciprocal tariff as inaccurate. With a July 9 deadline approaching, failure to reach an agreement could escalate tariffs to 50%, amid existing high tariffs on steel, aluminum, and automobiles causing disruptions for European automakers. Key issues include U.S. demands for changes to EU tech regulations and the EU’s opposition to sector-specific tariffs, with further U.S. investigations into pharmaceuticals and other industries adding complexity. The EU is prepared to impose retaliatory tariffs targeting key U.S. states if talks fail, while IMF’s Kristalina Georgieva sees an opportunity for the euro to grow as a global currency, despite challenges like regulatory fragmentation and high energy costs, which she believes Europe can overcome.

 
USDJPY: technical overview

There are signs of a meaningful top in place after the market put in a multi-year high in 2024. At this point, the door is now open for a deeper setback below the 2024 low at 139.58 over the coming sessions exposing a retest of the 2023 low. Rallies should be well capped below 150.00.

USDJPY Chart
R2 148.65 - 12 May high - Medium
R1 146.29 - 29 May high - Medium
S1 142.11 - 27 May low - Medium
S2 141.97 - 29 April low - Medium
USDJPY: fundamental overview

Japanese government bond prices rose on Thursday due to strong demand at a five-year bond auction, fueled by expectations that the Ministry of Finance might reduce longer-term debt issuance and fading hopes for a Bank of Japan rate hike. The 10-year JGB yield fell to 1.42%, while Japanese investors may continue seeking higher yields abroad, pressuring the yen. However, May’s core inflation at 3.7%, higher than the expected 3.6%, marked three months of rising prices, driven by service inflation, wage growth, and potential oil price spikes from the Israel-Iran conflict. With U.S.-Japan trade talks and a July 9 tariff deadline approaching, persistent inflation could push the BOJ toward a rate hike in July or September, depending on trade outcomes.

 
AUDUSD: technical overview

There are signs of the potential formation of a longer-term base with the market trading down into a meaningful longer-term support zone. Only a monthly close below 0.5500 would give reason for rethink. A monthly close back above 0.7000 will take the big picture pressure off the downside and strengthen case for a bottom.

AUDUSD Chart
R2 0.6550 - 25 November 2024 high - Strong
R1 0.6546 - 11 June/2025 high - Medium
S1 0.6344 - 24 April low - Medium
S1 0.6275 - 14 April low - Strong
AUDUSD: fundamental overview
Australia’s labor market remains strong, with May’s unemployment at 4.1% and steady participation, leading most strategists to expect the RBA to pause rate cuts in July, despite markets pricing a 79% chance of another cut. With inflation within target and unemployment below forecasts, the RBA, having already cut rates twice to 3.85%, can afford to wait. One major bank highlights growing foreign interest in Australian bonds amid a global “dedollarization” trend, potentially boosting the Australian Dollar. Meanwhile, Kiwi hit yearly highs against the Buck but pulled back, with near-term movements for both currencies tied to U.S. decisions on the Israel-Iran conflict.
 
Suggested reading

Gut Feelings & Headline Chasing Are Not Good Investing, J. Spittler, RiskHedge (June 16, 2025)

Worried About Everything? What To Do To Ease Your Mind, J. Ho, Marketwatch (June 18, 2025)


Any opinions, news, research, analyses, prices or other information ("information") contained on this Blog, constitutes marketing communication and it has not been prepared in accordance with legal requirements designed to promote the independence of investment research. Further, the information contained within this Blog does not contain (and should not be construed as containing) investment advice or an investment recommendation, or an offer of, or solicitation for, a transaction in any financial instrument. LMAX Group has not verified the accuracy or basis-in-fact of any claim or statement made by any third parties as comments for every Blog entry.

LMAX Group will not accept liability for any loss or damage, including without limitation to, any loss of profit, which may arise directly or indirectly from use of or reliance on such information. No representation or warranty is given as to the accuracy or completeness of the above information. While the produced information was obtained from sources deemed to be reliable, LMAX Group does not provide any guarantees about the reliability of such sources. Consequently any person acting on it does so entirely at his or her own risk. It is not a place to slander, use unacceptable language or to promote LMAX Group or any other FX and CFD provider and any such postings, excessive or unjust comments and attacks will not be allowed and will be removed from the site immediately.

Day Image
19th June 2025 | view in browser
Fed holds rates, Dollar wobbles

The Federal Reserve maintained its benchmark interest rate as anticipated, with the dot plot indicating two rate cuts for the year, though nearly as many members projected none, showing a close split.


Performance chart 30day v. USD (%)
Performance Chart
 
 
Technical & fundamental highlights
EURUSD: technical overview

The Euro has finally broken out from a multi-month consolidation off a critical longer-term low. This latest push through the 2023 high lends further support to the case for a meaningful bottom, setting the stage for a bullish structural shift and the next major upside extension targeting the 2021 high at 1.2350. Setbacks should be exceptionally well supported below 1.1000.

EURUSD Chart
R2 1.1632 - 12 June/2025 high - Strong
R1 1.1600 - Figure - Medium
S1 1.1373 - 10 June low - Medium
S2 1.1210 - 29 May low - Strong
EURUSD: fundamental overview

European ministers will meet Iran’s counterpart in Geneva on Friday, alongside EU diplomat Kaja Kallas, to discuss Iran’s nuclear program, with U.S. coordination but without Trump’s hardline influence, potentially easing compromise. The ECB, after a June rate cut, is cautious, with markets expecting just one more cut in 2025, while the U.S. anticipates two, supporting the euro. The EU plans to boost defense spending by cutting regulations, aiming to speed up project approvals and stimulate the economy, further strengthening the euro. ECB President Lagarde promotes the euro as a global reserve currency alternative, while ECB members Villeroy and Panetta emphasize stable 2% rates, controlled inflation, and risks from U.S. trade policies and Middle East tensions, with July’s ECB meeting hinging on U.S. trade talks.

 
USDJPY: technical overview

There are signs of a meaningful top in place after the market put in a multi-year high in 2024. At this point, the door is now open for a deeper setback below the 2024 low at 139.58 over the coming sessions exposing a retest of the 2023 low. Rallies should be well capped below 150.00.

USDJPY Chart
R2 148.65 - 12 May high - Medium
R1 146.29 - 29 May high - Medium
S1 142.11 - 27 May low - Medium
S2 141.97 - 29 April low - Medium
USDJPY: fundamental overview

Japan will release its inflation data early Friday, with core CPI expected to hit 3.7%, marking three months of rising inflation, driven by higher service and food prices as companies pass on increased labor costs. Persistent high inflation may push the Bank of Japan to raise interest rates, though concerns about U.S. tariffs impacting growth remain. Japan’s failure to secure a trade deal with the U.S. at the G7 summit raises recession risks, but President Trump hinted at a possible agreement before the July 9 tariff deadline, aiming to score economic wins ahead of the 2026 midterms.

 
AUDUSD: technical overview

There are signs of the potential formation of a longer-term base with the market trading down into a meaningful longer-term support zone. Only a monthly close below 0.5500 would give reason for rethink. A monthly close back above 0.7000 will take the big picture pressure off the downside and strengthen case for a bottom.

AUDUSD Chart
R2 0.6550 - 25 November 2024 high - Strong
R1 0.6546 - 11 June/2025 high - Medium
S1 0.6344 - 24 April low - Medium
S1 0.6275 - 14 April low - Strong
AUDUSD: fundamental overview

At the G7 summit, Australian Prime Minister Anthony Albanese met with EU leaders Ursula von der Leyen and Antonio Costa to discuss strengthening trade and security ties, emphasizing their importance amid global protectionism. Despite a failed 2018-2023 free trade agreement attempt, Albanese remains optimistic about reaching a new deal. Australia’s May employment data showed a surprising dip of -2.5k jobs against a forecast of 21.2k, but full-time jobs rose, and the unemployment rate held steady at 4.1%, signaling labor market resilience. The Reserve Bank of Australia expects unemployment to peak slightly higher at 4.3%, with no significant shift in monetary policy easing expectations.

 
Suggested reading

Gut Feelings & Headline Chasing Are Not Good Investing, J. Spittler, RiskHedge (June 16, 2025)

Worried About Everything? What To Do To Ease Your Mind, J. Ho, Marketwatch (June 18, 2025)


Any opinions, news, research, analyses, prices or other information ("information") contained on this Blog, constitutes marketing communication and it has not been prepared in accordance with legal requirements designed to promote the independence of investment research. Further, the information contained within this Blog does not contain (and should not be construed as containing) investment advice or an investment recommendation, or an offer of, or solicitation for, a transaction in any financial instrument. LMAX Group has not verified the accuracy or basis-in-fact of any claim or statement made by any third parties as comments for every Blog entry.

LMAX Group will not accept liability for any loss or damage, including without limitation to, any loss of profit, which may arise directly or indirectly from use of or reliance on such information. No representation or warranty is given as to the accuracy or completeness of the above information. While the produced information was obtained from sources deemed to be reliable, LMAX Group does not provide any guarantees about the reliability of such sources. Consequently any person acting on it does so entirely at his or her own risk. It is not a place to slander, use unacceptable language or to promote LMAX Group or any other FX and CFD provider and any such postings, excessive or unjust comments and attacks will not be allowed and will be removed from the site immediately.