Day Image
4th June 2025 | view in browser
Fed urges patience as trade war clouds economic outlook

Recent Federal Reserve commentary emphasizes patience in monetary policy amid uncertainties from an escalating trade war, which is dampening the global economic outlook.


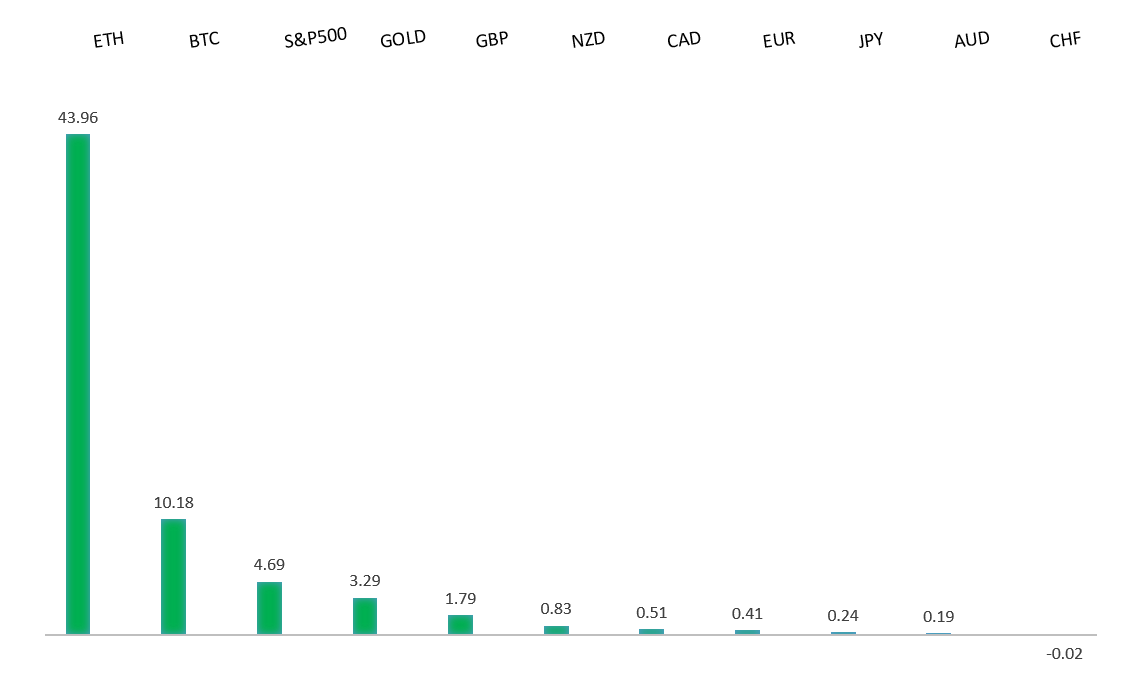
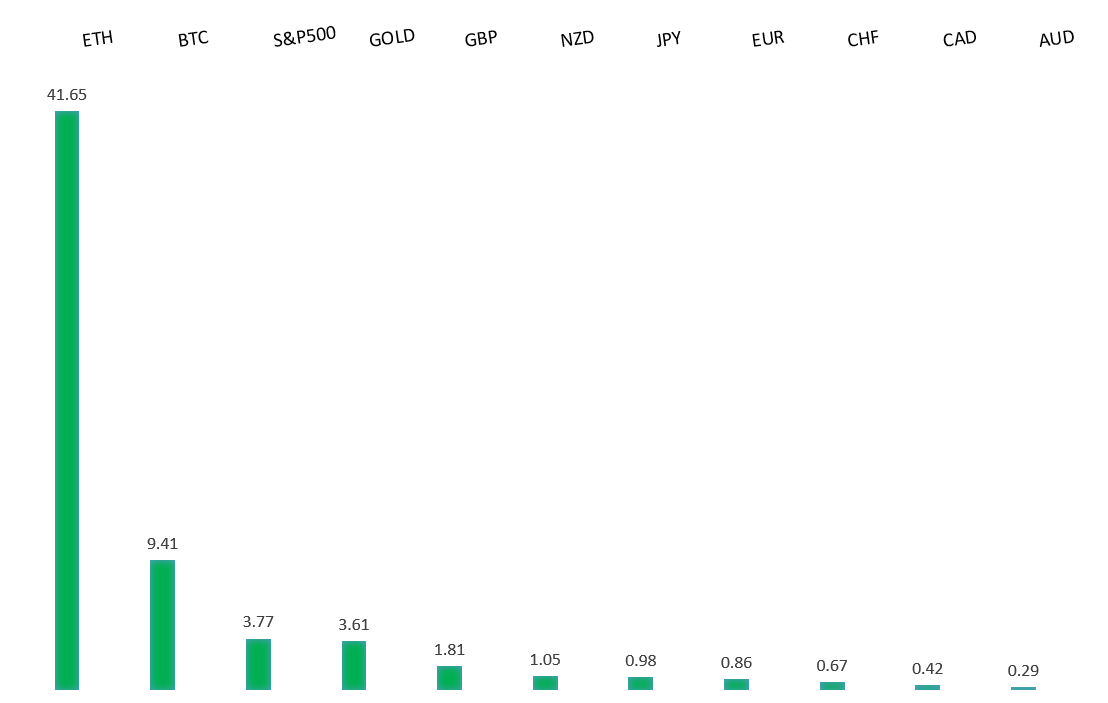
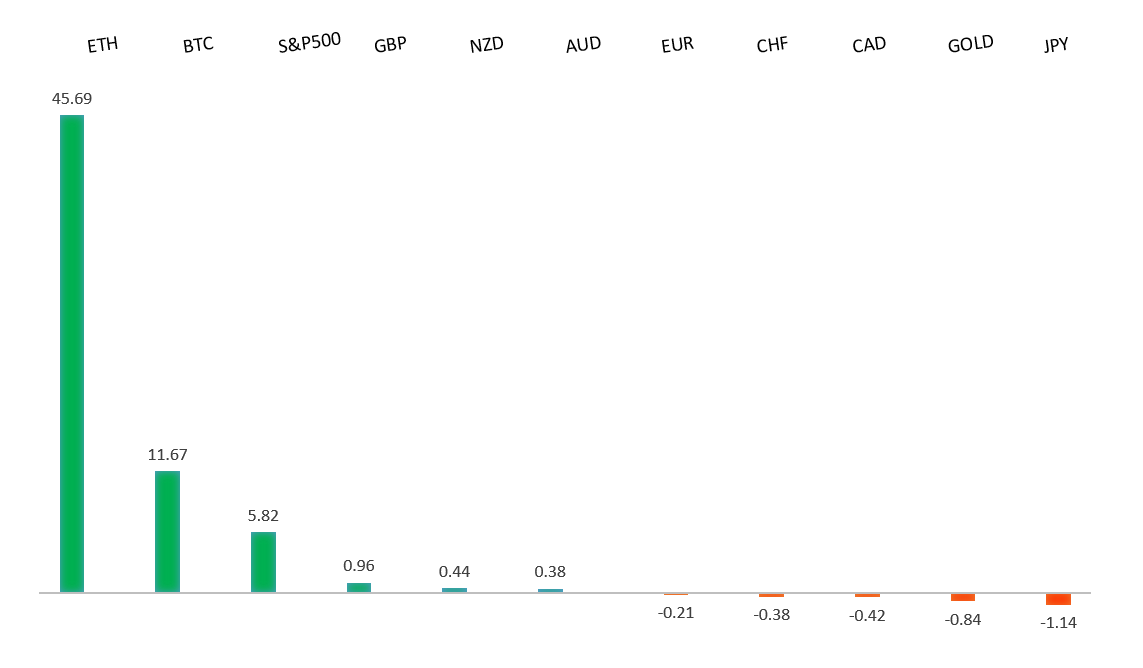
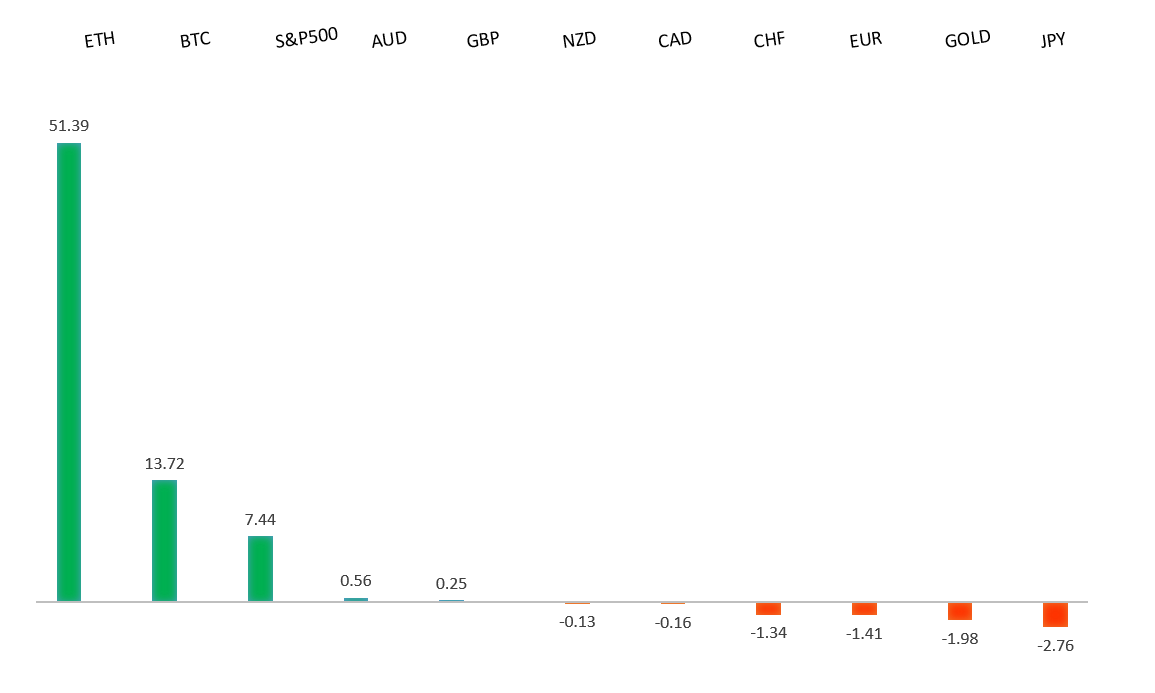
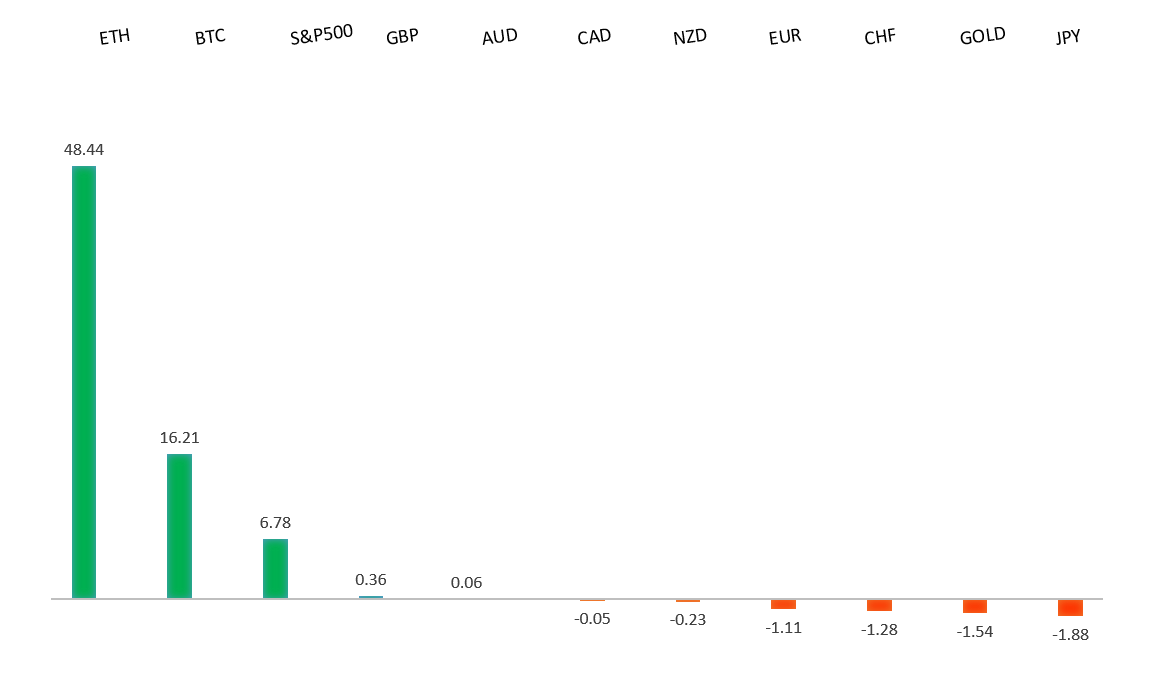
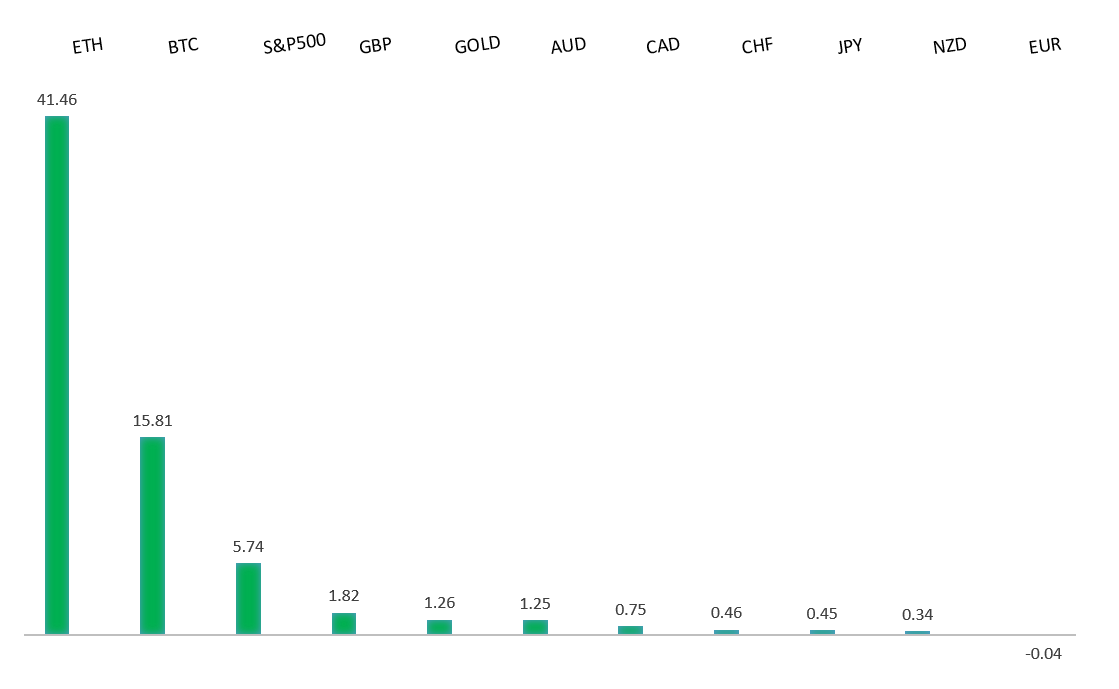
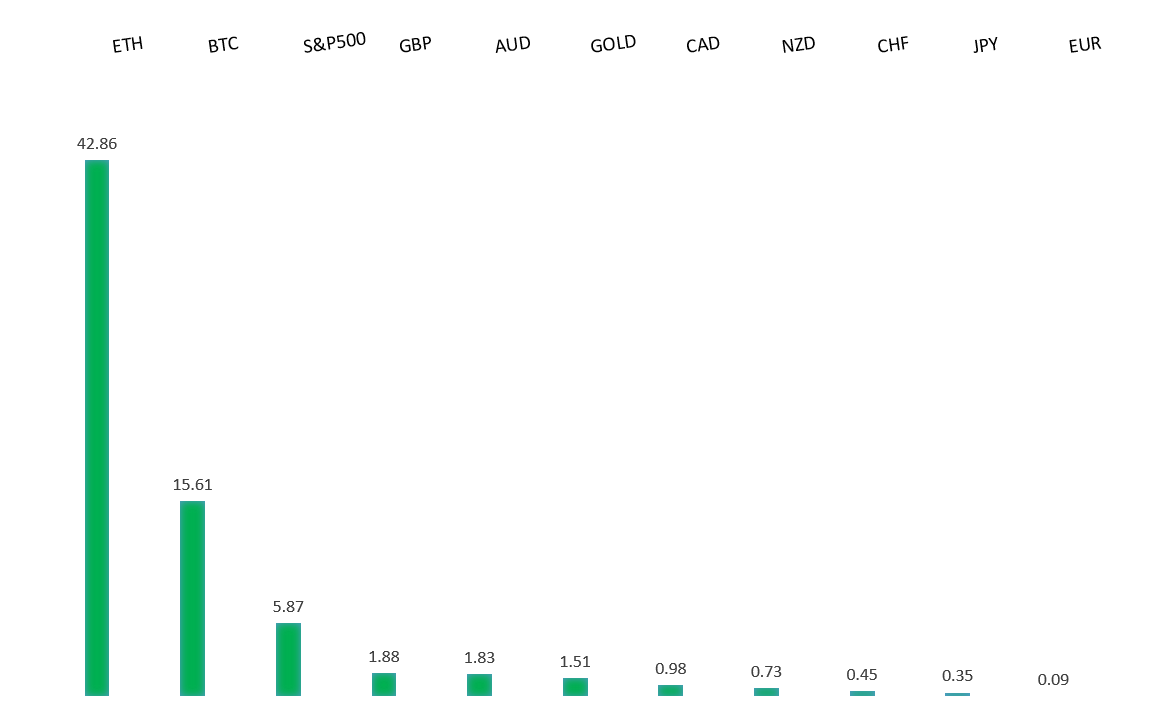
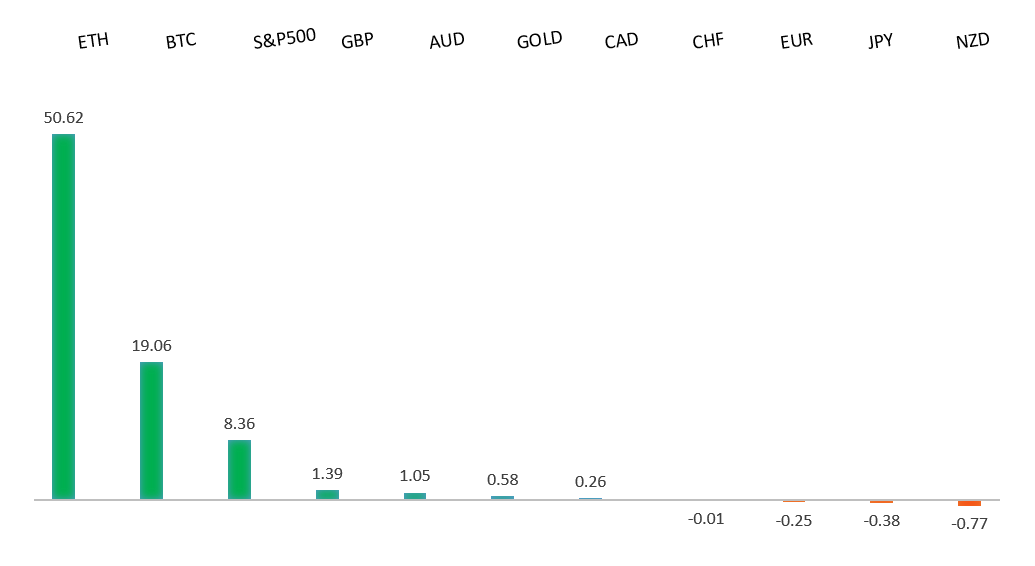
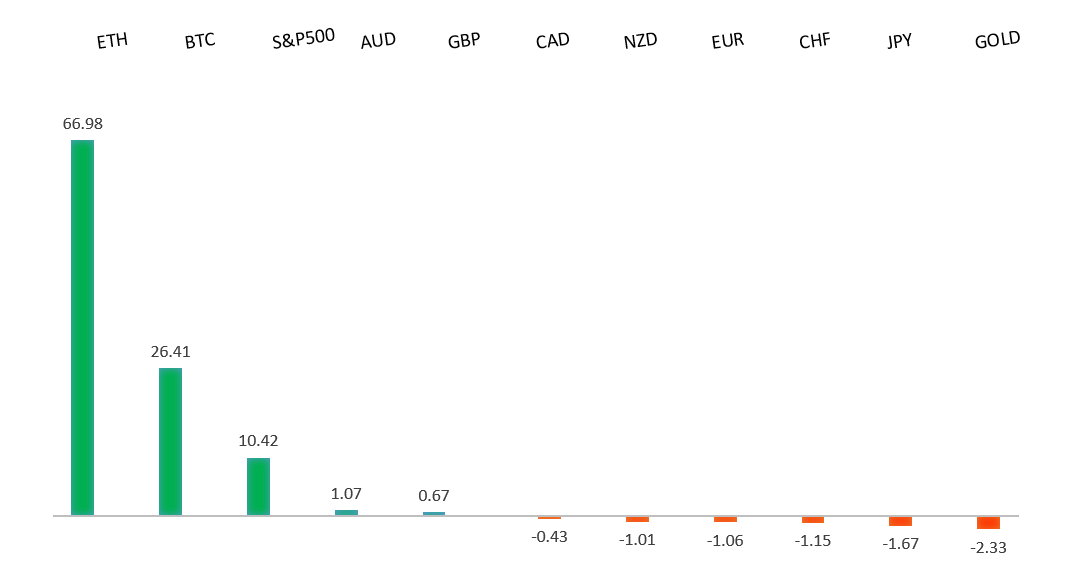
Performance chart 30day v. USD (%)
Performance Chart
 
 
Technical & fundamental highlights
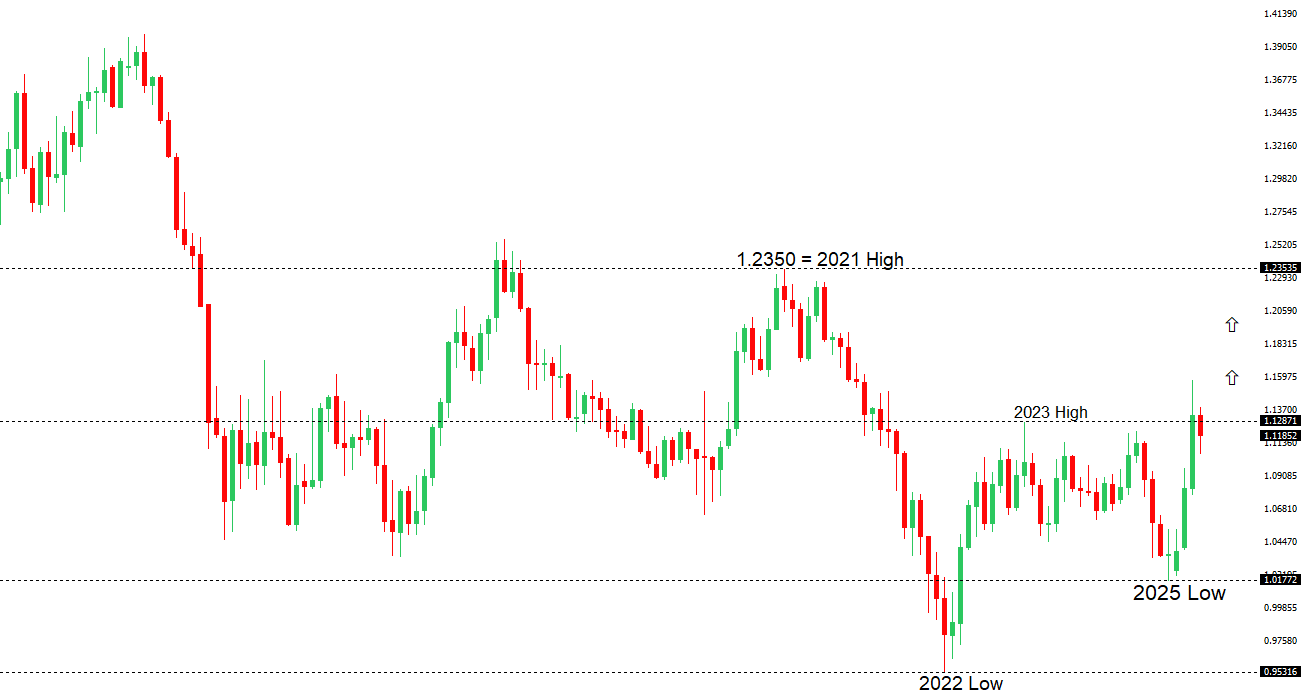
EURUSD: technical overview

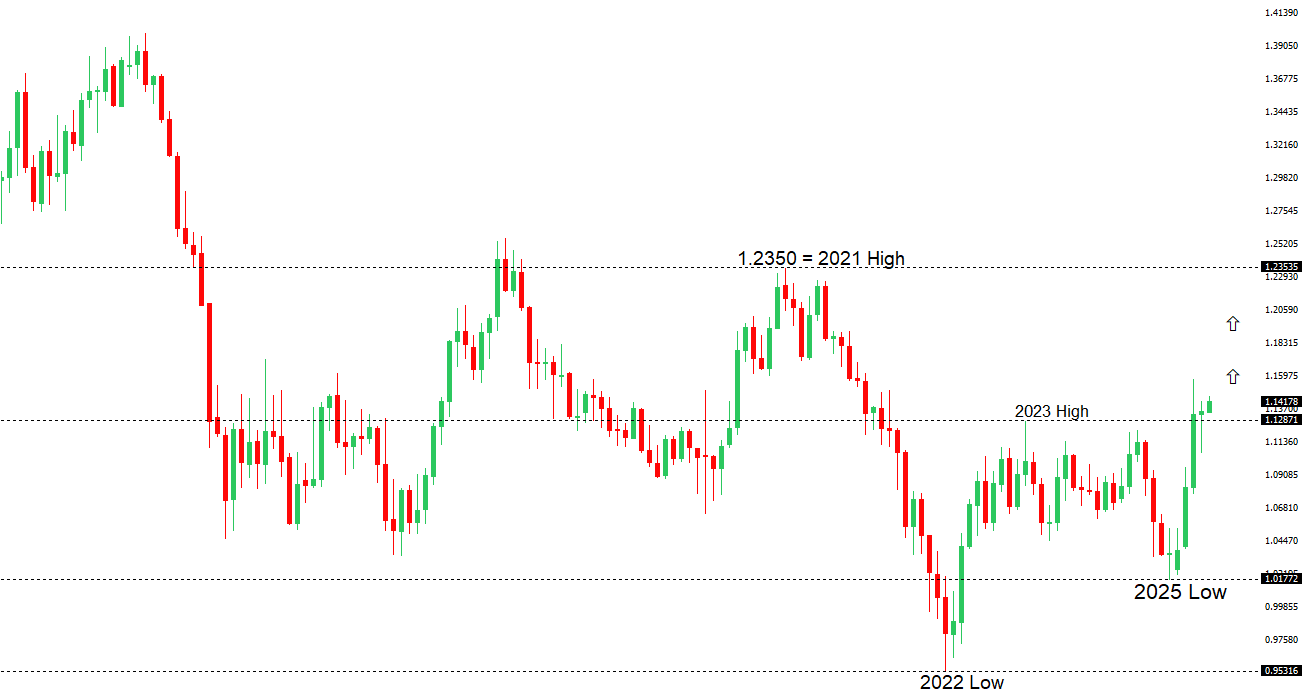
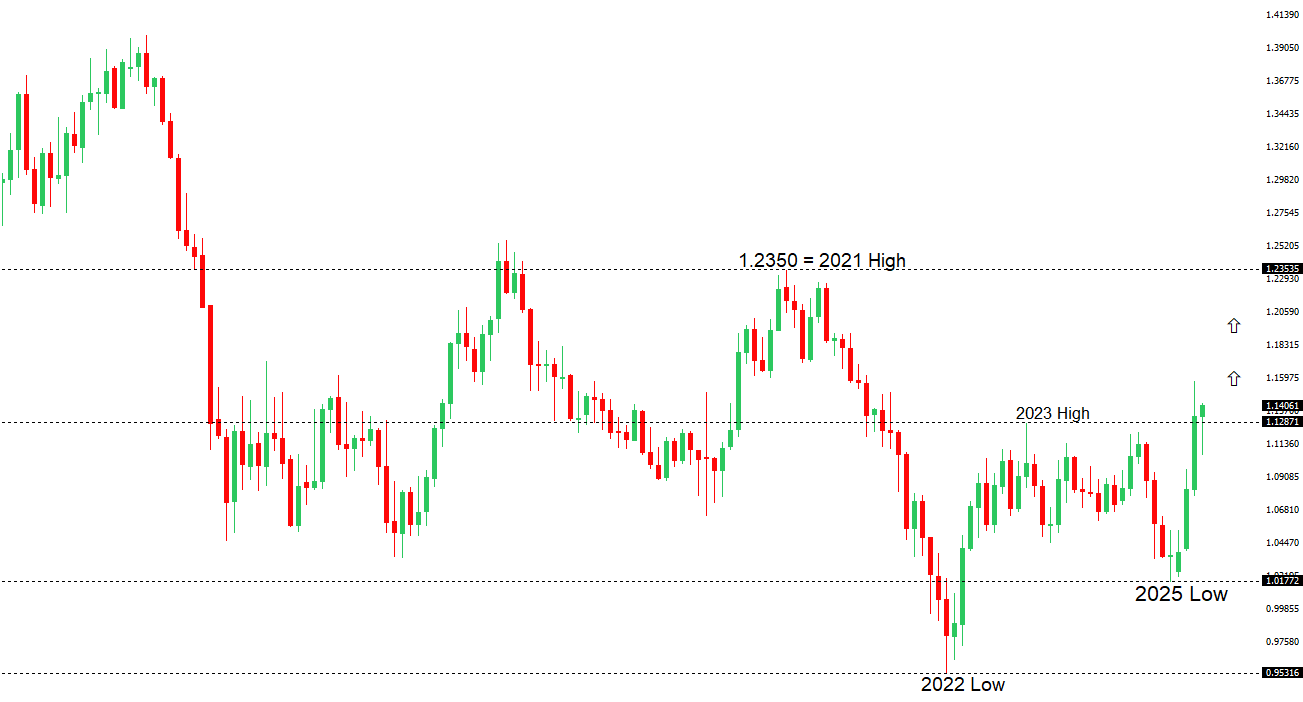
The Euro has finally broken out from a multi-month consolidation off a critical longer-term low. This latest push through the 2023 high lends further support to the case for a meaningful bottom, setting the stage for a bullish structural shift and the next major upside extension targeting the 2021 high at 1.2350. Setbacks should be exceptionally well supported below 1.1000.

EURUSD Chart
R2 1.1474 - 11 April high - Medium
R1 1.1455 - 3 June high - Medium
S1 1.1210 - 29 May low - Medium
S2 1.1065 - 12 May low - Strong
EURUSD: fundamental overview

Eurozone inflation fell to 1.9% in May, below the expected 2.0% and down from 2.2% in April, driven by a significant drop in services inflation from 4% to 3.2%. Core inflation also eased to 2.3%, supporting expectations of an ECB deposit rate cut to 2% at its next meeting, with another potential cut later this year. Despite these cuts, the euro’s strength against the dollar is likely to persist due to factors like de-dollarization and U.S. fiscal concerns.

 
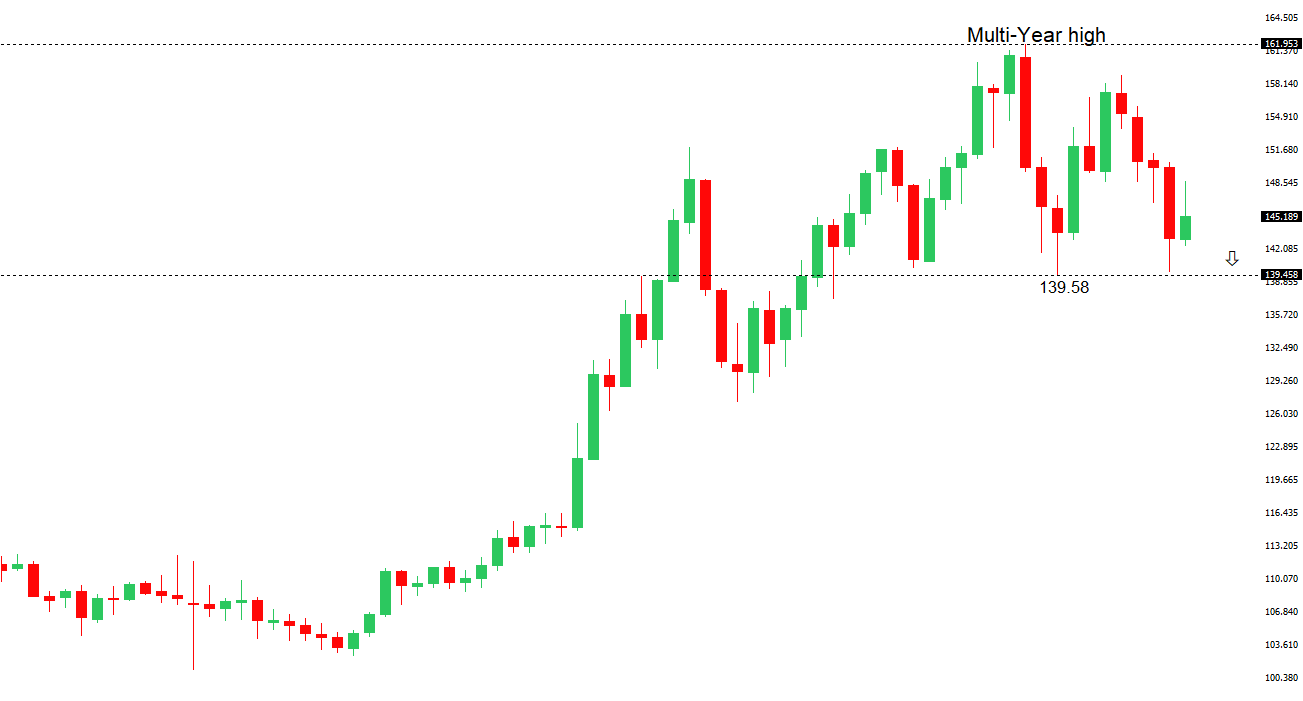
USDJPY: technical overview

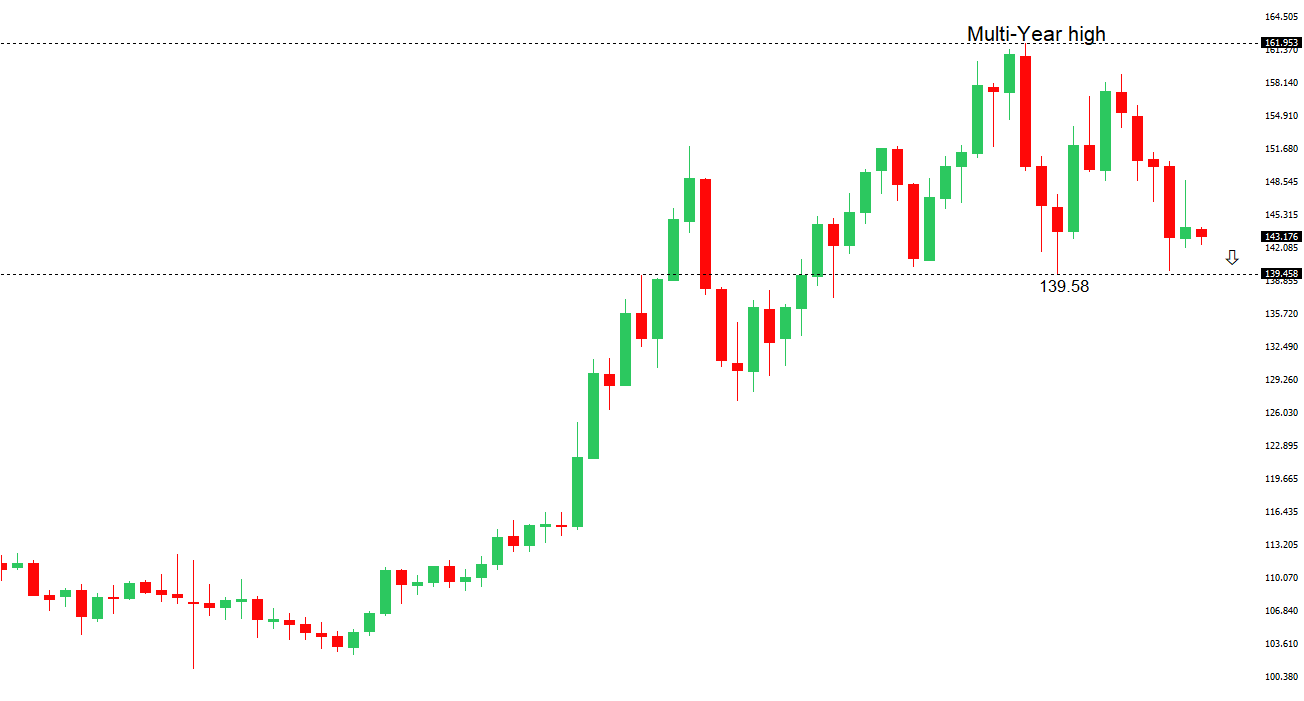
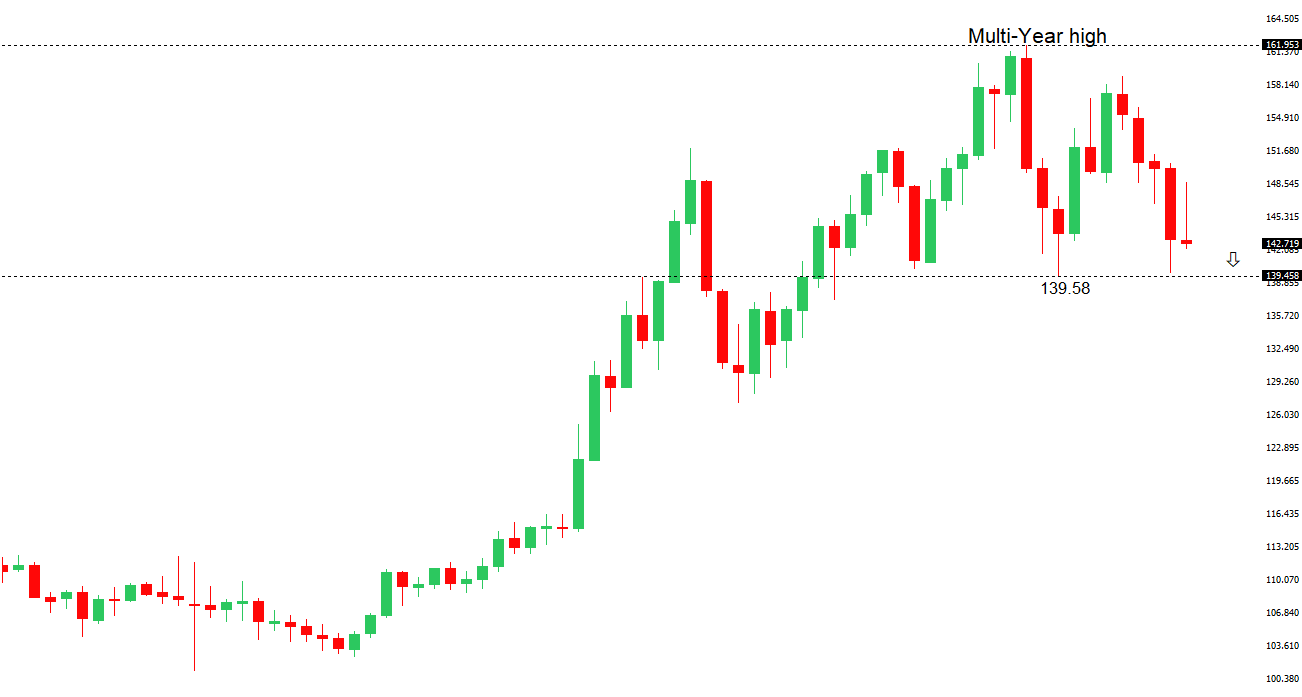
There are signs of a meaningful top in place after the market put in a multi-year high in 2024. At this point, the door is now open for a deeper setback below the 2024 low at 139.58 over the coming sessions exposing a retest of the 2023 low. Rallies should be well capped below 150.00.

USDJPY Chart
R2 148.65 - 12 May high - Medium
R1 146.29 - 29 May high - Medium
S1 142.11 - 27 May low - Medium
S2 141.97 - 29 April low - Medium
USDJPY: fundamental overview

Japan’s Chief Cabinet Secretary Yoshimasa Hayashi noted that no reminder letter was received from the U.S. Trade Representative, suggesting possible U.S. satisfaction with Japan’s stance, as Japan holds firm for a comprehensive tariff deal ahead of elections. The Bank of Japan has increased provisions for bond transaction losses to 100%, signaling expectations of higher interest rates and a shift from ultra-loose monetary policy, which could strengthen the yen. However, BOJ Governor Ueda and former board member Sakurai indicated that rising JGB yields and trade uncertainties, particularly from U.S. tariffs, may delay rate hikes until late 2025, with the BOJ likely to pause bond purchase reductions if yields surge. Recent data shows Japan’s PMI Composite and Services indices revised upward to 50.2 and 51.0, respectively, for May.

 
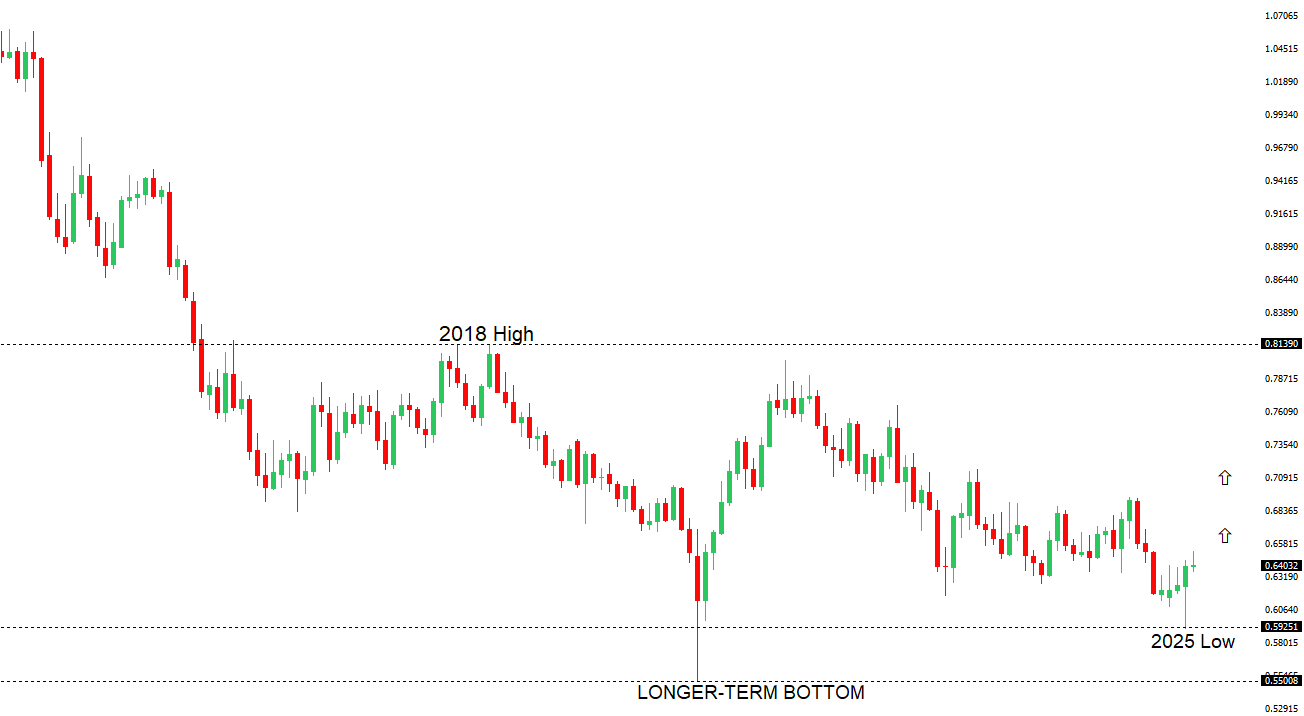
AUDUSD: technical overview

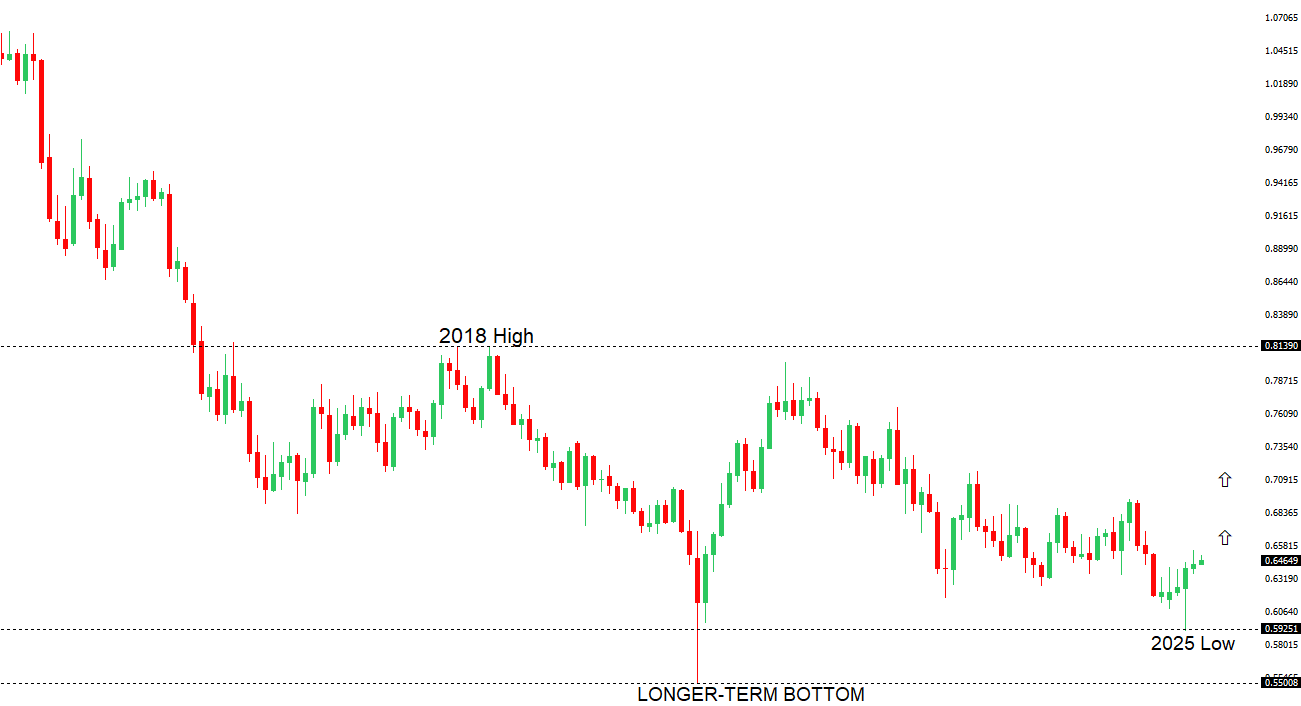
There are signs of the potential formation of a longer-term base with the market trading down into a meaningful longer-term support zone. Only a monthly close below 0.5500 would give reason for rethink. A monthly close back above 0.7000 will take the big picture pressure off the downside and strengthen case for a bottom.

AUDUSD Chart
R2 0.6550 - 25 November 2024 high - Strong
R1 0.6538 - 26 May/2025 high - Medium
S1 0.6344 - 24 April low - Medium
S1 0.6275 - 14 April low - Strong
AUDUSD: fundamental overview

The Australian dollar is attempting to hold gains above its 200-day moving average amid broad U.S. dollar weakness, but caution prevails due to China’s Caixin Manufacturing PMI slipping into contraction and dovish RBA minutes suggesting a potential 50bps rate cut as a safeguard against global trade risks. Australia’s Q1 GDP grew by just 0.2% quarter-on-quarter, below the expected 0.4%, signaling vulnerability to global trade tensions and geopolitical risks. The OECD warns of a potential global economic stall due to U.S. tariff hikes, increasing speculation that the RBA may cut rates at its July meeting.

 
Suggested reading

Petrobras: fuelling the future or stuck in the past?, G. Bobillot, Financial Times (June 4, 2025)

The Only Way To Get Paid Trading, C. Reilly, RiskHedge (June 2, 2025)


Any opinions, news, research, analyses, prices or other information ("information") contained on this Blog, constitutes marketing communication and it has not been prepared in accordance with legal requirements designed to promote the independence of investment research. Further, the information contained within this Blog does not contain (and should not be construed as containing) investment advice or an investment recommendation, or an offer of, or solicitation for, a transaction in any financial instrument. LMAX Group has not verified the accuracy or basis-in-fact of any claim or statement made by any third parties as comments for every Blog entry.

LMAX Group will not accept liability for any loss or damage, including without limitation to, any loss of profit, which may arise directly or indirectly from use of or reliance on such information. No representation or warranty is given as to the accuracy or completeness of the above information. While the produced information was obtained from sources deemed to be reliable, LMAX Group does not provide any guarantees about the reliability of such sources. Consequently any person acting on it does so entirely at his or her own risk. It is not a place to slander, use unacceptable language or to promote LMAX Group or any other FX and CFD provider and any such postings, excessive or unjust comments and attacks will not be allowed and will be removed from the site immediately.

Day Image
3rd June 2025 | view in browser
Global trade tensions and monetary policy shifts

The US dollar and bonds remain weak as fears of “de-dollarization” persist, driven by escalating trade tensions and the proposed “One Big Beautiful Bill,” which includes Section 899 allowing taxes on foreign holders of US treasuries from countries with “unfair” tax practices.


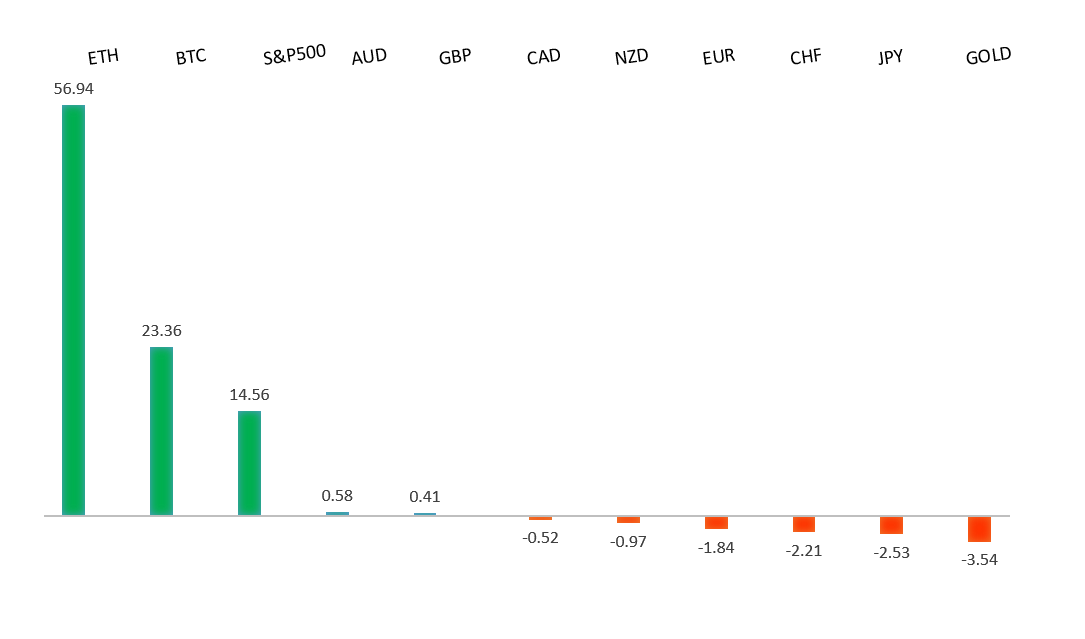
Performance chart 30day v. USD (%)
Performance Chart
 
 
Technical & fundamental highlights
EURUSD: technical overview

The Euro has finally broken out from a multi-month consolidation off a critical longer-term low. This latest push through the 2023 high lends further support to the case for a meaningful bottom, setting the stage for a bullish structural shift and the next major upside extension targeting the 2021 high at 1.2350. Setbacks should be exceptionally well supported below 1.1000.

EURUSD Chart
R2 1.1474 - 11 April high - Medium
R1 1.1455 - 3 June high - Medium
S1 1.1210 - 29 May low - Medium
S2 1.1065 - 12 May low - Strong
EURUSD: fundamental overview

The European Central Bank is likely to cut interest rates on Thursday to counter trade tensions and slowing economic growth, as inflation nears the ECB’s 2% target. Market expectations suggest a total of 56 basis points in rate cuts this year, potentially lowering rates to 1.75%, with the ECB nearing the end of its rate-cutting cycle. As the ECB eases, the Fed may also begin loosening policy later in 2025, potentially narrowing the interest rate gap and supporting the euro. The EU has criticized Trump’s proposed 50% tariffs on steel and aluminum, warning of retaliatory measures if trade talks fail.

 
USDJPY: technical overview

There are signs of a meaningful top in place after the market put in a multi-year high in 2024. At this point, the door is now open for a deeper setback below the 2024 low at 139.58 over the coming sessions exposing a retest of the 2023 low. Rallies should be well capped below 150.00.

USDJPY Chart
R2 148.65 - 12 May high - Medium
R1 146.29 - 29 May high - Medium
S1 142.11 - 27 May low - Medium
S2 141.97 - 29 April low - Medium
USDJPY: fundamental overview

The Yen has been gaining strength from safe-haven flows as markets react to President Trump’s proposed tariff hike on steel and aluminum from 25% to 50%, highlighting ongoing trade tensions with China. The Bank of Japan is preparing for higher interest rates by setting aside full provisions for bond transaction losses, signaling a shift from ultra-loose monetary policy, which could boost Yen demand as higher Japanese government bond yields attract capital. However, former BOJ board member Makoto Sakurai suggests that if JGB yields surge, the BOJ may pause its gradual reduction of bond purchases, while Governor Ueda’s cautious remarks indicate that trade uncertainties and economic impacts could delay rate hikes until late 2025, pending clearer data on business investment and wage growth.

 
AUDUSD: technical overview

There are signs of the potential formation of a longer-term base with the market trading down into a meaningful longer-term support zone. Only a monthly close below 0.5500 would give reason for rethink. A monthly close back above 0.7000 will take the big picture pressure off the downside and strengthen case for a bottom.

AUDUSD Chart
R2 0.6550 - 25 November 2024 high - Strong
R1 0.6538 - 26 May/2025 high - Medium
S1 0.6344 - 24 April low - Medium
S1 0.6275 - 14 April low - Strong
AUDUSD: fundamental overview

The Australian dollar is attempting to hold gains above its 200-day moving average amid broad U.S. dollar weakness, but caution persists due to China’s Caixin Manufacturing PMI slipping into contraction and dovish Reserve Bank of Australia Minutes suggesting a potential 50bps rate cut as a buffer against global trade risks. Australia’s Q1 2025 GDP is expected to grow 0.4% quarter-on-quarter, down from 0.6%, with modest improvement forecast in coming quarters, supported by potential further RBA easing to boost consumer demand and housing. However, weaker-than-expected Q1 company profits and a wider current account deficit may temper business investment, though a stronger-than-expected inventory build offers a slight boost to GDP.

 
Suggested reading

Why the A.I. Job Apocalypse May Already Be Here, K. Roose, NY Times (May 30, 2025)

Trump Cannot Quiet Reality, Neither Can the Federal Reserve, J. Tamny, Forbes (June 1, 2025)


Any opinions, news, research, analyses, prices or other information ("information") contained on this Blog, constitutes marketing communication and it has not been prepared in accordance with legal requirements designed to promote the independence of investment research. Further, the information contained within this Blog does not contain (and should not be construed as containing) investment advice or an investment recommendation, or an offer of, or solicitation for, a transaction in any financial instrument. LMAX Group has not verified the accuracy or basis-in-fact of any claim or statement made by any third parties as comments for every Blog entry.

LMAX Group will not accept liability for any loss or damage, including without limitation to, any loss of profit, which may arise directly or indirectly from use of or reliance on such information. No representation or warranty is given as to the accuracy or completeness of the above information. While the produced information was obtained from sources deemed to be reliable, LMAX Group does not provide any guarantees about the reliability of such sources. Consequently any person acting on it does so entirely at his or her own risk. It is not a place to slander, use unacceptable language or to promote LMAX Group or any other FX and CFD provider and any such postings, excessive or unjust comments and attacks will not be allowed and will be removed from the site immediately.

Day Image
30th May 2025 | view in browser
Dollar dips as tariff ruling sparks uncertainty

The US dollar initially rose after the US Court of International Trade struck down Trump’s tariffs but later weakened as markets considered ongoing uncertainties and signs of a slowing US economy from recent data.


Performance chart 30day v. USD (%)
Performance Chart
 
 
Technical & fundamental highlights
EURUSD: technical overview

The Euro has finally broken out from a multi-month consolidation off a critical longer-term low. This latest push through the 2023 high lends further support to the case for a meaningful bottom, setting the stage for a bullish structural shift and the next major upside extension targeting the 2021 high at 1.2350. Setbacks should be exceptionally well supported below 1.1000.

EURUSD Chart
R2 1.1474 - 11 April high - Medium
R1 1.1419 - 26 May high - Medium
S1 1.1131 - 16 May low - Medium
S2 1.1065 - 12 May low - Medium
EURUSD: fundamental overview

The EU-US trade talks will proceed despite a court ruling against Trump’s tariffs, which does not affect existing tariffs on steel, aluminum, autos, or potential future tariffs on pharmaceuticals—key European exports likely to be central in negotiations. The EU may reconsider a mutual elimination of industrial tariffs, previously rejected by the US, and adopt a firmer stance in talks due to reduced pressure for quick concessions. Inflation in the eurozone’s major economies (Germany, Spain, Italy, and France, representing over 70% of the region’s output) is at or below the ECB’s 2% target for the first time in eight months, driven by a strong euro, falling energy costs, and easing wage pressures. This low inflation, alongside external risks like US tariffs, supports expectations for an ECB interest rate cut on June 5 to stimulate growth.

 
USDJPY: technical overview

There are signs of a meaningful top in place after the market put in a multi-year high in 2024. At this point, the door is now open for a deeper setback below the 2024 low at 139.58 over the coming sessions exposing a retest of the 2023 low. Rallies should be well capped below 150.00.

USDJPY Chart
R2 148.65 - 12 May high - Medium
R1 146.29 - 29 May high - Medium
S1 142.11 - 27 May low - Medium
S2 141.97 - 29 April low - Medium
USDJPY: fundamental overview

The US dollar weakened after initial strength following a court ruling on Trump’s tariffs, as markets anticipate increased uncertainty, boosting the safe-haven Japanese yen, supported by data favoring Bank of Japan rate hikes. Japan’s PM Ishiba, after inconclusive talks with Trump, emphasized fair trade and strengthening the CPTPP, aiming to deepen economic ties with Southeast Asia and Europe while maintaining US security ties. Japan’s economic data shows stable unemployment at 2.5%, elevated Tokyo CPI at 3.6% (indicating persistent inflation), and resilient retail sales growth at 3.3% year-on-year, supporting BOJ’s case for potential rate hikes despite a slight industrial output decline.

 
AUDUSD: technical overview

There are signs of the potential formation of a longer-term base with the market trading down into a meaningful longer-term support zone. Only a monthly close below 0.5500 would give reason for rethink. A monthly close back above 0.7000 will take the big picture pressure off the downside and strengthen case for a bottom.

AUDUSD Chart
R2 0.6550 - 25 November 2024 high - Strong
R1 0.6538 - 26 May/2025 high - Medium
S1 0.6344 - 24 April low - Medium
S1 0.6275 - 14 April low - Strong
AUDUSD: fundamental overview
The Australian Dollar is tracking the Chinese yuan’s movements this week. RBA Governor Michele Bullock’s shift away from a strict inflation focus toward broader economic risks has led markets to expect three additional rate cuts in 2025, potentially lowering the cash rate to 3.10% by November. Australian retail sales unexpectedly fell by 0.1% in April, driven by reduced spending on clothing and department stores, while private sector credit grew strongly at 0.7% month-on-month and 6.7% year-on-year, showing resilient demand. However, a sharp 5.7% drop in building approvals signals potential housing supply challenges, reinforcing the RBA’s dovish stance after weak economic indicators like a 0.1% decline in Q1 private capital expenditure.
 
Suggested reading

Japan’s Day Of Economic Reckoning, D. Lachman, AEIdeas (May 28, 2025)

The Beautiful Budget Bill Can Deliver Decisive Deregulation, W. Crews, Forbes (May 28, 2025)


Any opinions, news, research, analyses, prices or other information ("information") contained on this Blog, constitutes marketing communication and it has not been prepared in accordance with legal requirements designed to promote the independence of investment research. Further, the information contained within this Blog does not contain (and should not be construed as containing) investment advice or an investment recommendation, or an offer of, or solicitation for, a transaction in any financial instrument. LMAX Group has not verified the accuracy or basis-in-fact of any claim or statement made by any third parties as comments for every Blog entry.

LMAX Group will not accept liability for any loss or damage, including without limitation to, any loss of profit, which may arise directly or indirectly from use of or reliance on such information. No representation or warranty is given as to the accuracy or completeness of the above information. While the produced information was obtained from sources deemed to be reliable, LMAX Group does not provide any guarantees about the reliability of such sources. Consequently any person acting on it does so entirely at his or her own risk. It is not a place to slander, use unacceptable language or to promote LMAX Group or any other FX and CFD provider and any such postings, excessive or unjust comments and attacks will not be allowed and will be removed from the site immediately.

Day Image
29th May 2025 | view in browser
Dollar rallies as Nvidia sparks AI optimism

The U.S. dollar may see continued strength due to corporate buying around month-end and Nvidia’s upbeat $45 billion revenue forecast fueling optimism for an “AI industrial revolution” and supporting U.S. equities.


Performance chart 30day v. USD (%)
Performance Chart
 
 
Technical & fundamental highlights
EURUSD: technical overview

The Euro has finally broken out from a multi-month consolidation off a critical longer-term low. This latest push through the 2023 high lends further support to the case for a meaningful bottom, setting the stage for a bullish structural shift and the next major upside extension targeting the 2021 high at 1.2350. Setbacks should be exceptionally well supported below 1.1000.

EURUSD Chart
R2 1.1474 - 11 April high - Medium
R1 1.1419 - 26 May high - Medium
S1 1.1131 - 16 May low - Medium
S2 1.1065 - 12 May low - Medium
EURUSD: fundamental overview

France reported a low May CPI of 0.7% and EU Harmonized CPI of 0.6%, signaling subdued inflation. Germany, Spain, and Italy, representing over 70% of the eurozone’s economy, are expected to report inflation at or below the ECB’s 2% target this Friday, a rare occurrence since 2021. Falling energy costs, a strong euro, and easing wage pressures are driving this disinflation, supporting expectations for an ECB rate cut on June 5 to stimulate growth, despite external risks like potential U.S. tariffs. Eurozone 1-year CPI expectations rose to 3.1%, the highest since February 2024, but stable 3-year expectations at 2.5% suggest confidence in the ECB’s long-term price stability, keeping the rate cut on track.

 
USDJPY: technical overview

There are signs of a meaningful top in place after the market put in a multi-year high in 2024. At this point, the door is now open for a deeper setback below the 2024 low at 139.58 over the coming sessions exposing a retest of the 2023 low. Rallies should be well capped below 150.00.

USDJPY Chart
R2 148.65 - 12 May high - Medium
R1 146.29 - 29 May high - Medium
S1 142.11 - 27 May low - Medium
S2 141.97 - 29 April low - Medium
USDJPY: fundamental overview

Japan’s 40-year JGB yields rose after weak demand at a recent auction, prompting the finance ministry to survey banks and investors on super-long bond demand, hinting at a potential shift toward issuing more short-term bonds. This could stabilize the bond market, support the yen, and reduce upward pressure on yields, though higher short-term bond issuance might elevate shorter-end yields, narrowing the U.S.-Japan yield gap and sustaining USDJPY’s downward trend. Japan’s May Consumer Confidence Index, expected at 31.8 (up from 31.2), may show slight improvement but remains below the long-term average of 40.7, reflecting ongoing economic caution. Persistent inflation, driven by food, labor, and energy costs, and upcoming Tokyo CPI data suggesting an uptick, strengthen the case for another rate hike.

 
AUDUSD: technical overview

There are signs of the potential formation of a longer-term base with the market trading down into a meaningful longer-term support zone. Only a monthly close below 0.5500 would give reason for rethink. A monthly close back above 0.7000 will take the big picture pressure off the downside and strengthen case for a bottom.

AUDUSD Chart
R2 0.6550 - 25 November 2024 high - Strong
R1 0.6538 - 26 May/2025 high - Medium
S1 0.6344 - 24 April low - Medium
S1 0.6275 - 14 April low - Strong
AUDUSD: fundamental overview

A notable bank has been out predicting the Australian dollar will strengthen against the U.S. dollar due to Australia’s stronger economic growth outlook, which recent AUD appreciation hasn’t fully reflected. Australia’s May CPI was slightly higher than expected at 2.4% YoY, with trimmed mean CPI at 2.8%, but inflation remains within the RBA’s 2-3% target, reducing pressure for immediate rate cuts. Despite a 67% market-implied chance of a rate cut at the RBA’s July 7-8 meeting, Governor Bullock’s dovish stance prioritizes trade tariff risks over inflation, with year-end cash rate forecasts at 3.10%-3.35%. Weak Q1 private capital expenditure (-0.1% vs. expected 0.5%) supports the RBA’s cautious approach, though planned business spending of A$155.9 billion for 2025-26 signals optimism for future recovery.

 
Suggested reading

Asia’s $7.5 Trillion Bet On US Assets Is Unraveling, R. Carson, Bloomberg (May 28, 2025)

How Interest Rates Set Asset Prices, M. Munger, The Daily Economy (May 21, 2025)


Any opinions, news, research, analyses, prices or other information ("information") contained on this Blog, constitutes marketing communication and it has not been prepared in accordance with legal requirements designed to promote the independence of investment research. Further, the information contained within this Blog does not contain (and should not be construed as containing) investment advice or an investment recommendation, or an offer of, or solicitation for, a transaction in any financial instrument. LMAX Group has not verified the accuracy or basis-in-fact of any claim or statement made by any third parties as comments for every Blog entry.

LMAX Group will not accept liability for any loss or damage, including without limitation to, any loss of profit, which may arise directly or indirectly from use of or reliance on such information. No representation or warranty is given as to the accuracy or completeness of the above information. While the produced information was obtained from sources deemed to be reliable, LMAX Group does not provide any guarantees about the reliability of such sources. Consequently any person acting on it does so entirely at his or her own risk. It is not a place to slander, use unacceptable language or to promote LMAX Group or any other FX and CFD provider and any such postings, excessive or unjust comments and attacks will not be allowed and will be removed from the site immediately.

Day Image
28th May 2025 | view in browser
US data beats expectations, Dollar holds firm

President Trump’s decision to delay 50% EU tariffs until July 9, coupled with a U.S.-China trade truce, boosted market optimism, with U.S. consumer confidence rising and durable goods orders declining less than expected, easing recession fears and fueling risk-on trades.


Performance chart 30day v. USD (%)
Performance Chart
 
 
Technical & fundamental highlights
EURUSD: technical overview

The Euro has finally broken out from a multi-month consolidation off a critical longer-term low. This latest push through the 2023 high lends further support to the case for a meaningful bottom, setting the stage for a bullish structural shift and the next major upside extension targeting the 2021 high at 1.2350. Setbacks should be exceptionally well supported below 1.1000.

EURUSD Chart
R2 1.1474 - 11 April high - Medium
R1 1.1419 - 26 May high - Medium
S1 1.1131 - 16 May low - Medium
S2 1.1065 - 12 May low - Medium
EURUSD: fundamental overview

France’s May inflation rate dropped to 0.7% (0.6% EU harmonized), signaling cooling price pressures, with Germany, Spain, and Italy expected to report inflation at or below the ECB’s 2% target on Friday, a rare occurrence since 2021. This trend, driven by a strong euro, falling energy costs, and easing wage pressures, supports expectations for an ECB rate cut on June 5 to stimulate growth, especially amid risks like potential U.S. tariffs on EU imports. EU trade chief Maros Sefcovic is leading negotiations to avoid trade conflicts, while Eurozone CPI expectations and German unemployment data, expected to show modest changes, are due today.

 
USDJPY: technical overview

There are signs of a meaningful top in place after the market put in a multi-year high in 2024. At this point, the door is now open for a deeper setback below the 2024 low at 139.58 over the coming sessions exposing a retest of the 2023 low. Rallies should be well capped below 150.00.

USDJPY Chart
R2 148.65 - 12 May high - Medium
R1 146.19 - 9 May high - Medium
S1 142.11 - 27 May low - Medium
S2 141.97 - 29 April low - Medium
USDJPY: fundamental overview

Japan’s Ministry of Finance surveyed banks and investors about demand for long-term government bonds, hinting at reduced issuance, which caused 30- and 40-year JGB yields to drop sharply, weakened the yen by over 1%, and spurred buying in U.S. Treasuries. Bank of Japan Governor Ueda signaled potential rate hikes if the economy improves, supported by April’s core inflation rising to 3.5% year-on-year, with May’s Tokyo CPI expected to show further price pressures. Japan’s trade negotiator aims to resolve U.S. tariff talks before the G7 summit (June 15–17), and a deal avoiding 25% auto tariffs could boost Japan’s economy and yen long-term, potentially enabling a BOJ rate hike in July, though markets remain skeptical, pricing in minimal hikes for 2025.

 
AUDUSD: technical overview

There are signs of the potential formation of a longer-term base with the market trading down into a meaningful longer-term support zone. Only a monthly close below 0.5500 would give reason for rethink. A monthly close back above 0.7000 will take the big picture pressure off the downside and strengthen case for a bottom.

AUDUSD Chart
R2 0.6550 - 25 November 2024 high - Strong
R1 0.6538 - 26 May/2025 high - Medium
S1 0.6344 - 24 April low - Medium
S1 0.6275 - 14 April low - Strong
AUDUSD: fundamental overview

There have been more calls for a stronger Australian dollar against the U.S. dollar, driven by Australia’s better economic growth outlook, which isn’t fully priced into the Aussie’s recent slight gains. Australia’s April CPI stayed at 2.4% year-on-year, above the expected 2.3%, with trimmed mean CPI at 2.8%, signaling steady inflation that may delay RBA rate cuts. The RBA is expected to hold rates in July, with a possible cut in August, and banks predict a year-end cash rate of 3.10%–3.35%.

 
Suggested reading

Can he do it again with OpenAI?, J. Mathis, The Week (May 25, 2025)

Multi-level marketing is a scam, D. Solovieva, Salon (May 21, 2025)


Any opinions, news, research, analyses, prices or other information ("information") contained on this Blog, constitutes marketing communication and it has not been prepared in accordance with legal requirements designed to promote the independence of investment research. Further, the information contained within this Blog does not contain (and should not be construed as containing) investment advice or an investment recommendation, or an offer of, or solicitation for, a transaction in any financial instrument. LMAX Group has not verified the accuracy or basis-in-fact of any claim or statement made by any third parties as comments for every Blog entry.

LMAX Group will not accept liability for any loss or damage, including without limitation to, any loss of profit, which may arise directly or indirectly from use of or reliance on such information. No representation or warranty is given as to the accuracy or completeness of the above information. While the produced information was obtained from sources deemed to be reliable, LMAX Group does not provide any guarantees about the reliability of such sources. Consequently any person acting on it does so entirely at his or her own risk. It is not a place to slander, use unacceptable language or to promote LMAX Group or any other FX and CFD provider and any such postings, excessive or unjust comments and attacks will not be allowed and will be removed from the site immediately.

Day Image
27th May 2025 | view in browser
Trading activity to pick up post holiday break

Trading activity is expected to pick up today as the UK and US markets return from holiday. The Yen has maintained a mild bid tone against a weakening US dollar, driven by market-based exchange rate agreements and easing trade tensions.


Performance chart 30day v. USD (%)
Performance Chart
 
 
Technical & fundamental highlights
EURUSD: technical overview

The Euro has finally broken out from a multi-month consolidation off a critical longer-term low. This latest push through the 2023 high lends further support to the case for a meaningful bottom, setting the stage for a bullish structural shift and the next major upside extension targeting the 2021 high at 1.2350. Setbacks should be exceptionally well supported below 1.1000.

EURUSD Chart
R2 1.1474 - 11 April high - Medium
R1 1.1419 - 26 May high - Medium
S1 1.1131 - 16 May low - Medium
S2 1.1065 - 12 May low - Medium
EURUSD: fundamental overview

ECB President Christine Lagarde highlighted the potential for the euro to rival the US dollar, citing benefits like increased investment, lower borrowing costs, and protection from exchange rate fluctuations and sanctions. To achieve this, Europe must deepen its capital markets, strengthen legal and institutional frameworks, enhance military capabilities, and promote the euro in international trade through new agreements and improved payment systems. While joint borrowing, as seen in the COVID-19 recovery fund, faces resistance, particularly from Germany, it could pave the way for Eurobonds, strengthening the euro’s global role. ECB officials also noted the possibility of a June rate cut, with inflation risks leaning lower, and emphasized that uncertainty and potential US tariffs could impact the global economy. Eurozone economic data expected today may show slight improvements in economic and industrial confidence but a dip in services, while Germany’s consumer confidence is likely to continue its upward trend, reflecting growing optimism.

 
USDJPY: technical overview

There are signs of a meaningful top in place after the market put in a multi-year high in 2024. At this point, the door is now open for a deeper setback below the 2024 low at 139.58 over the coming sessions exposing a retest of the 2023 low. Rallies should be well capped below 150.00.

USDJPY Chart
R2 148.65 - 12 May high - Medium
R1 146.19 - 9 May high - Medium
S1 142.11 - 27 May low - Medium
S2 141.97 - 29 April low - Medium
USDJPY: fundamental overview

The CFTC data shows a slight reduction in net yen longs, though positioning remains near record highs, suggesting a need for significant yen-positive or dollar-negative news to sustain short positions. Bank of Japan Governor Ueda expressed cautious optimism about nearing the inflation target, supported by April’s core inflation rising to 3.5% year-on-year, with Tokyo’s May CPI expected to show further price pressures, potentially paving the way for rate hikes. However, former BOJ board member Sayuri Shirai warns that a fragile economy and weak domestic demand could limit the BOJ’s rate hike window, especially with a critical election looming for PM Ishiba amid falling approval ratings. Successful trade negotiations, particularly resolving auto tariffs before the July 9 deadline, could bolster the case for a BOJ rate hike at its July meeting, with Japan’s trade negotiator aiming for progress at the G7 summit in June.

 
AUDUSD: technical overview

There are signs of the potential formation of a longer-term base with the market trading down into a meaningful longer-term support zone. Only a monthly close below 0.5500 would give reason for rethink. A monthly close back above 0.7000 will take the big picture pressure off the downside and strengthen case for a bottom.

AUDUSD Chart
R2 0.6550 - 25 November 2024 high - Strong
R1 0.6538 - 26 May/2025 high - Medium
S1 0.6344 - 24 April low - Medium
S1 0.6275 - 14 April low - Strong
AUDUSD: fundamental overview

Former President Trump’s recent threats of 50% tariffs on EU imports and 25% duties on foreign-made smartphones have reignited concerns about trade uncertainty, potentially driven by his push for tariff revenues to fund his proposed “Big Beautiful Bill” or a tougher negotiating stance, which could pressure the US dollar. RBA Deputy Governor Andrew Hauser noted that Australia has seen minimal direct impact from these trade disruptions so far, with stable economic indicators, and some Australian firms see opportunities in the US-China trade rift to gain a competitive edge in China. However, he cautioned that increased competition from Chinese firms redirecting goods from the US could pose future challenges. Australian inflation data, due tomorrow, is expected to soften, supporting predictions of RBA rate cuts later this year, with forecasts pointing to a year-end cash rate of 3.10%–3.35%.

 
Suggested reading

If They’re Telling You Why, They Don’t Know Why, J. Tamny, Forbes (May 25, 2025)

The Dumb Money Isn’t So Dumb Anymore, B. Carlson, AWOCS (May 22, 2025)


Any opinions, news, research, analyses, prices or other information ("information") contained on this Blog, constitutes marketing communication and it has not been prepared in accordance with legal requirements designed to promote the independence of investment research. Further, the information contained within this Blog does not contain (and should not be construed as containing) investment advice or an investment recommendation, or an offer of, or solicitation for, a transaction in any financial instrument. LMAX Group has not verified the accuracy or basis-in-fact of any claim or statement made by any third parties as comments for every Blog entry.

LMAX Group will not accept liability for any loss or damage, including without limitation to, any loss of profit, which may arise directly or indirectly from use of or reliance on such information. No representation or warranty is given as to the accuracy or completeness of the above information. While the produced information was obtained from sources deemed to be reliable, LMAX Group does not provide any guarantees about the reliability of such sources. Consequently any person acting on it does so entirely at his or her own risk. It is not a place to slander, use unacceptable language or to promote LMAX Group or any other FX and CFD provider and any such postings, excessive or unjust comments and attacks will not be allowed and will be removed from the site immediately.

Day Image
26th May 2025 | view in browser
Trump tariffs spark market jitters….again

Global markets face a turbulent landscape as Trump’s trade threats, rising bond yields, and shifting monetary policies in Japan and the U.S. drive uncertainty, with U.S. and UK market closures for Memorial Day and Spring Bank Holiday amplifying volatility ahead of key economic data releases.


Performance chart 30day v. USD (%)
Performance Chart
 
 
Technical & fundamental highlights
EURUSD: technical overview

The Euro has finally broken out from a multi-month consolidation off a critical longer-term low. This latest push through the 2023 high lends further support to the case for a meaningful bottom, setting the stage for a bullish structural shift and the next major upside extension targeting the 2021 high at 1.2350. Setbacks should be exceptionally well supported below 1.1000.

EURUSD Chart
R2 1.1474 - 11 April high - Medium
R1 1.1419 - 26 May high - Medium
S1 1.1131 - 16 May low - Medium
S2 1.1065 - 12 May low - Medium
EURUSD: fundamental overview

Initially, tariff threats from former President Trump caused the U.S. dollar to strengthen against other currencies, but his recent proposal to impose tariffs on European goods unexpectedly boosted the Euro against the dollar. Despite expectations of stable 10% tariffs and upcoming trade deals before the July deadline, markets were reminded of ongoing trade war uncertainties, prompting a shift toward safe-haven assets. Meanwhile, Eurozone wage growth slowed to 2.4% in Q1 from 4.1% in Q4 2024, signaling cooling service prices and reinforcing ECB confidence in reaching their 2% inflation target, with an expected rate cut on June 5 and traders anticipating 2-3 additional cuts this year. Key upcoming data includes Germany’s June Gfk Consumer Confidence, May inflation figures from several EU countries, and EU-wide confidence surveys.

 
USDJPY: technical overview

There are signs of a meaningful top in place after the market put in a multi-year high in 2024. At this point, the door is now open for a deeper setback below the 2024 low at 139.58 over the coming sessions exposing a retest of the 2023 low. Rallies should be well capped below 150.00.

USDJPY Chart
R2 148.65 - 12 May high - Medium
R1 146.19 - 9 May high - Medium
S1 142.23 - 26 May low - Medium
S2 141.97 - 29 April low - Medium
USDJPY: fundamental overview

Japanese government bond yields, particularly for 20-year and 30-year bonds, have surged to record highs of 2.605% and 3.204%, respectively, raising concerns about a potential yen carry trade unwind as Japanese investors may repatriate capital from global assets like U.S. Treasuries and equities. April’s core inflation rose to 3.5% year-on-year, exceeding expectations, with persistent price pressures from food, labor, and energy, and upcoming Tokyo CPI data for May likely to show further increases, intensifying pressure on the Bank of Japan for a potential rate hike. However, weak domestic demand and a possible technical recession complicate the BOJ’s decision, with a narrow window for action before the July election and “Liberation Day” tariff deadline. Japan’s trade negotiations with the U.S., including discussions around auto tariffs and Nippon Steel’s proposed $14.1 billion acquisition of U.S. Steel, could influence BOJ policy if resolved favorably by the G7 meeting in June. This week, investors will watch Japan’s 40-year bond auction, BOJ bond-buying operations, and April PPI Services data, expected to show a 3.0% year-on-year rise, reflecting ongoing pricing pressures tempered by low business confidence.

 
AUDUSD: technical overview

There are signs of the potential formation of a longer-term base with the market trading down into a meaningful longer-term support zone. Only a monthly close below 0.5500 would give reason for rethink. A monthly close back above 0.7000 will take the big picture pressure off the downside and strengthen case for a bottom.

AUDUSD Chart
R2 0.6550 - 25 November 2024 high - Strong
R1 0.6538 - 26 May/2025 high - Medium
S1 0.6344 - 24 April low - Medium
S1 0.6275 - 14 April low - Strong
AUDUSD: fundamental overview

President Trump’s recent threats of 50% tariffs on European imports and 25% duties on foreign-made smartphones have reignited market concerns about trade uncertainties tied to the “Liberation Day” tariffs, leading to a weaker U.S. dollar and gains for the Australian Dollar. Reserve Bank of Australia Deputy Governor Andrew Hauser noted that while Australia has seen little direct impact from global trade disruptions so far, the RBA is ready to adjust policy if needed, and some Australian firms see opportunities to gain a competitive edge in China due to U.S.-China trade tensions. Australian inflation data, due Wednesday, is expected to soften, supporting predictions of RBA rate cuts later this year, with major banks forecasting a year-end cash rate of 3.10% to 3.35%.

 
Suggested reading

OpenAI Make a Long-Shot Bet to Kill the iPhone, D. Lee, Bloomberg (May 24, 2025)

America’s Sports Betting Boom Is About to Backfire, N. Devor, Barrons (May 23, 2025)


Any opinions, news, research, analyses, prices or other information ("information") contained on this Blog, constitutes marketing communication and it has not been prepared in accordance with legal requirements designed to promote the independence of investment research. Further, the information contained within this Blog does not contain (and should not be construed as containing) investment advice or an investment recommendation, or an offer of, or solicitation for, a transaction in any financial instrument. LMAX Group has not verified the accuracy or basis-in-fact of any claim or statement made by any third parties as comments for every Blog entry.

LMAX Group will not accept liability for any loss or damage, including without limitation to, any loss of profit, which may arise directly or indirectly from use of or reliance on such information. No representation or warranty is given as to the accuracy or completeness of the above information. While the produced information was obtained from sources deemed to be reliable, LMAX Group does not provide any guarantees about the reliability of such sources. Consequently any person acting on it does so entirely at his or her own risk. It is not a place to slander, use unacceptable language or to promote LMAX Group or any other FX and CFD provider and any such postings, excessive or unjust comments and attacks will not be allowed and will be removed from the site immediately.

Day Image
23rd May 2025 | view in browser
Trump tax bill sparks treasury turbulence

President Trump’s tax legislation initially triggered a Treasuries sell-off, but markets calmed as attention shifted to U.S. economic indicators, though Senate revisions—broadening tax breaks and reinstating program funding—could increase deficits, potentially provoking a bond market reaction.


Performance chart 30day v. USD (%)
Performance Chart
 
 
Technical & fundamental highlights
EURUSD: technical overview

The Euro has finally broken out from a multi-month consolidation off a critical longer-term low. This latest push through the 2023 high lends further support to the case for a meaningful bottom, setting the stage for a bullish structural shift and the next major upside extension targeting the 2021 high at 1.2350. Setbacks should be exceptionally well supported below 1.1000.

EURUSD Chart
R2 1.1474 - 11 April high - Medium
R1 1.1382 - 6 May high - Medium
S1 1.1131 - 16 May low - Medium
S2 1.1065 - 12 May low - Medium
EURUSD: fundamental overview

After three consecutive days of gains, traders took profits following weaker-than-expected Eurozone and German PMI data, though markets stabilized in today’s Asian session. The Eurozone Composite PMI slipped to 49.5 in May, signaling the first contraction in private sector activity this year, driven by a sharp decline in services (48.9), despite a slight improvement in manufacturing (49.4). Germany, the Eurozone’s largest economy, mirrored this trend with its Composite PMI at 48.6, as services weakened further, though manufacturing showed signs of stabilizing at a 33-month high. ECB minutes from April reveal a strong inclination toward further monetary easing, with expected rate cuts of 26 basis points in June and possibly September, aiming for a terminal rate of 1.75%, though decisions remain data-dependent amid concerns over U.S. tariffs and their uncertain impact on inflation. Analysts forecast sluggish Eurozone growth of 0.8% in 2025, with PMI expected to hover around 49.1 by mid-2025, improving to 51.0 by 2026, while Germany’s IFO Business Climate Index rose to 87.5, buoyed by optimism in export industries despite tariff tensions. Upcoming German data, including Q1 GDP and spending figures, will provide further insight into the region’s economic trajectory.

 
USDJPY: technical overview

There are signs of a meaningful top in place after the market put in a multi-year high in 2024. At this point, the door is now open for a deeper setback below the 2024 low at 139.58 over the coming sessions exposing a retest of the 2023 low. Rallies should be well capped below 150.00.

USDJPY Chart
R2 148.65 - 12 May high - Medium
R1 146.19 - 9 May high - Medium
S1 142.80 - 22 May low - Medium
S2 142.35 - 6 May low - Medium
USDJPY: fundamental overview

Japanese government bond yields have surged to record highs, with 20-year JGBs reaching 2.599% and 30-year JGBs hitting 3.204%, raising concerns about a potential yen carry trade unwind as Japanese investors may repatriate capital from global markets, particularly U.S. Treasuries and equities, if yields become attractive enough. The Bank of Japan could stabilize its yield curve by allowing U.S. Treasury holdings to mature without reinvesting, potentially strengthening the yen, though aggressive sales are unlikely amid U.S. trade talks. Despite official statements from U.S. and Japanese officials that exchange rates should be market-driven, speculation persists about a tacit agreement for yen appreciation to address trade imbalances, fueled by Trump’s criticism of Asian currency manipulation. BOJ’s Asahi Noguchi advocates a cautious, data-driven approach to rate hikes, citing increased risks from U.S. “Liberation Day” tariffs, while April’s hotter-than-expected inflation (core CPI at 3.5% YoY) strengthens the case for tighter policy. However, former BOJ member Sayuri Shirai warns that fragile domestic demand and a potential recession may limit the BOJ’s rate hike window, with a successful U.S. trade deal by July 9 potentially paving the way for a BOJ rate hike in July.

 
AUDUSD: technical overview

There are signs of the potential formation of a longer-term base with the market trading down into a meaningful longer-term support zone. Only a monthly close below 0.5500 would give reason for rethink. A monthly close back above 0.7000 will take the big picture pressure off the downside and strengthen case for a bottom.

AUDUSD Chart
R2 0.6550 - 25 November high - Strong
R1 0.6515 - 7 May/2025 high - Medium
S1 0.6344 - 24 April low - Medium
S1 0.6275 - 14 April low - Strong
AUDUSD: fundamental overview

Reserve Bank of Australia Deputy Governor Andrew Hauser stated that the RBA is ready to implement policy measures if the global impact of Trump administration tariffs significantly affects Australia, though current forward indicators show no major local disruptions. He noted that many Australian firms view the U.S.-China trade tensions as an opportunity to strengthen their competitive position in the Chinese market.

 
Suggested reading

Japan’s population crisis reaches tipping point, T. Griggs, Financial Times (May 23, 2025)

Investors should be more worried about Japan, V. Chen, MarketWatch (May 22, 2025)


Any opinions, news, research, analyses, prices or other information ("information") contained on this Blog, constitutes marketing communication and it has not been prepared in accordance with legal requirements designed to promote the independence of investment research. Further, the information contained within this Blog does not contain (and should not be construed as containing) investment advice or an investment recommendation, or an offer of, or solicitation for, a transaction in any financial instrument. LMAX Group has not verified the accuracy or basis-in-fact of any claim or statement made by any third parties as comments for every Blog entry.

LMAX Group will not accept liability for any loss or damage, including without limitation to, any loss of profit, which may arise directly or indirectly from use of or reliance on such information. No representation or warranty is given as to the accuracy or completeness of the above information. While the produced information was obtained from sources deemed to be reliable, LMAX Group does not provide any guarantees about the reliability of such sources. Consequently any person acting on it does so entirely at his or her own risk. It is not a place to slander, use unacceptable language or to promote LMAX Group or any other FX and CFD provider and any such postings, excessive or unjust comments and attacks will not be allowed and will be removed from the site immediately.

Day Image
22nd May 2025 | view in browser
US bond auction flops as fiscal fears grow

The U.S. government’s $16 billion 20-year bond auction, the first major sale since Moody’s downgraded the U.S. credit rating, yielded a 1.2 basis point tail despite offering over 5%, signaling investor unease with fiscal irresponsibility, leading to sell-offs in the dollar, U.S. equities, and Treasuries.


Performance chart 30day v. USD (%)
Performance Chart
 
 
Technical & fundamental highlights
EURUSD: technical overview

The Euro has finally broken out from a multi-month consolidation off a critical longer-term low. This latest push through the 2023 high lends further support to the case for a meaningful bottom, setting the stage for a bullish structural shift and the next major upside extension targeting the 2021 high at 1.2350. Setbacks should be exceptionally well supported below 1.1000.

EURUSD Chart
R2 1.1474 - 11 April high - Medium
R1 1.1382 - 6 May high - Medium
S1 1.1131 - 16 May low - Medium
S2 1.1065 - 12 May low - Medium
EURUSD: fundamental overview

The European Central Bank has warned that investor concerns over the riskiness of US assets, driven by Trump’s tariff policies, could destabilize global financial markets. The ECB’s Financial Stability Review noted unusual shifts away from safe-haven assets like the US dollar and Treasuries, signaling a potential “fundamental regime change” in global capital flows, with stretched US tech stock valuations adding to market vulnerabilities. Despite some easing of US-China trade tensions, uncertainties persist, prompting the ECB to lower interest rates to support growth as inflation nears its 2% target. Meanwhile, upcoming Eurozone PMI data for May is expected to show fragile recovery, with Germany’s Manufacturing PMI slightly improving to 48.8 and Services PMI rebounding to 49.5, while Eurozone Manufacturing and Services PMIs are forecast at 49.2 and 50.5, respectively, indicating modest expansion amid ongoing trade tensions and a stronger euro.

 
USDJPY: technical overview

There are signs of a meaningful top in place after the market put in a multi-year high in 2024. At this point, the door is now open for a deeper setback below the 2024 low at 139.58 over the coming sessions exposing a retest of the 2023 low. Rallies should be well capped below 150.00.

USDJPY Chart
R2 148.65 - 12 May high - Medium
R1 146.19 - 9 May high - Medium
S1 143.14 - 22 May low - Medium
S2 142.35 - 6 May low - Medium
USDJPY: fundamental overview

Yields on long-dated Japanese Government Bonds (JGBs) have surged to a 20-year high of 2.845% for the 30-year bond, raising speculation about when Japanese investors, holding over $1 trillion in U.S. Treasuries, might repatriate capital due to attractive domestic yields and U.S. policy uncertainties under Trump’s tariffs. Japan could stabilize its yield curve by letting U.S. Treasury holdings mature without reinvesting, potentially strengthening the yen without aggressive monetary actions. Despite U.S.-Japan talks affirming market-driven exchange rates, trade negotiations and a weakening South Korean won may support yen appreciation, as traders anticipate currency adjustments to address U.S. concerns over Asian export advantages. The Bank of Japan, as noted by board member Asahi Noguchi, favors gradual rate hikes, cautious of risks from Trump’s “Liberation Day” tariffs due July 9, 2025, while former BOJ member Sayuri Shirai warns that high inflation expected this Friday could force faster policy normalization. May’s PMI data—Composite at 49.8, Manufacturing at 49.0, and Services at 50.8—signals economic weakness, but a successful trade deal could pave the way for a BOJ rate hike in July, boosting yen bullishness.

 
AUDUSD: technical overview

There are signs of the potential formation of a longer-term base with the market trading down into a meaningful longer-term support zone. Only a monthly close below 0.5500 would give reason for rethink. A monthly close back above 0.7000 will take the big picture pressure off the downside and strengthen case for a bottom.

AUDUSD Chart
R2 0.6550 - 25 November high - Strong
R1 0.6515 - 7 May/2025 high - Medium
S1 0.6344 - 24 April low - Medium
S1 0.6275 - 14 April low - Strong
AUDUSD: fundamental overview

The Reserve Bank of Australia has shifted its stance from cautious rate cuts to signaling readiness for faster reductions if economic conditions weaken, prompting markets to anticipate a cut as early as July, potentially lowering rates to 3.1% by year-end with three cuts, though some expect only one or two unless the economy deteriorates significantly. Recent data shows a mixed picture: April’s Westpac Leading Index slightly improved to -0.01%, while May’s PMI Composite dipped to 50.6, with Manufacturing steady at 51.7 and Services at 50.5, indicating modest growth. Bloomberg’s survey of 45 economists projects Australia’s economy to grow 1.8% in 2025, 2.3% in 2026, and 2.5% in 2027, with an 18% recession risk over the next year, stable Q1 2025 GDP at 0.5%, and CPI forecasts at 2.5% for 2025 and 2.7% for 2026, with the RBA rate expected at 3.60% by Q3 2025 from the current 3.85%.

 
Suggested reading

Why we should welcome stock-market bubbles, M. Hulbert, MarketWatch (May 20, 2025)

The Tax Bill Could Add to the Deficit—and to Stock Gains, T. Rivas, Barron’s (May 20, 2025)


Any opinions, news, research, analyses, prices or other information ("information") contained on this Blog, constitutes marketing communication and it has not been prepared in accordance with legal requirements designed to promote the independence of investment research. Further, the information contained within this Blog does not contain (and should not be construed as containing) investment advice or an investment recommendation, or an offer of, or solicitation for, a transaction in any financial instrument. LMAX Group has not verified the accuracy or basis-in-fact of any claim or statement made by any third parties as comments for every Blog entry.

LMAX Group will not accept liability for any loss or damage, including without limitation to, any loss of profit, which may arise directly or indirectly from use of or reliance on such information. No representation or warranty is given as to the accuracy or completeness of the above information. While the produced information was obtained from sources deemed to be reliable, LMAX Group does not provide any guarantees about the reliability of such sources. Consequently any person acting on it does so entirely at his or her own risk. It is not a place to slander, use unacceptable language or to promote LMAX Group or any other FX and CFD provider and any such postings, excessive or unjust comments and attacks will not be allowed and will be removed from the site immediately.

Day Image
21st May 2025 | view in browser
Dollar under pressure as trade tensions rise

As global markets navigate heightened uncertainty, the U.S. dollar faces pressure from multiple fronts. Anticipation surrounds talks between U.S. Treasury Secretary Bessent and Japan’s Finance Minister Kato at the G7 Finance Ministers meeting, with speculation of dollar-negative outcomes tied to President Trump’s push against undervalued Asian currencies, seen as fueling trade surpluses.


Performance chart 30day v. USD (%)
Performance Chart
 
 
Technical & fundamental highlights
EURUSD: technical overview

The Euro has finally broken out from a multi-month consolidation off a critical longer-term low. This latest push through the 2023 high lends further support to the case for a meaningful bottom, setting the stage for a bullish structural shift and the next major upside extension targeting the 2021 high at 1.2350. Setbacks should be exceptionally well supported below 1.1000.

EURUSD Chart
R2 1.1474 - 11 April high - Medium
R1 1.1382 - 6 May high - Medium
S1 1.1131 - 16 May low - Medium
S2 1.1065 - 12 May low - Medium
EURUSD: fundamental overview

The European Central Bank views the euro’s recent strength as an opportunity, potentially tolerating further appreciation toward the 1.20 mark, as suggested by historical regression analysis. ECB Governing Council Member Pierre Wunsch indicated that cutting the main deposit rate to just below 2% by year-end could support the economy and prevent inflation from falling below target, amid risks from trade tensions and despite no immediate recession concerns. Increased government spending, such as Germany’s €500 billion infrastructure plan, may bolster recovery. Despite expectations of sustained U.S. Federal Reserve rates and further ECB cuts, narrowing yield differentials between Eurozone and U.S. 10-year bonds, alongside rising gold and yen, suggest a shift away from U.S. assets. Recent Eurozone data shows a rising current account surplus (€50.924 billion in March), slightly improved consumer confidence (-15.2 in May), and a modest 0.1% increase in construction output, signaling cautious economic improvement.

 
USDJPY: technical overview

There are signs of a meaningful top in place after the market put in a multi-year high in 2024. At this point, the door is now open for a deeper setback below the 2024 low at 139.58 over the coming sessions exposing a retest of the 2023 low. Rallies should be well capped below 150.00.

USDJPY Chart
R2 148.65 - 12 May high - Medium
R1 146.19 - 9 May high - Medium
S1 143.44 - 8 May low - Medium
S2 142.35 - 6 May low - Medium
USDJPY: fundamental overview

As President Trump’s Tax Cuts and Spending Bill approaches a House vote, markets are on edge, with the U.S. 10-year Treasury yield nearing 4.6%—a level that previously prompted Trump to ease reciprocal tariffs—potentially signaling volatility if breached, driving safe-haven flows to the yen. Ahead of the G7 Finance Ministers meeting in Canada, traders favor long yen positions, anticipating remarks from U.S. Treasury Secretary Scott Bessent and Japan’s Finance Minister Katsunobu Kato, though Tokyo sources suggest currency discussions will be minimal, potentially triggering short covering in USDJPY if no significant news emerges, given the high cost of holding short carry trades. A sell-off in the dollar, U.S. equity futures, and Treasuries reflects capital repatriation to Asia, with the yen benefiting amid reluctance to fund U.S. deficits. Japan’s April trade data reveals a deficit of ¥115.8 billion, below forecasts, with exports (2.0% YoY) and imports (-2.2% YoY) underperforming, driven by a 1.8% drop in shipments to the U.S., Japan’s top export market. U.S. auto tariffs threaten Japan’s economy, which produces 9 million cars annually, exporting 1.5 million to the U.S. and 1.4 million via Mexico and Canada, contributing to Q1 GDP contraction and complicating the Bank of Japan’s monetary normalization plans amid trade policy uncertainty.

 
AUDUSD: technical overview

There are signs of the potential formation of a longer-term base with the market trading down into a meaningful longer-term support zone. Only a monthly close below 0.5500 would give reason for rethink. A monthly close back above 0.7000 will take the big picture pressure off the downside and strengthen case for a bottom.

AUDUSD Chart
R2 0.6550 - 25 November high - Strong
R1 0.6515 - 7 May/2025 high - Medium
S1 0.6344 - 24 April low - Medium
S1 0.6275 - 14 April low - Strong
AUDUSD: fundamental overview

The Reserve Bank of Australia cut the Official Cash Rate by 25 basis points to 3.85%, as expected, but its less hawkish-than-anticipated rhetoric led to a drop in Australian yields, narrowing the 3-year Australia-U.S. yield spread and pressuring AUDUSD downward. The RBA downgraded its forecasts, projecting 4Q25 GDP growth at 2.1% (from 2.4%), inflation peaking at 3.1% in 2Q26 (down from 3.7% in 4Q25), and unemployment rising to 4.3% by year-end (up from 4.2%), with inflation now within the 2-3% target and wage growth expected to slow. This signals a shift toward prioritizing growth and employment over inflation control, with markets anticipating 2-3 additional rate cuts and the RBA prepared to act cautiously while monitoring global developments. Market focus is on the potential impact of Trump’s Tax Cuts and Spending Bill on bond markets and discussions between U.S. Treasury Secretary Bessent and Japan’s Finance Minister Kato at the G7 Finance Ministers meeting. Ongoing sell-offs in the dollar, U.S. equity futures, and Treasuries indicate capital flows back to Asia, benefiting antipodean currencies like the AUD amid reluctance to finance U.S. deficits.

 
Suggested reading

Moody’s Feels Blue, Downgrades US Debt, Fisher Investments (May 19, 2025)

New disruptor alert, S. McBride, RiskHedge (May 19, 2025)


Any opinions, news, research, analyses, prices or other information ("information") contained on this Blog, constitutes marketing communication and it has not been prepared in accordance with legal requirements designed to promote the independence of investment research. Further, the information contained within this Blog does not contain (and should not be construed as containing) investment advice or an investment recommendation, or an offer of, or solicitation for, a transaction in any financial instrument. LMAX Group has not verified the accuracy or basis-in-fact of any claim or statement made by any third parties as comments for every Blog entry.

LMAX Group will not accept liability for any loss or damage, including without limitation to, any loss of profit, which may arise directly or indirectly from use of or reliance on such information. No representation or warranty is given as to the accuracy or completeness of the above information. While the produced information was obtained from sources deemed to be reliable, LMAX Group does not provide any guarantees about the reliability of such sources. Consequently any person acting on it does so entirely at his or her own risk. It is not a place to slander, use unacceptable language or to promote LMAX Group or any other FX and CFD provider and any such postings, excessive or unjust comments and attacks will not be allowed and will be removed from the site immediately.