


|
||
| 9th April 2025 | view in browser | ||
| Tariffs, turmoil, and trades | ||
|
US equities, Treasuries, and the US dollar have all come under added pressure as worry around the outlook for the US economy and status of the US as a safe haven is called into question amidst all the turmoil around tariffs and trade wars. |
||
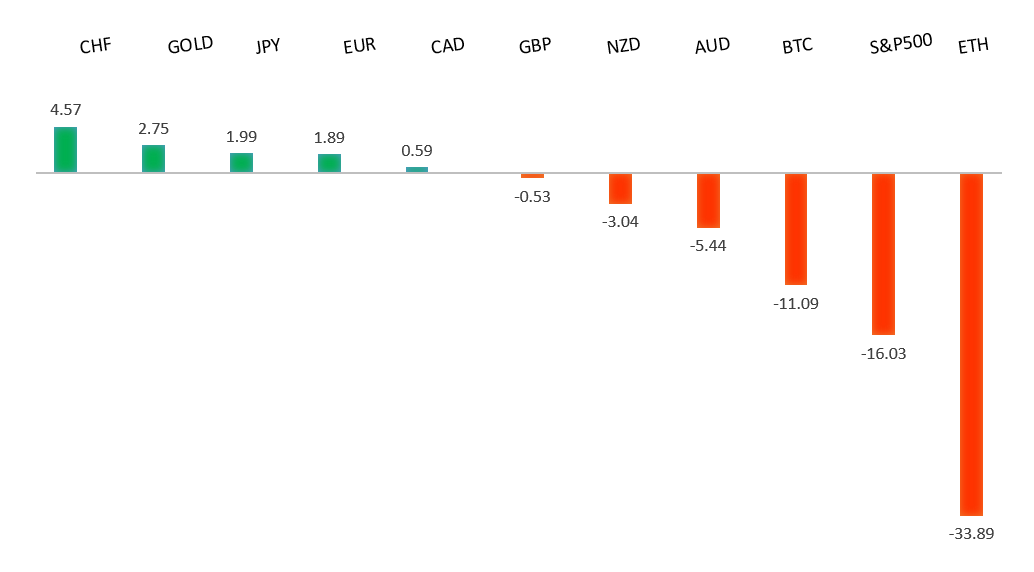
| Performance chart 30day v. USD (%) | ||
|
||
| Technical & fundamental highlights | ||
| EURUSD: technical overview | ||
|
The Euro has been in a multi-month consolidation since bottoming out in 2022. Setbacks have since been exceptionally well supported on dips towards parity, with a higher platform sought out ahead of the next major upside extension. Look for a push back towards the 2023 high at 1.1276 in the days ahead. Only a monthly close below 1.0000 negates. |
||

|
||
| R2 1.1148 - 3 April/2025 high - Strong - S1 1.0880 - 7 April low - Medium | ||
| R1 1.1108 - 4 April high - Medium - S2 1.0733 - 27 March low - Strong | ||
| EURUSD: fundamental overview | ||
|
The Euro continues to be a beneficiary of all of the turmoil around US trade tariffs, with market participants opting to find comfort in the single currency amidst President Trump’s 104% China tariff confirmation. The EU is preparing to counter President Trump’s 25% tariffs on steel and aluminum with levies next week, followed by a second phase addressing US tariffs on auto exports. Meanwhile, the ECB is expected to cut rates consecutively to 1.5%. Looking ahead, key standouts on the calendar come from ECB speak, Fed speak, and the Fed Minutes late in the day. |
||
| GBPUSD: technical overview | ||
|
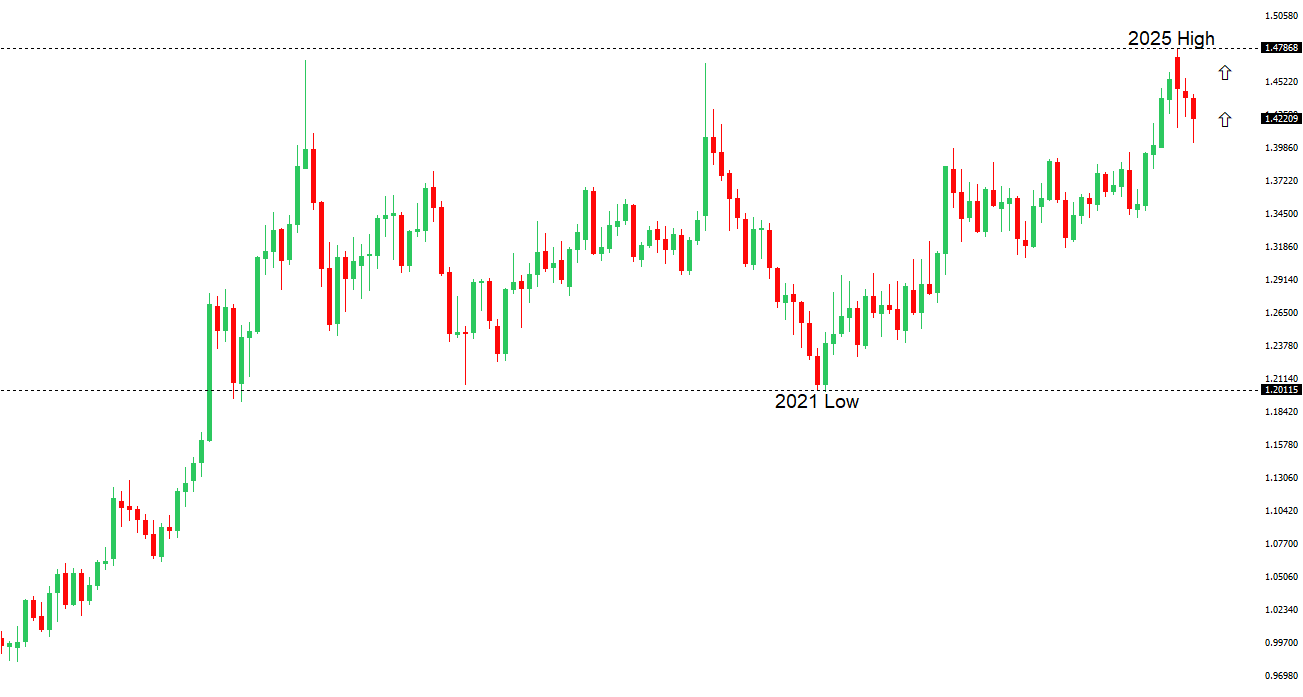
Signs have emerged of the market wanting to put in a longer-term base after collapsing to a record low in September 2022. The door is now open for the next major upside extension towards the 2018 high at 1.4377. Setbacks should be well supported above 1.2000 on a monthly close basis. |
||

|
||
| R2 1.3208 - 3 April/2025 high - Strong - S1 1.2708 - 7 April low - Medium | ||
| R1 1.2934 - 7 April high - Medium - S2 1.2679 - 4 March low - Medium | ||
| GBPUSD: fundamental overview | ||
|
The Pound has been a beneficiary of fallout from the US Dollar on the back of unpredictability and uncertainty around the outlook for the US economy amidst an intense round of tariffs and escalation in trade tension. PM Starmer’s maintenance of a pragmatic, all hands on deck approach to negotiations with the US has also served to keep the Pound well supported into dips. Looking ahead, key standouts on the calendar come from ECB speak, Fed speak, and the Fed Minutes late in the day. |
||
| USDJPY: technical overview | ||
|
There are signs of a meaningful top in place after the market put in a multi-year high in 2024. At this point, the door is now open for a deeper setback towards the 140 area. |
||

|
||
| R2 148.15 - 7 April high - Strong - S1 144.55 - 4 April/2025 low - Medium | ||
| R1 146.35 - 9 April high - Medium - S2 144.00 - Figure - Medium | ||
| USDJPY: fundamental overview | ||
|
Following a call with President Trump, Japanese PM Ishiba secured Japan a spot on the “priority” list among roughly 70 countries vying to negotiate US tariffs, despite his concerns about their alignment with WTO and Japan-USA. trade agreements. President Trump’s appointment of Treasury Secretary Bessent and Trade Representative Greer to lead talks signals a potentially favorable and swift resolution for Japan, leveraging its role as a key US. ally and top investor, with hopes of milder tariff terms and discussions possibly involving a stronger yen. OIS markets are now expecting just 10 basis points of BOJ rate hikes for the year, largely dismissing earlier rate hike bets amid the tariff fallout. Looking ahead, key standouts on the calendar come from ECB speak, Fed speak, and the Fed Minutes late in the day. |
||
| AUDUSD: technical overview | ||
|
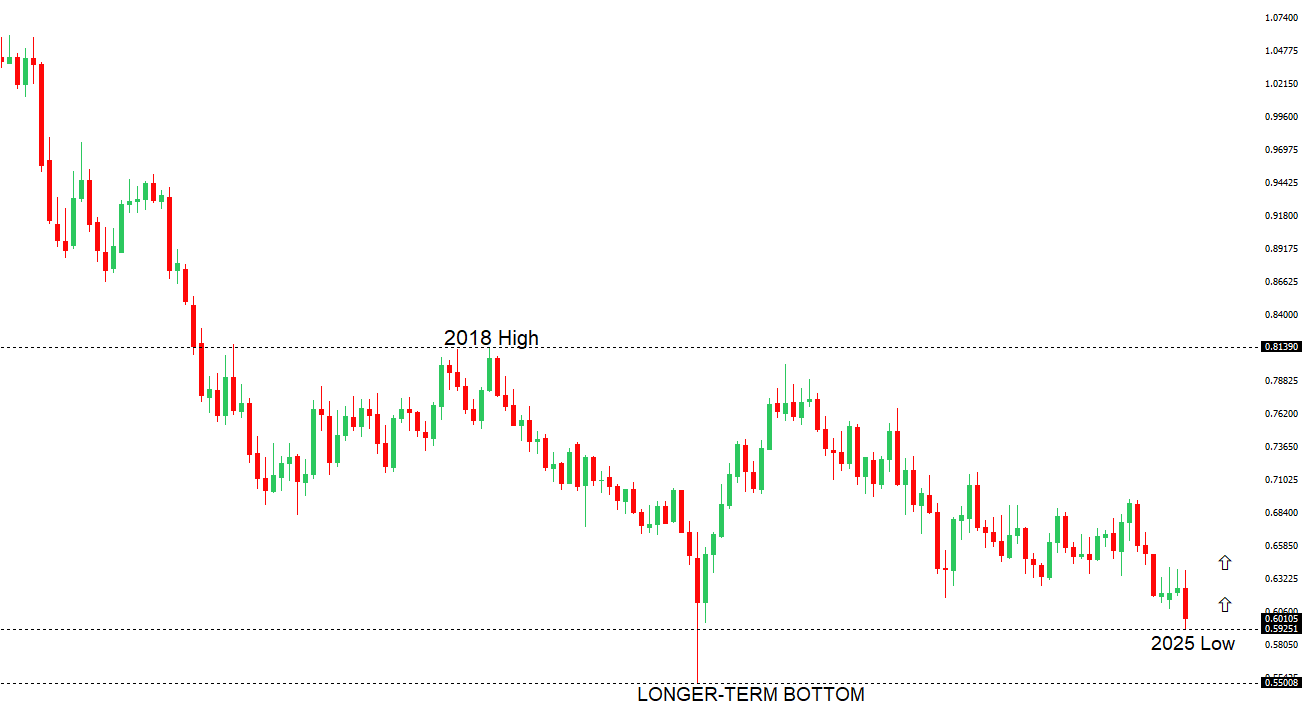
There are signs of the potential formation of a longer-term base with the market trading down into a meaningful longer-term support zone. Only a monthly close below 0.5500 would give reason for rethink. A monthly close back above 0.7000 will take the big picture pressure off the downside and strengthen case for a bottom. |
||
|
||
| R2 0.6128 - 7 April high - Strong - S1 0.5914 - 9 April/2025 low - Strong | ||
| R1 0.6086 - 8 April high - Medium - S2 0.5900 - Figure - Medium | ||
| AUDUSD: fundamental overview | ||
|
The Australian Dollar has sunk to yet another yearly low and sits at its lowest level against the US Dollar since 2020. The risk correlated commodity currency has been unable to ignore fallout in US equity markets and global risk reduction on the back of an intensification of trade wars. The latest US +100% tariff on China is driving fresh Aussie selling given the Australian economy’s close relationship with China as its top trading partner. Futures markets now anticipate the RBA will slash rates in May, July, and August, with two more cuts to follow thereafter. Looking ahead, key standouts on the calendar come from ECB speak, Fed speak, and the Fed Minutes late in the day. |
||
| USDCAD: technical overview | ||
|
A sustained hold above 1.3000 over the past several months signals an end to a period of longer-term bearish consolidation and suggests the market is in the process of carving out a more significant longer-term base. Next key resistance now comes in at the 1.5000 psychological barrier. Setbacks should be very well supported ahead of 1.4000. |
||
|
||
| R2 1.4416 - 1 April high - Strong - S1 1.4151 - 14 April low - Medium | ||
| R1 1.4319 - 3 April high - Medium - S2 1.4027 - 3 April/2025 low - Strong | ||
| USDCAD: fundamental overview | ||
|
The Canadian Dollar has done a formidable job shaking off the latest downside risk from lower US equities and lower oil on the back of escalating global trade tensions. It seems the Loonie is more focused on the fact that Canada may have avoided additional tariffs from the Trump administration. Looking ahead, key standouts on the calendar come from ECB speak, Fed speak, and the Fed Minutes late in the day. |
||
| NZDUSD: technical overview | ||
|
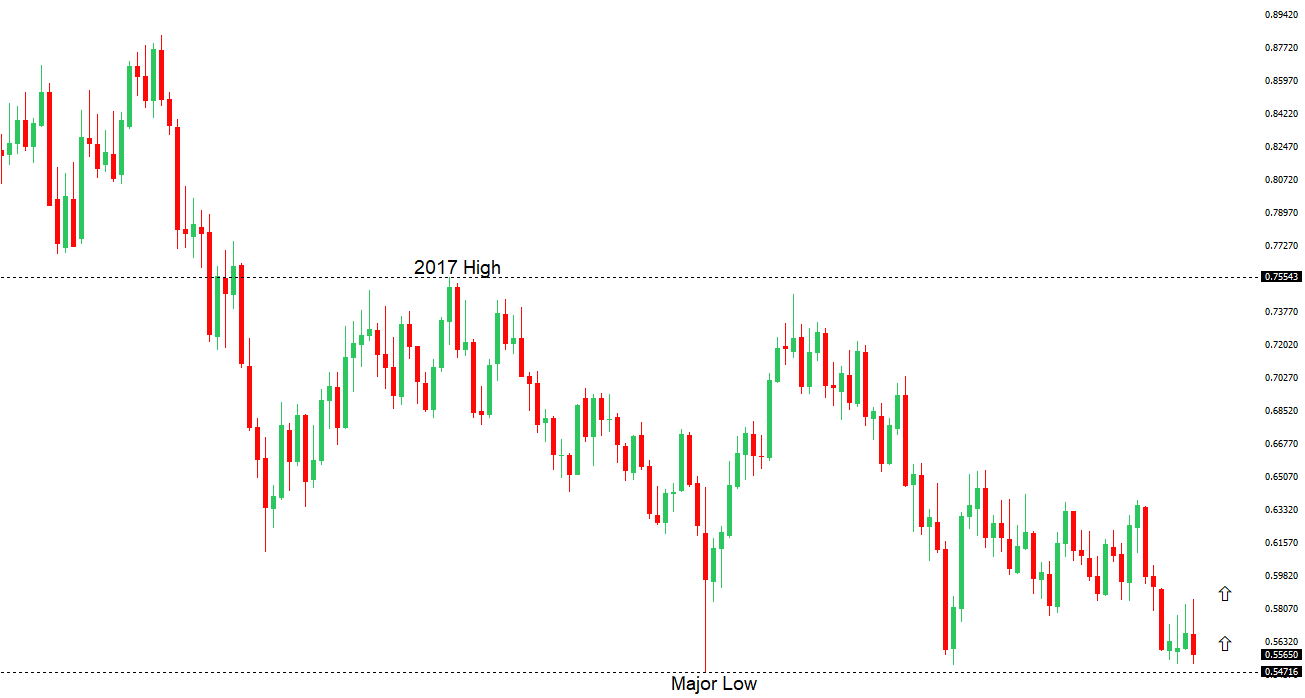
Overall pressure remains on the downside with the market continuing to stall out on runs up into the 0.6500 area. At the same time, there are some signs of the market wanting to put in a longer-term base. Ultimately, a break back above 0.6500 would be required to take the medium-term pressure off the downside and encourage this prospect. A monthly close below 0.5469 will intensify bearish price action. |
||
|
||
| R2 0.5798 - 4 April high - Medium - S1 0.5485 - 9 April/2025 low - Strong | ||
| R1 0.5648 - 31 March low - Medium - S2 0.5469 - 2020 low - Very Strong | ||
| NZDUSD: fundamental overview | ||
|
The New Zealand Dollar extended its decline to another yearly low earlier today, on the back of a fresh wave of risk off flow from escalating tensions on the global trade front. Meanwhile, the RBNZ went ahead and cut rates 25 basis points as widely expected and looks set to increase the pace of easing at the next meeting in May. The RBNZ considers US reciprocal tariffs a major threat to global economic growth and domestic inflation prospects, and noted there was room to cut the official cash rate further as the tariffs’ impacts unfold. Looking ahead, key standouts on the calendar come from ECB speak, Fed speak, and the Fed Minutes late in the day. |
||
| Suggested reading | ||
|
This Time, It Really Is the Tariffs, J. Rekenthaler, Morningstar (April 8, 2025) What to do about the tariff crash, C. Reilly, RiskHedge (April 7, 2025) |
||