


 | ||
| 7th September 2026 | view in browser | ||
| Thin holiday trade masks a busy macro week | ||
| Global markets open the week cautiously as strong US payrolls revive Fed hike expectations, escalating US-Iran tensions lift oil, and the Labor Day holiday leaves trading conditions thin. | ||
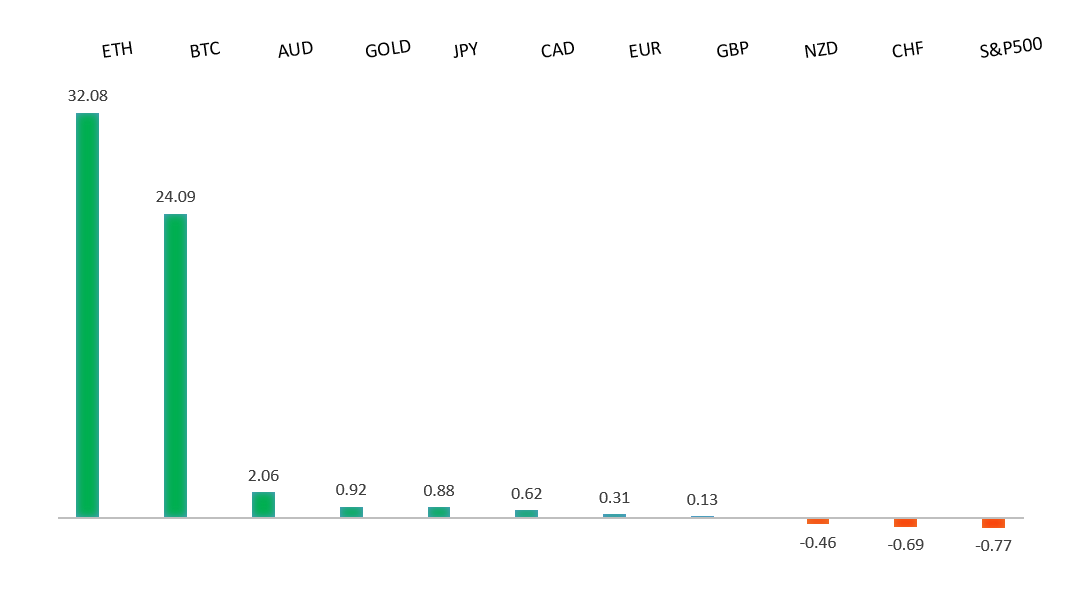
| Performance chart 30day v. USD (%) | ||
 | ||
| Technical & fundamental highlights | ||
| EURUSD: technical overview | ||
| The Euro outlook remains constructive with higher lows sought out on dips in favor of the next major upside extension targeting the 2021 high at 1.2350. Setbacks should be exceptionally well supported ahead of 1.1400. | ||
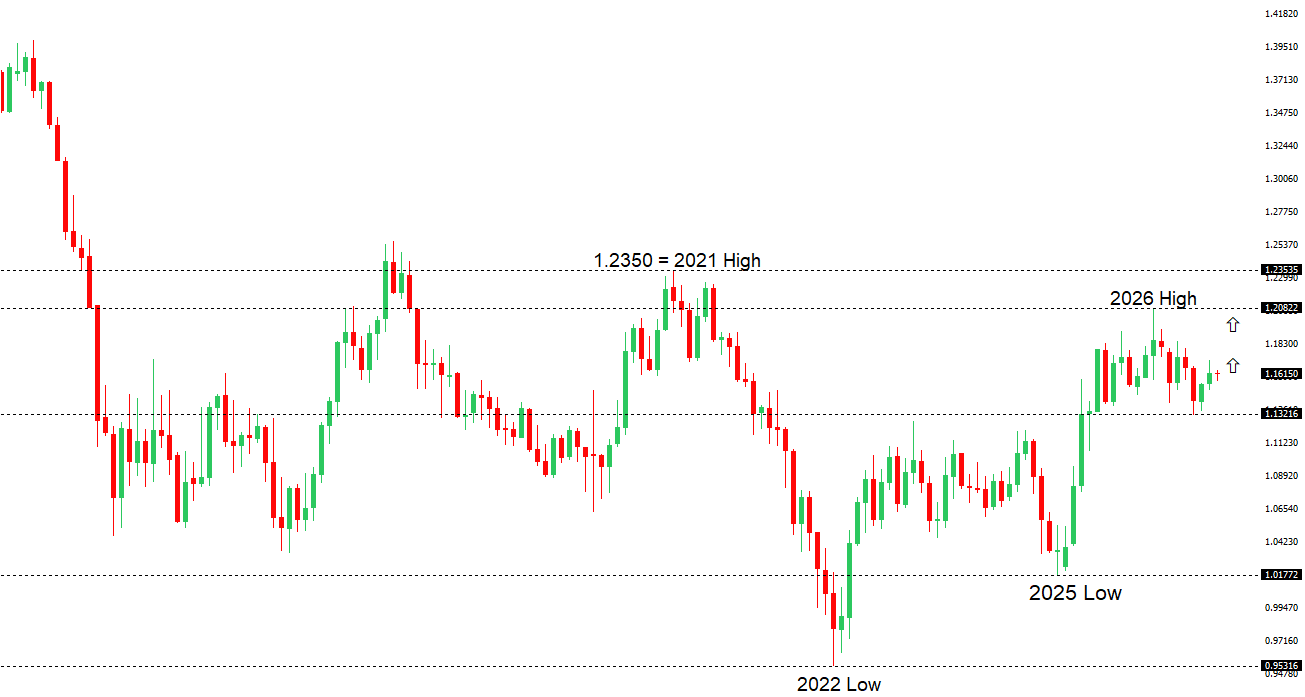 | ||
| R2 1.1712 - 21 August high - Strong R1 1.1660 - 27 August high - Medium S1 1.1566 - 2 September low - Medium S2 1.1512 - 313 August low - Strong | ||
| EURUSD: fundamental overview | ||
| The euro has been trading steadily around, with softer European growth signals offset by a more supportive ECB policy outlook and the dollar’s inability to sustain its post-payroll gains. German industrial production fell 1.1% in July against expectations for a 0.1% increase, driven by a partly temporary 9.2% slump in auto production, although weakness was broader, with capital and consumer goods output also declining. Excluding energy and construction, production fell 2.2%, but the three-month trend remained slightly positive, suggesting weakness rather than a fresh industrial collapse. Meanwhile, elevated energy prices are creating growth headwinds while also keeping inflation pressures high, reinforcing expectations for a 25-basis-point ECB rate hike on Thursday. The focus will be on President Lagarde’s guidance and whether the ECB leaves the door open to further tightening, while Friday’s US CPI report will be critical for determining whether stronger payrolls translate into a September Fed hike. | ||
| GBPUSD: technical overview | ||
| The Pound remains exceptionally well supported on dips into the 1.3000 area, with the price largely consolidating above the psychological barrier and previous resistance turned support in the form of the 2023 high. Look for the market to continue be well supported on dips ahead of the next major upside extension through the yearly high at 1.3870 and towards a retest of the 2018 high at 1.4377 further up. Only a monthly close below 1.3000 negates. | ||
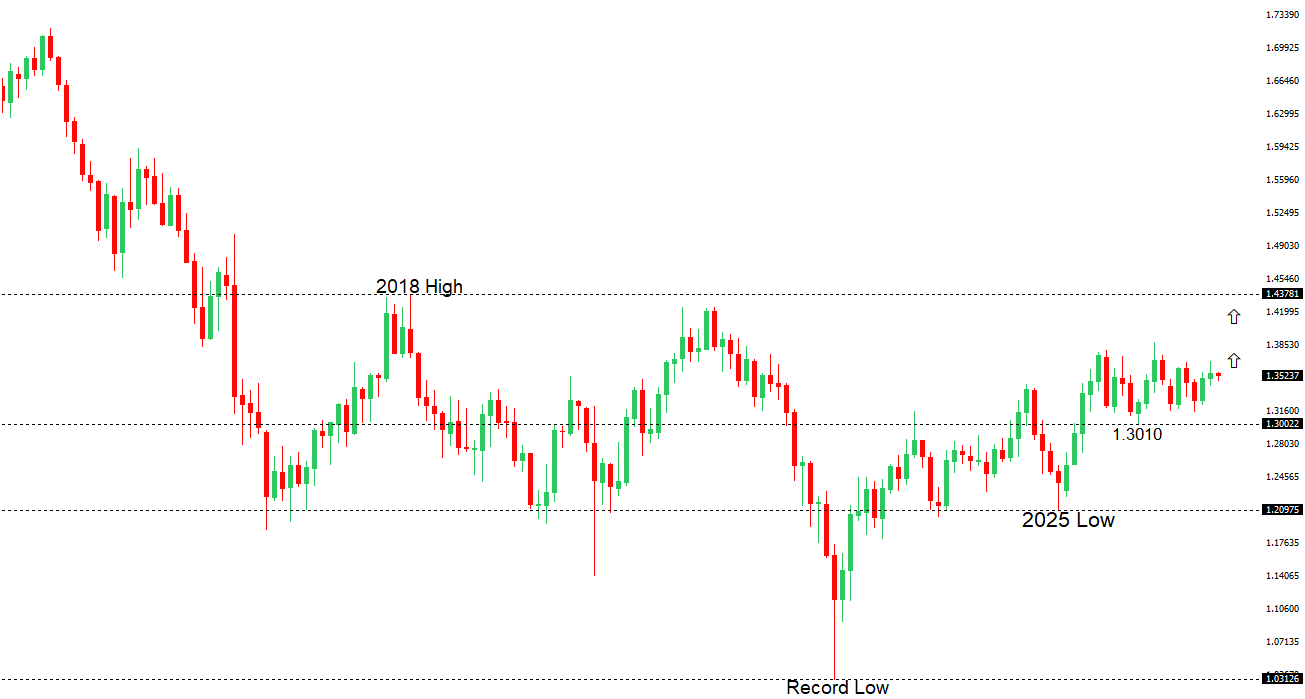 | ||
| R2 1.3676 - 21 August high - Strong R1 1.3566 - 31 August high - Medium S1 1.3474 - 13 August low - Medium S2 1.3400 - 31 July low - Medium | ||
| GBPUSD: fundamental overview | ||
| The pound has remained under modest pressure against the dollar, with GBPUSD struggling around 1.3500 as the greenback retains support from stronger-than-expected US payrolls and rising expectations that the Federal Reserve could raise rates in September. Escalating US-Iran tensions and associated energy-price risks have reinforced demand for the safe-haven dollar, while also posing a potential inflationary headwind for the UK economy. Sterling’s downside has nevertheless been limited by the Bank of England’s relatively hawkish stance and the absence of a clear domestic catalyst. Attention now turns to US inflation data for direction on Fed policy, followed by Friday’s UK monthly GDP report for a clearer reading on British growth and the BoE outlook. | ||
| USDJPY: technical overview | ||
| The major pair has entered a period of correction and consolidation after extending its run to fresh multi-decade highs at 163.99. Setbacks are now expected to be well supported around 155.00, with only a weekly close below to compromise the bullish structure. | ||
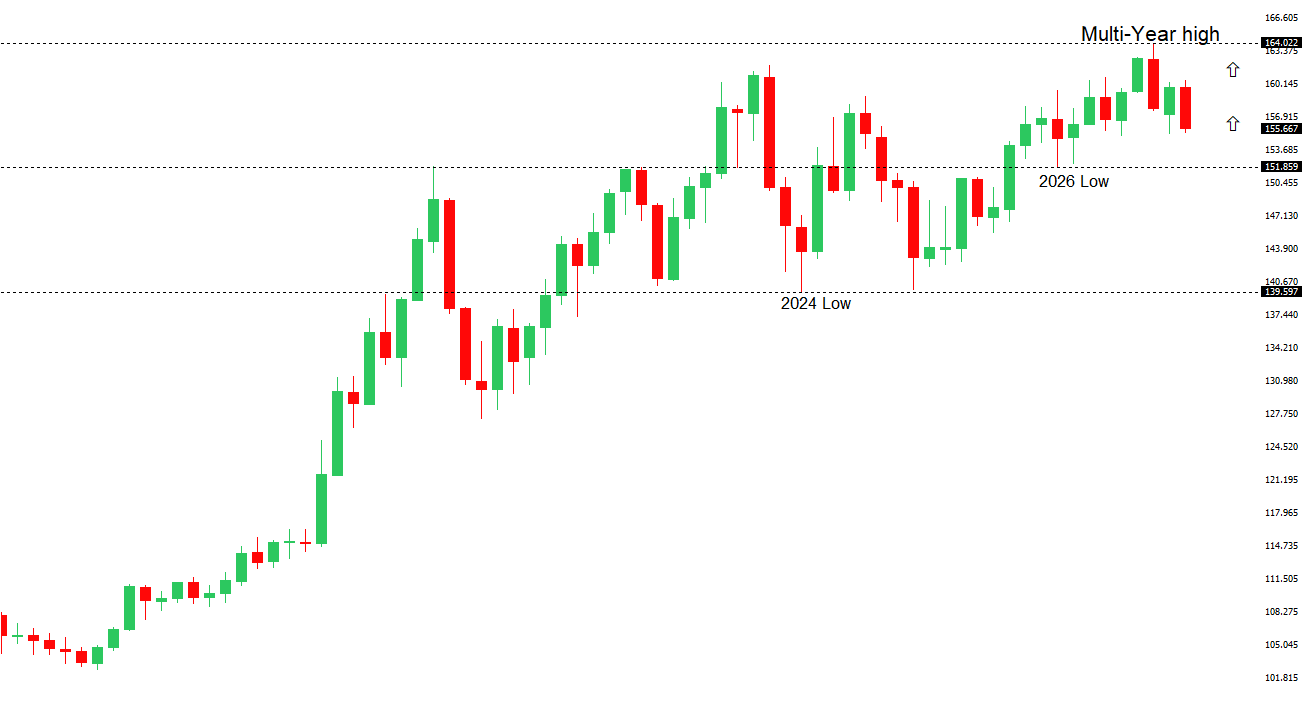 | ||
| R2 158.02 - 20 August low - Strong R1 157.00 - Figure - Medium S1 155.29 - 4 September low - Medium S2 155.00 - Figure - Strong | ||
| USDJPY: fundamental overview | ||
| The yen is consolidating near 156 against the dollar after outperforming sharply last week, with USDJPY falling from around 160 to 155.29. The move was driven primarily by a hawkish shift in Bank of Japan expectations after board member Takata left the door open to larger or back-to-back rate hikes, reinforcing speculation that the BoJ could tighten more aggressively as inflation pressures persist. Expectations for a September rate increase, potential capital repatriation and lingering intervention concerns have further discouraged yen-funded carry trades, although stronger US payrolls and renewed Fed tightening expectations have limited the yen’s advance. Attention now turns to Friday’s US CPI report, which will shape the US-Japan yield differential and likely determine whether the yen can extend its recovery. | ||
| AUDUSD: technical overview | ||
| There are signs of the formation of a longer-term base with the market recovering out from a meaningful longer-term support zone. The latest monthly close back above 0.7000 takes the big picture pressure off the downside and strengthens the case for a bottom, with the focus now on a push towards 0.8000. Setbacks should now be well supported ahead of 0.6700. | ||
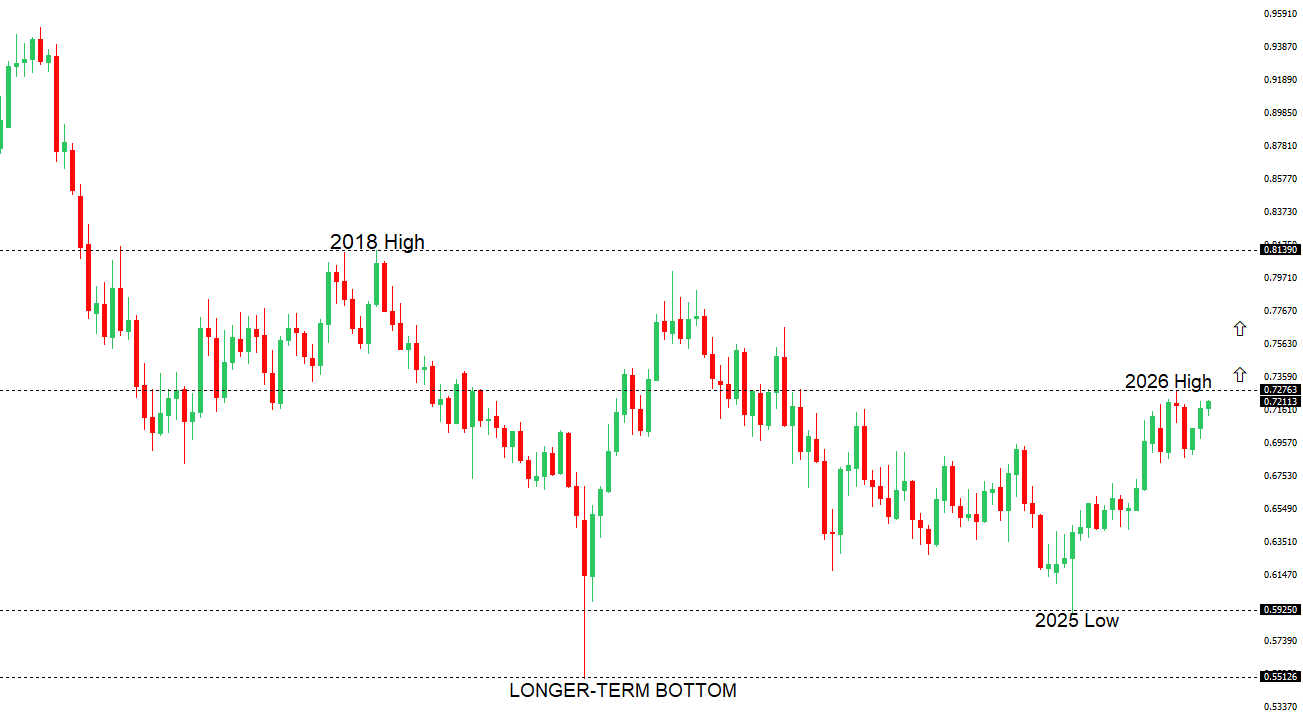 | ||
| R2 0.7222 - 17 April high - Medium R1 0.7218 - 7 September high - Medium S1 0.7121 - 2 September low - Medium S2 0.7067 - 19 August low - Medium | ||
| AUDUSD: fundamental overview | ||
| The Australian dollar remains well supported near 0.7200, close to its strongest level since mid-May, as resilient domestic fundamentals reinforce expectations that the RBA may raise rates again. Stronger-than-expected second-quarter growth, firm household spending and persistent underlying inflation have increased the probability of a September hike, while elevated energy prices add to Australia’s inflation risks. The Aussie’s upside has nevertheless been contained by renewed Fed tightening expectations following the stronger US payrolls report, rising US yields and safe-haven dollar demand amid escalating US-Iran tensions. Attention now shifts to US inflation data, which will be critical in determining whether the Fed-RBA policy outlook continues to support AUDUSD or allows the dollar to regain momentum. | ||
| Suggested reading | ||
| AI’s Biggest Breakthrough Is 80% Here– Here’s How to Play It, E. Fry, InvestorPlace (September 4, 2026) Why I Am So Bullish Gold, V. Katsenelson, The Intellectual Investor (September 3, 2026) | ||