


 | ||
| 8th September 2026 | view in browser | ||
| Yen strength and oil risks set the tone | ||
| Markets head into Tuesday cautiously as yen strength and shifting central-bank expectations compete with rising oil prices and geopolitical tensions, leaving the dollar softer, US equity futures mixed and gold supported. | ||
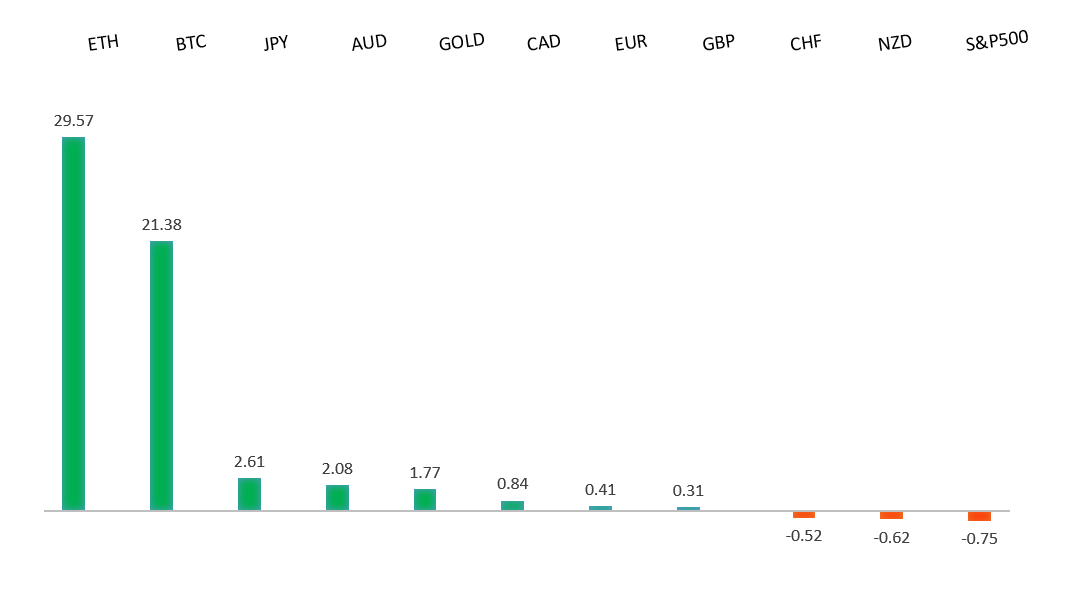
| Performance chart 30day v. USD (%) | ||
 | ||
| Technical & fundamental highlights | ||
| EURUSD: technical overview | ||
| The Euro outlook remains constructive with higher lows sought out on dips in favor of the next major upside extension targeting the 2021 high at 1.2350. Setbacks should be exceptionally well supported ahead of 1.1400. | ||
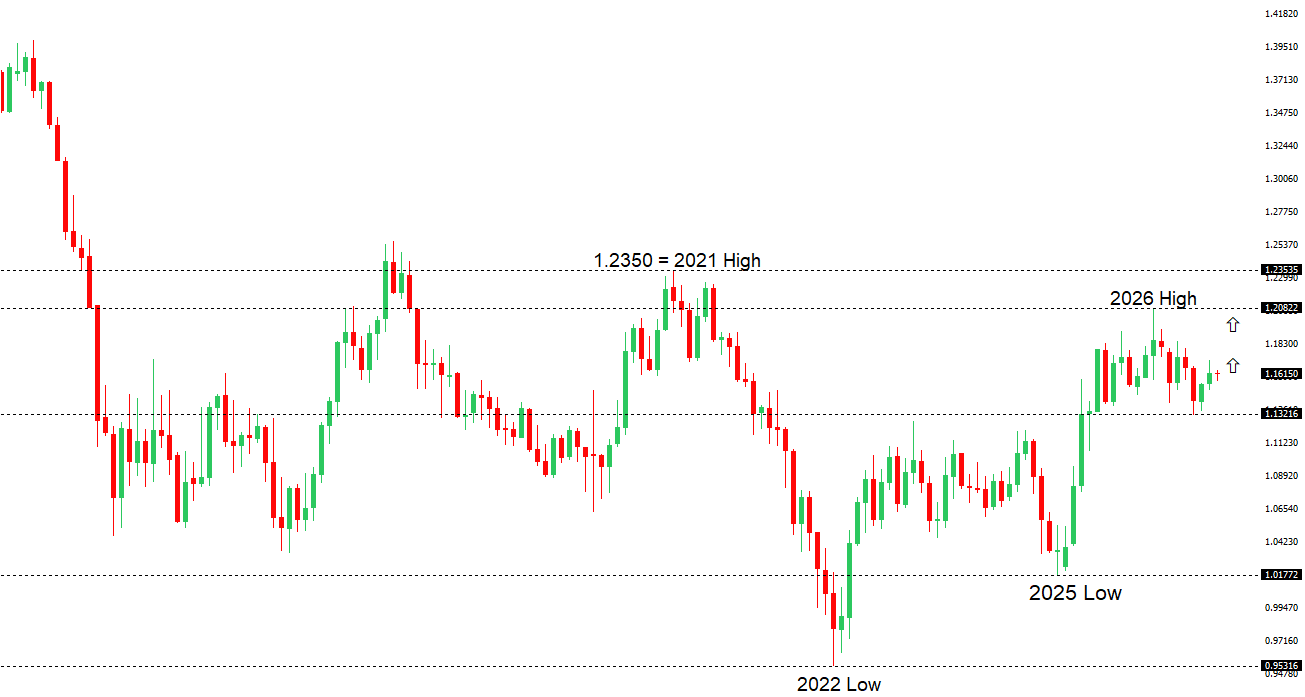 | ||
| R2 1.1712 - 21 August high - Strong R1 1.1660 - 27 August high - Medium S1 1.1566 - 2 September low - Medium S2 1.1512 - 313 August low - Strong | ||
| EURUSD: fundamental overview | ||
| The euro is holding firm above 1.1600, supported by expectations that the ECB will raise rates again on Thursday as elevated energy costs keep inflation risks alive, while stronger-than-previously-estimated euro-area growth has given policymakers more room to tighten. With a quarter-point increase largely priced in, the currency’s next move will depend more on President Lagarde’s guidance and whether the ECB signals that another hike could follow in December. The backdrop is not uniformly positive, however, with weak German industrial production and rising political uncertainty tempering confidence in the region’s outlook. Meanwhile, solid US employment data and this week’s US inflation releases are supporting Fed tightening expectations, while renewed US-Iran tensions and the associated safe-haven demand for the dollar are limiting the euro’s upside. | ||
| GBPUSD: technical overview | ||
| The Pound remains exceptionally well supported on dips into the 1.3000 area, with the price largely consolidating above the psychological barrier and previous resistance turned support in the form of the 2023 high. Look for the market to continue be well supported on dips ahead of the next major upside extension through the yearly high at 1.3870 and towards a retest of the 2018 high at 1.4377 further up. Only a monthly close below 1.3000 negates. | ||
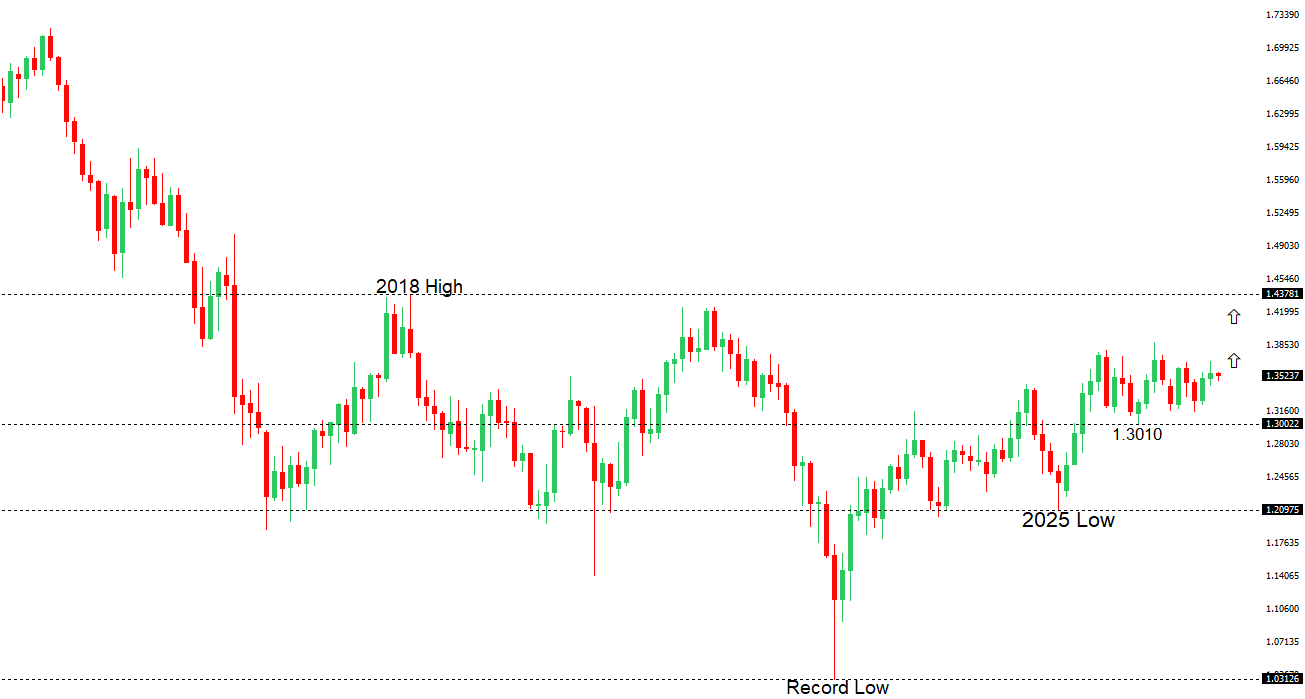 | ||
| R2 1.3676 - 21 August high - Strong R1 1.3566 - 31 August high - Medium S1 1.3474 - 13 August low - Medium S2 1.3400 - 31 July low - Medium | ||
| GBPUSD: fundamental overview | ||
| Sterling has edged higher against the dollar, supported by Chancellor Healey’s commitment to fiscal discipline and proposals to boost private investment through regional devolution, regulatory reform and lower business costs. However, the measures largely extend existing policy and have provided only modest support, with investors still concerned about strained public finances, elevated borrowing costs and the difficult choices facing the government in its October budget. The pound continues to benefit from expectations that persistent inflation could keep the Bank of England in a relatively hawkish stance, although fragile growth and the prospect of tighter fiscal policy argue against an aggressive tightening cycle. Meanwhile, stronger US employment data and increased expectations for a September Federal Reserve rate hike are limiting GBPUSD gains, placing greater emphasis on this week’s US inflation releases and Friday’s UK GDP report. | ||
| USDJPY: technical overview | ||
| The recent breakdown below 155.00 suggests the market could be on the verge of a bigger structural shift, with the possibility for an end to a longer-term uptrend and the start to a period of persistent weakness. Critical support now comes in the form of the 2026 low from January at 151.97, with a drop below to strengthen the bearish outlook and open the door for a major downside extension targeting the 2024 low at 139.58. The market would need to get back above 160.00 to take the immediate pressure off the downside. | ||
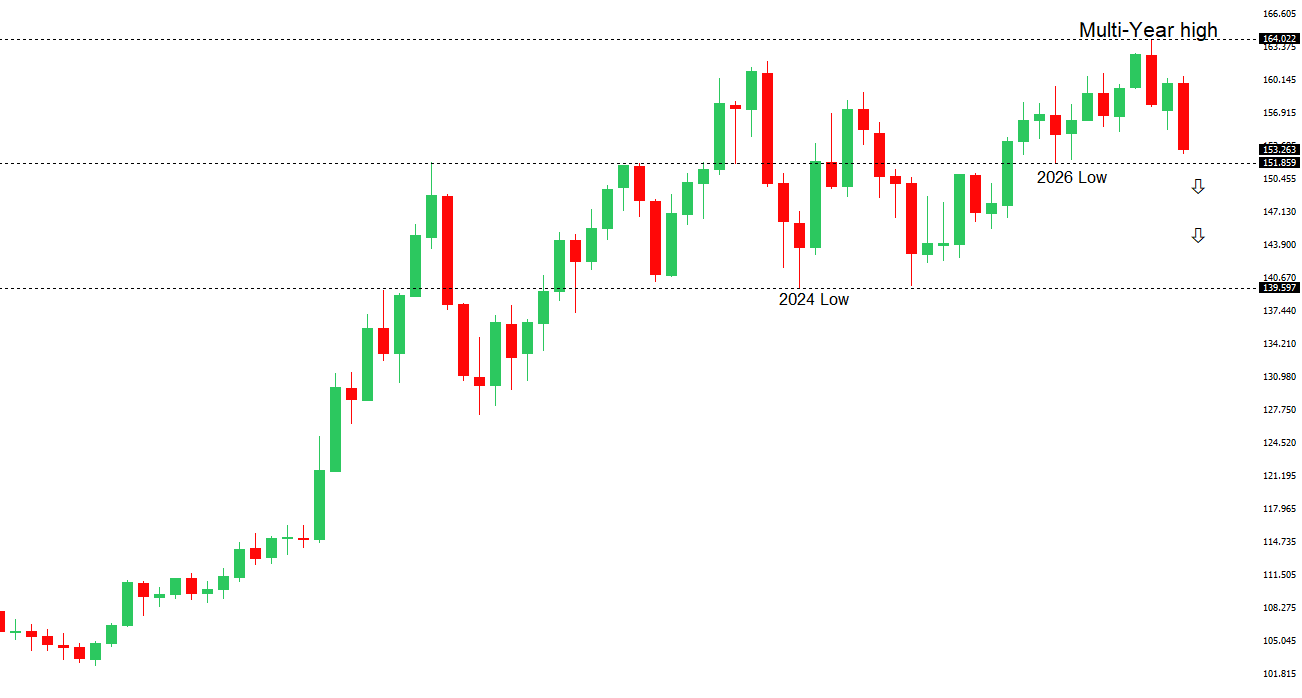 | ||
| R2 156.75 - 4 September high - Strong R1 154.38 - 8 September high - Medium S1 152.88 - 8 September low - Medium S2 151.97 - 28 January/2026 low - Strong | ||
| USDJPY: fundamental overview | ||
| The yen has rallied to its strongest level since February, driven by a sharp unwinding of short-yen and carry-trade positions as investors price in faster Bank of Japan tightening. Japanese real wages recorded their strongest annual increase since 2021, while second-quarter growth was revised higher, reinforcing expectations that the BoJ will raise rates next week and may continue tightening thereafter. Speculation over capital repatriation by Japanese investors and the authorities’ demonstrated willingness to support the currency through intervention have added momentum to the move. Meanwhile, broad dollar weakness ahead of key US inflation data has outweighed support from hawkish Fed expectations and geopolitical tensions, intensifying the decline in USDJPY. | ||
| AUDUSD: technical overview | ||
| There are signs of the formation of a longer-term base with the market recovering out from a meaningful longer-term support zone. The latest monthly close back above 0.7000 takes the big picture pressure off the downside and strengthens the case for a bottom, with the focus now on a push towards 0.8000. Setbacks should now be well supported ahead of 0.6700. | ||
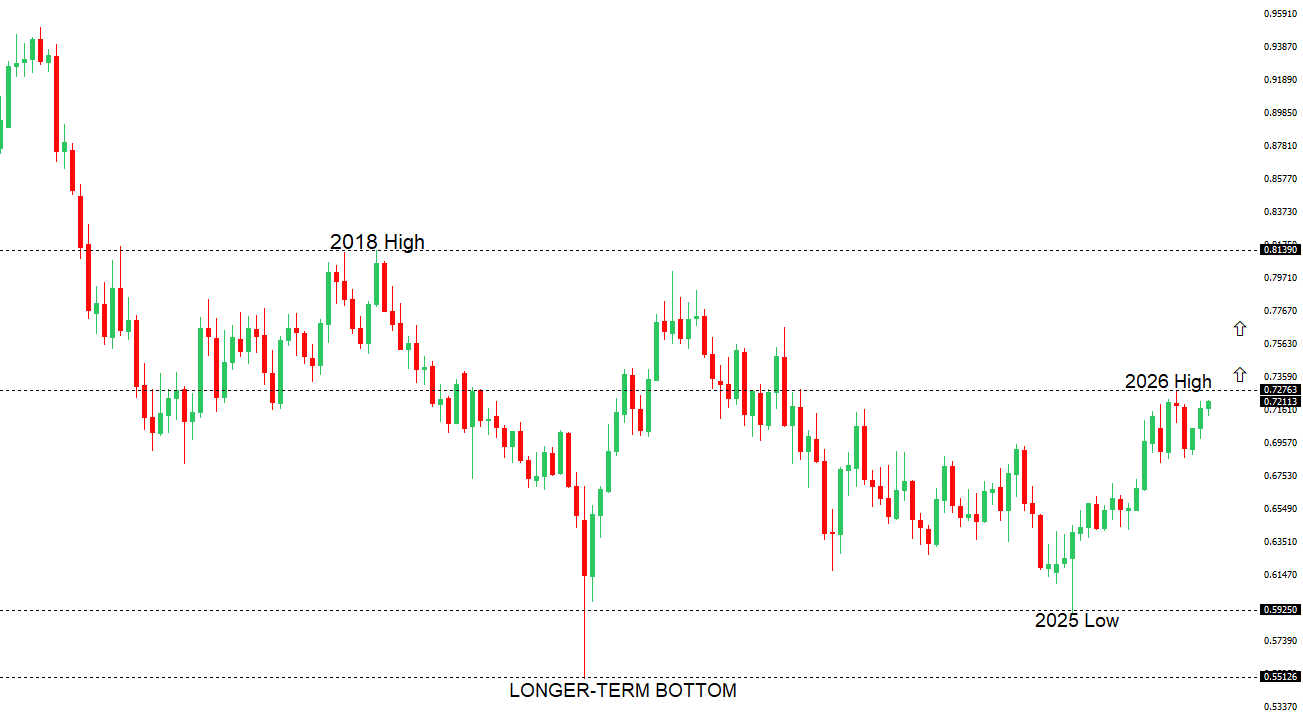 | ||
| R2 0.7278 - 6 May/2026 high - Strong R1 0.7225 - 7 September high - Medium S1 0.7121 - 2 September low - Medium S2 0.7067 - 19 August low - Medium | ||
| AUDUSD: fundamental overview | ||
| The Australian dollar has steadied after four consecutive sessions of gains, with China’s broadly in-line trade figures offering little fresh direction despite continued strength in exports. Domestically, a sharp deterioration in consumer confidence has weighed on sentiment, reflecting concerns over elevated interest rates, rising fuel costs, housing-market weakness and job security. Nevertheless, expectations that persistent inflation could force the RBA to tighten policy again, alongside Australia’s recent stronger-than-expected growth data, continue to provide underlying support. The Aussie has also benefited from broader US dollar weakness, although stronger US employment data and rising expectations for a September Fed rate hike are limiting further upside ahead of this week’s key US inflation releases. | ||
| Suggested reading | ||
| A Case That the Jobs Report Is Actually Good for Bonds, B. Arends, Marketwatch (September 5, 2026) The Fed Doesn’t ‘Print,’ and the Government Doesn’t “Spend”, J. Tamny, Forbes (September 6, 2026) | ||