


|
||
| 7th April 2025 | view in browser | ||
| US equities back to massive previous resistance | ||
|
President Trump’s rumored 90-day tariff pause on all but China was quickly denied, leading US stock indices to slide before closing higher, halting a three-day drop, though uncertainty lingers as over 50 countries await trade talks. President Trump remains defiant, pushing for a trade reset with threats of 104% tariffs on China by Thursday. |
||
| Performance chart 30day v. USD (%) | ||

|
||
| Technical & fundamental highlights | ||
| EURUSD: technical overview | ||
|
The Euro has been in a multi-month consolidation since bottoming out in 2022. Setbacks have since been exceptionally well supported on dips towards parity, with a higher platform sought out ahead of the next major upside extension. Look for a push back towards the 2023 high at 1.1276 in the days ahead. Only a monthly close below 1.0000 negates. |
||

|
||
| R2 1.1148 - 3 April/2025 high - Strong - S1 1.0880 - 7 April low - Medium | ||
| R1 1.1000 - Psychological - Medium - S2 1.0733 - 27 March low - Strong | ||
| EURUSD: fundamental overview | ||
|
The Euro has edged up against the US Dollar on a cautious market response to renewed US Dollar strength and as traders weigh the potential for retaliatory moves from Europe against US trade policies. At the same time, the rally has been tempered on expectations of a dovish ECB stance amid tariff-related uncertainties. Key standouts on Tuesday’s calendar come from ECB speak, Canada Ivey PMIs, and some Fed speak. |
||
| GBPUSD: technical overview | ||
|
Signs have emerged of the market wanting to put in a longer-term base after collapsing to a record low in September 2022. The door is now open for the next major upside extension towards the 2018 high at 1.4377. Setbacks should be well supported above 1.2000 on a monthly close basis. |
||

|
||
| R2 1.3208 - 3 April/2025 high - Strong - S1 1.2708 - 7 April low - Medium | ||
| R1 1.2934 - 7 April high - Medium - S2 1.2679 - 4 March low - Medium | ||
| GBPUSD: fundamental overview | ||
|
The Pound came under quite a bit of pressure on Monday on the back of uncertainty around the fallout from China’s retaliatory tariffs. Markets have now priced an additional 30 basis points of cuts from the BoE in the first week of April alone, while eyeing an additional 80 basis points of rate cuts by year end. Key standouts on Tuesday’s calendar come from ECB speak, Canada Ivey PMIs, and some Fed speak. |
||
| USDJPY: technical overview | ||
|
There are signs of a meaningful top in place after the market put in a multi-year high in 2024. At this point, the door is now open for a deeper setback towards the 140 area. |
||

|
||
| R2 149.28 - 3 April high - Medium - S1 144.55 - 4 April/2025 low - Medium | ||
| R1 148.15 - 7 April high - Medium - S2 144.00 - Figure - Medium | ||
| USDJPY: fundamental overview | ||
|
According to Treasury Secretary Bessent, Japan PM Ishiba arranged a highly productive call with President Trump, reportedly securing Japan a top spot among countries awaiting negotiations with the United States. Key standouts on Tuesday’s calendar come from ECB speak, Canada Ivey PMIs, and some Fed speak. |
||
| AUDUSD: technical overview | ||
|
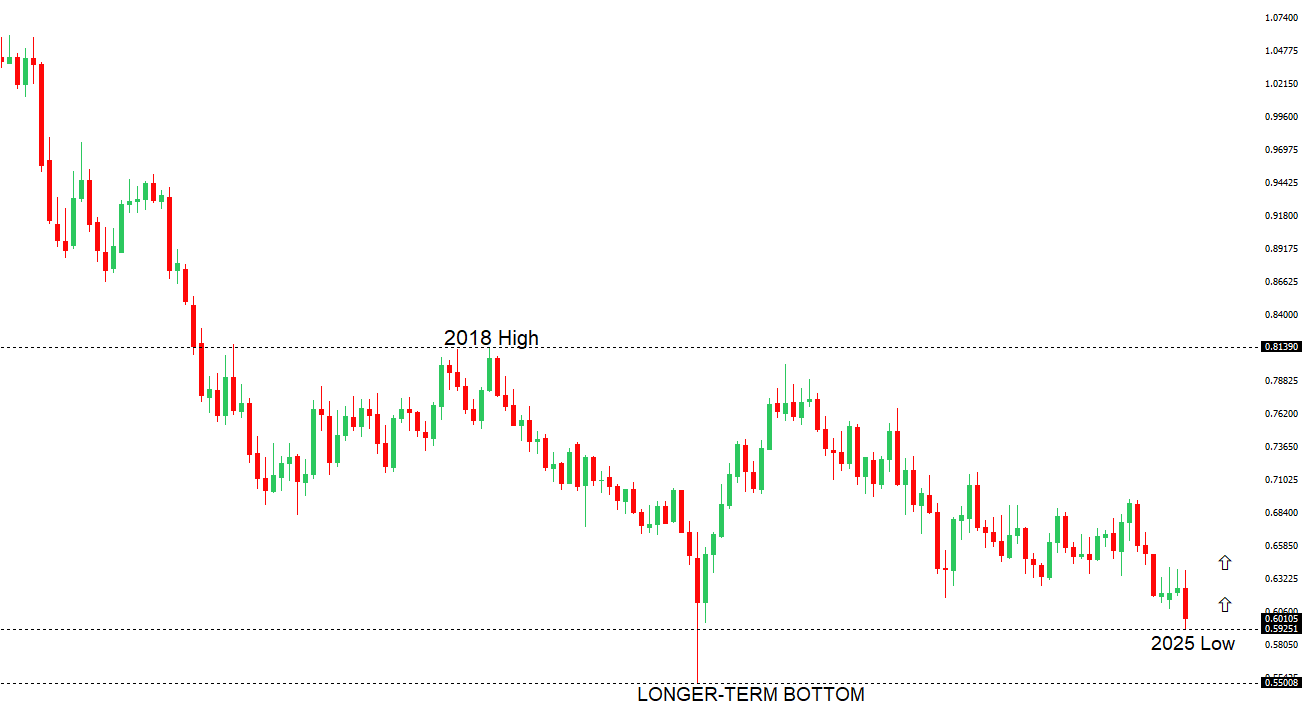
There are signs of the potential formation of a longer-term base with the market trading down into a meaningful longer-term support zone. Only a monthly close below 0.5500 would give reason for rethink. A monthly close back above 0.7000 will take the big picture pressure off the downside and strengthen case for a bottom. |
||
|
||
| R2 0.6187 - 4 March low - Medium - S1 0.5932 - 7 April/2025 low - Strong | ||
| R1 0.6332 - 4 April high - Medium - S2 0.5900 - Figure - Medium | ||
| AUDUSD: fundamental overview | ||
|
The Australian Dollar has been getting some welcome relief early Tuesday as the market tries to look for the worst to the out of the way with respect to fallout from US tariffs. However, there is still plenty of uncertainty out there and a rate cut from the RBA in May followed by 3 more cuts thereafter is looking increasingly likely. Key standouts on Tuesday’s calendar come from ECB speak, Canada Ivey PMIs, and some Fed speak. |
||
| USDCAD: technical overview | ||
|
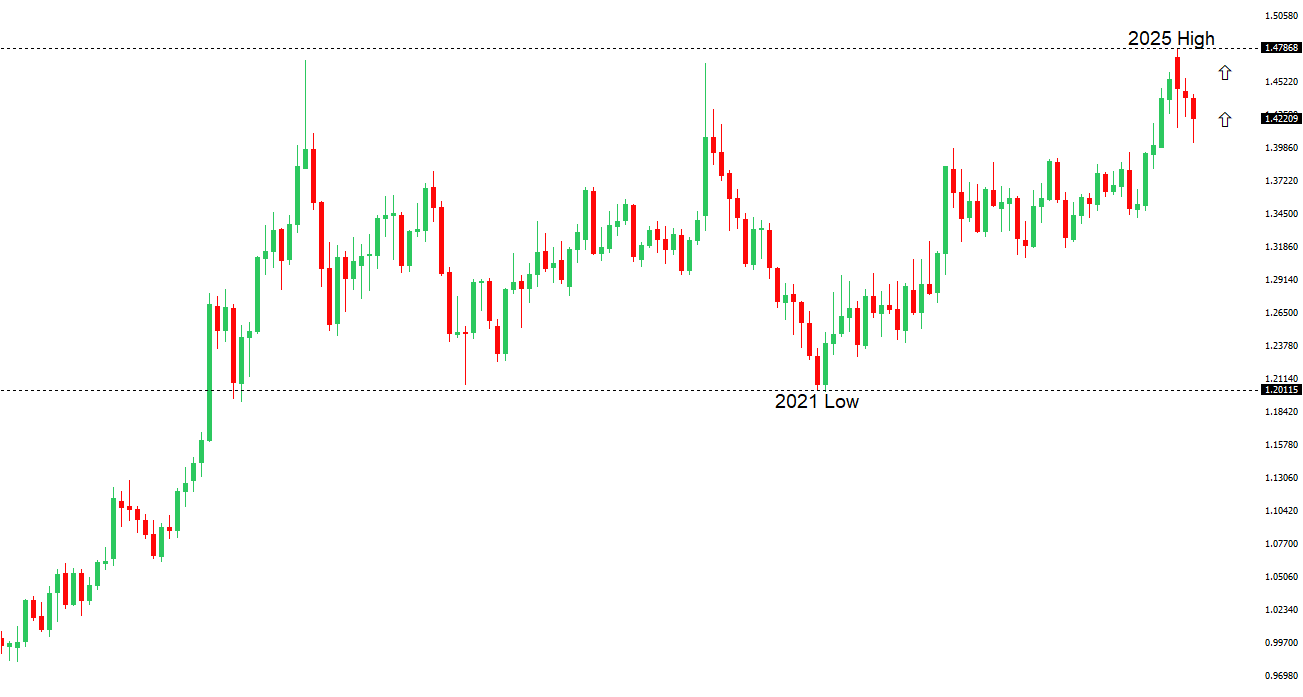
A sustained hold above 1.3000 over the past several months signals an end to a period of longer-term bearish consolidation and suggests the market is in the process of carving out a more significant longer-term base. Next key resistance now comes in at the 1.5000 psychological barrier. Setbacks should be very well supported ahead of 1.4000. |
||
|
||
| R2 1.4416 - 1 April high - Strong - S1 1.4151 - 14 April low - Medium | ||
| R1 1.4319 - 3 April high - Medium - S2 1.4027 - 3 April/2025 low - Strong | ||
| USDCAD: fundamental overview | ||
|
The Canadian Dollar has managed to steady itself a bit on the back of a rebound in oil prices and comments from PM Carney that the US is driving itself into recession. Key standouts on Tuesday’s calendar come from ECB speak, Canada Ivey PMIs, and some Fed speak. |
||
| NZDUSD: technical overview | ||
|
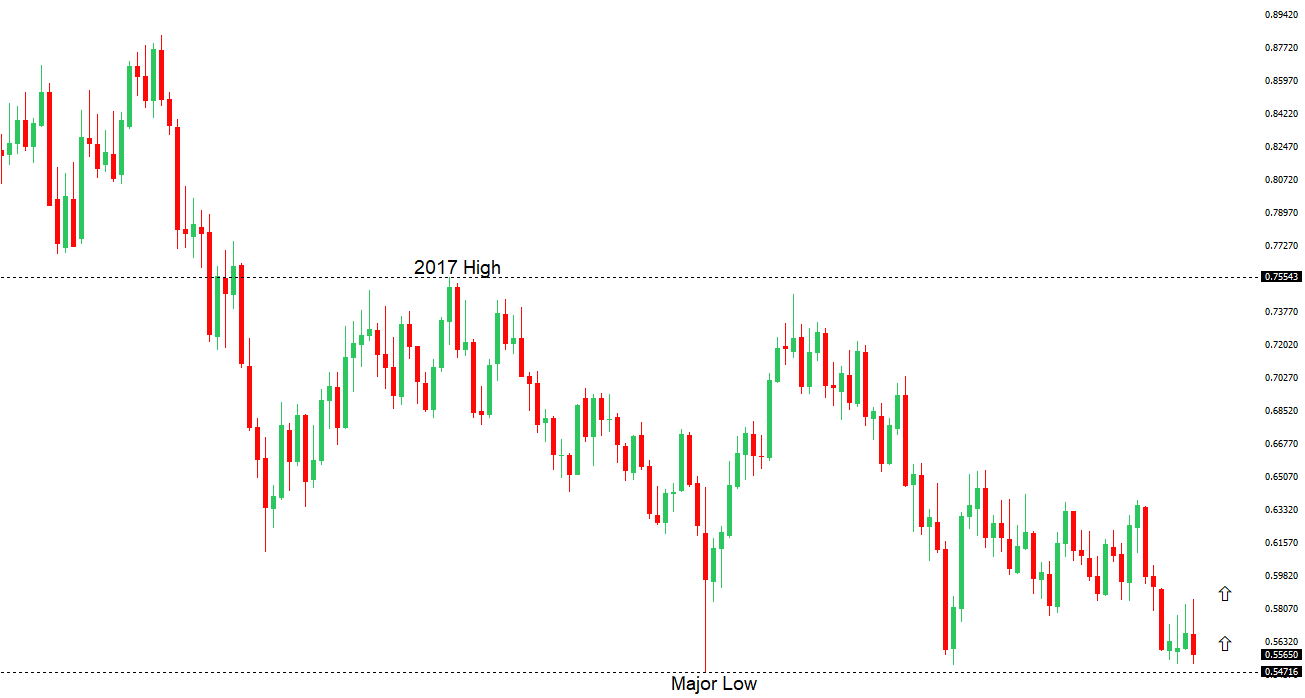
Overall pressure remains on the downside with the market continuing to stall out on runs up into the 0.6500 area. At the same time, there are some signs of the market wanting to put in a longer-term base. Ultimately, a break back above 0.6500 would be required to take the medium-term pressure off the downside and encourage this prospect. A monthly close below 0.5469 will intensify bearish price action. |
||
|
||
| R2 0.5798 - 4 April high - Medium - S1 0.5516 - 3 February low - Medium | ||
| R1 0.5648 - 31 March low - Medium - S2 0.5506 - 7 April/2025 low - Strong | ||
| NZDUSD: fundamental overview | ||
|
The New Zealand Dollar has managed to find some bids on Tuesday thus far, with the currency following along with a period of relief in risk assets. Still overall, there continues to be plenty of uncertainty around the state of global trade, which could the Kiwi rate well offered into rallies. Key standouts on Tuesday’s calendar come from ECB speak, Canada Ivey PMIs, and some Fed speak. |
||
| Suggested reading | ||
|
The Urgent Economic Response Needed After Trump’s Tariff Bombshell, , S. Forbes, Forbes (April 4, 2025) As They Disrupt Banks, How to Profit From Stablecoins, S. McBride, RiskHedge (April, 2025) |
||