


Today’s report: Investors reconsider impact of additional stimulus
It seems the market is a little more concerned about exactly how any new US stimulus will take form, with the news of Janet Yellen working with lawmakers to determine the impact of reversing President Trump’s tax cuts and fast-tracking a series of tax increases on corporations and wealthy Americans not exactly being taken as the most investor friendly development.
Wake-up call
- ECB aftermath
- lockdown length
- Japan inflation
- SNB policy
- retail sales
- retail sales
- inflation
- Stocks vulnerable
- Dealers report
- Bigger money
- defi bubble
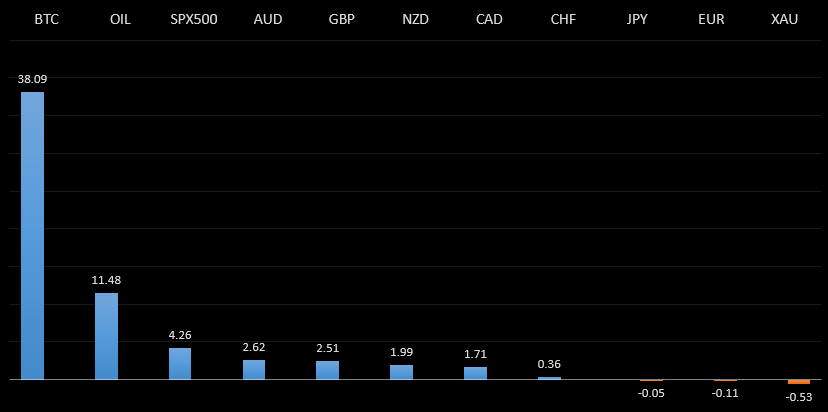
Peformance chart: 30 Day Performance vs. US dollar (%)
Suggested reading
- Trumpism, Economically Speaking, Is Here to Stay, D. Moss, Bloomberg (January 22, 2021)
- Mexico’s Avocados: Curbing the Thirst for ‘Green Gold’, J. Webber, Financial Times (January 20, 2021)
Chart talk: Technical & fundamental highlights
Choose pair:
EURUSD – technical overview
The recent breakout above 1.2000 ends a period of multi-week consolidation, with the major pair pushing to its highest level since April 2018. The break also opens the door for an eventual retest of the 2018 high up in the 1.2550 area. At this stage, setbacks should be very well supported above the previous range low around 1.1600.EURUSD – fundamental overview
The Euro has put in a solid recovery in the aftermath of Thursday's ECB decision. The central bank left policy on hold and didn't have any formal discussions about the exchange rate. The ECB also hinted that PEPP facility may not be fully utilized if financing conditions remain favorable, providing additional prop to the single currency. Key standouts on today’s calendar include German and Eurozone manufacturing and services PMIs, US manufacturing PMIs and US existing home sales.EURUSD - Technical charts in detail
GBPUSD – technical overview
The recent breakout through the 2019 high at 1.3515 is significant and now sets the stage for the next major upside extension back towards 1.4000. Technical studies are however unwinding from extended readings, leaving room for some setbacks before the market starts to make its way higher. But look for setbacks to now be very well supported ahead of 1.3000.GBPUSD – fundamental overview
We're seeing some profit taking on long Pound exposure into Friday, though we're also seeing some selling pressure from risk off flow and local developments. The fact that PM Johnson won't rule out the possibility of the lockdown extending all the way into the summer has added additional selling pressure in the Pound. Key standouts on today’s calendar include UK retail sales, UK manufacturing and services PMIs, US manufacturing PMIs and US existing home sales.USDJPY – technical overview
The latest breakdown below 104.00 opens the door for a deeper round of setbacks. Initial support comes in just ahead of 101.00, in the form of the 2020 low, which guards against the major psychological barrier at 100.00 and the 2016 low around 99.00. At this point, it would take a clear break back above 106.00 to take the immediate pressure off the downside.USDJPY – fundamental overview
The latest CPI report out of Japan showed price pressures continued to weaken, albeit not as bad as expected. Meanwhile, Japan's PMIs dipped in the wake of the state of emergency declaration for 11 prefectures. The Times of London reported that the Japanese government has privately concluded the Tokyo Olympics will have to be canceled because of the pandemic. But this has been denied by Japan's Sakai. Key standouts on today’s calendar include US manufacturing PMIs and US existing home sales.EURCHF – technical overview
Lots of sideways price action here, with no clear directional insight. For the most part, price action has been confined between 1.0600 and 1.0900, and it will take a clear break above or below for an indication of the next big move.EURCHF – fundamental overview
The SNB remains uncomfortable with Franc appreciation and continues to remind the market it will need to be careful about any attempts at trying to force an appreciation in the currency. But the SNB will also need to be careful right now, as its strategy to weaken the Franc is facing headwinds from a less certain global outlook. Any signs of renewed risk liquidation will likely invite a very large wave of demand for the Franc that will put the SNB in the more challenging position of needing to back up its talk with action, that ultimately, may not prove to be as effective as it once was, given where we're at in the monetary policy cycle.AUDUSD – technical overview
Technical studies have turned up in recent months, after the market traded down to its lowest levels since 2003 in 2020. There is evidence of a longer-term bottom following the latest push back through 0.7000, though at this stage, there is risk for a pullback to allow for shorter term studies to unwind. Next big resistance comes in at 0.8000. Setbacks should now be well supported ahead of 0.7000.AUDUSD – fundamental overview
The Australian Dollar has come under pressure into Friday on the back of risk off flow and a softer Australia retail sales report. Key standouts on today’s calendar include US manufacturing PMIs and US existing home sales.USDCAD – technical overview
Has been in major decline since topping out in 2021 above 1.4600. At this stage, with the decline now well extended, the market is likely to find solid support into the 1.2500 area ahead of a resumption of gains. Ultimately, only a weekly close below 1.2500 would suggest otherwise.USDCAD – fundamental overview
The Canadian Dollar has since cooled off after pushing to a fresh multi-month high against the Buck on Thursday. The rally came on the back of comments from BoC Macklem who said Canada would not be needing as much QE over time. But a subsequent wave of broad based risk off flow and a concurrent round of oil selling have opened the door to this latest turnaround in favour of the US Dollar. Key standouts on today’s calendar include Canada retail sales, US manufacturing PMIs and US existing home sales.NZDUSD – technical overview
There's a case to be made for a meaningful bottom, after the market bottomed out in 2020. The recent break back above 0.7000 further strengthens this outlook, with the market back in uptrend mode as per the weekly Ichimoku cloud and focused on pushing back towards longer-term resistance in the 0.7500 area. Any setbacks are expected to be well supported ahead of 0.6500.NZDUSD – fundamental overview
Today's above forecast New Zealand inflation reads further strengthen the case the RBNZ will not need to be providing additional monetary easing. Still, we have seen Kiwi selling pressure into Friday on the back of risk off flow in global markets. The RBNZ will keep the pace of bond purchases unchanged next week. Key standouts on today’s calendar include US manufacturing PMIs and US existing home sales.US SPX 500 – technical overview
Longer-term technical studies are looking quite exhausted and the market is showing signs of wanting to roll over after racing to another record high. Look for rallies to be well capped ahead of 3900, with a break back below 3600 to strengthen the outlook.US SPX 500 – fundamental overview
We're trading just off fresh record highs, and yet, with so little room for additional central bank accommodation, given an already depressed interest rate environment, the prospect for sustainable runs to the topside on easy money policy incentives and government stimulus, should no longer be as enticing to investors. Meanwhile, ongoing worry associated with coronavirus fallout should weigh more heavily on investor sentiment in 2021.GOLD (SPOT) – technical overview
The 2019 breakout above the 2016 high at 1375 was a significant development, opening the door for fresh record highs and an acceleration beyond the next major psychological barrier at 2000. Setbacks should now be well supported above 1700. Longer-term technical studies are however in the process of consolidating, with the market in search of a higher low ahead of a bullish continuation.GOLD (SPOT) – fundamental overview
The yellow metal continues to be well supported on dips with solid demand from medium and longer-term accounts. These players are more concerned about exhausted monetary policy, extended global equities, and coronavirus fallout. All of this should keep the commodity well supported, with many market participants also fleeing to the hard asset as the grand dichotomy of record high equities and record low yields comes to an unnerving climax.BTCUSD – technical overview
The short-term outlook should be less constructive in the aftermath of this latest wave of parabolic price action through $40,000. Key indicators are unwinding from extreme overbought territory across multiple timeframes, warning of a period of deeper correction and consolidation before any meaningful bullish continuation can be expected. At the same time, look for setbacks to now be well supported into the $20,000 area.BTCUSD – fundamental overview
Overall, ongoing adoption, continued innovation in the space, a warmer regulatory environment and healthy institutional investor appetite have all contributed to this latest wave of strong demand leading to fresh record highs into 2021. Market participants are also drawn to the asset as it proves to be an attractive store of value at a time when governments and central banks continue to print money at unprecedented rates. Still, the market had run a little too far and fast and we're now seeing a round of profit taking kicking in.BTCUSD - Technical charts in detail
ETHUSD – technical overview
The market has finally rallied up to a fresh record high, exceeding the previous peak from January 2018. At the same time, with daily studies showing overextension, there could be a period of consolidation and deeper correction that sets in before a meaningful bullish continuation. Setbacks should now be well supported ahead of 800.ETHUSD – fundamental overview
Bitcoin is getting all of the attention, though it's Ether that outperformed its older cousin in 2020. All of the healthy investor risk appetite in global markets has helped to fuel demand for innovation and the Ethereum blockchain is very much at the centre of this when it comes to cryptocurrencies. At the same time, we would be concerned about a bubble in the defi space, with valuations for these projects soaring to alarming heights. We've also warned that any downturn in global sentiment is likely to have a more significant negative impact on the more risk correlated Ether.