


Today’s report: The two things driving markets right now
There have been two major drivers of price action in the latter half of the week that have been supporting stocks and weighing on the US Dollar. The first came on Wednesday when US inflation data came in contained and below forecast.
Wake-up call
- ECB decision
- Heavy docket
- Surging equities
- SNB policy
- global sentiment
- employment report
- housing data
- Stocks vulnerable
- Dealers report
- Bigger money
- risk appetite
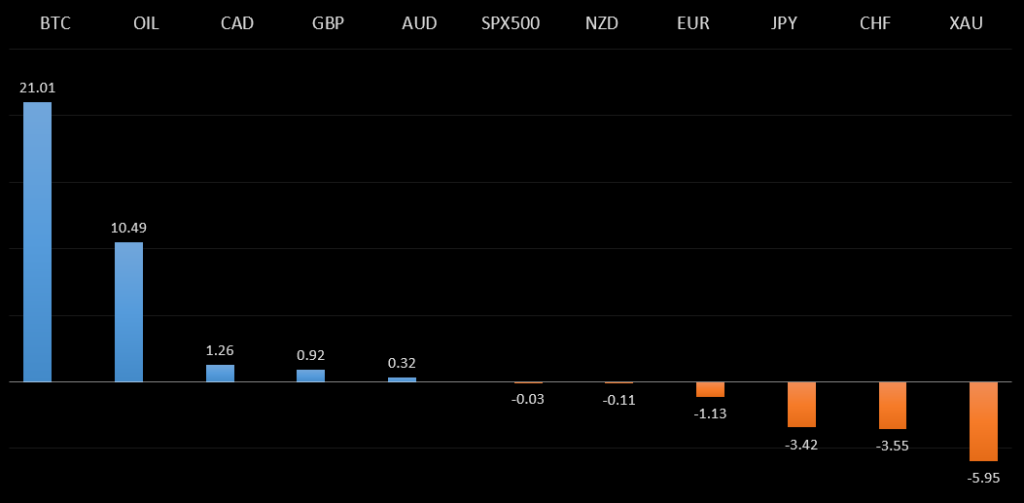
Peformance chart: 30 Day Performance vs. US dollar (%)
Suggested reading
- Stockpickers Can Breathe Again as FANGs Stumble, J. Authers, Bloomberg (March 12, 2021)
- Could the Pandemic Lead to a Fairer Economy?, M. Sandbu, City Journal (March 11, 2021)
Chart talk: Technical & fundamental highlights
Choose pair:
EURUSD – technical overview
The market is in the process of correcting following an impressive run to its highest levels since April 2018. There is room for additional downside over the coming sessions, though ultimately, the overall structure remains constructive and the market will be looking for that next higher low ahead of a bullish continuation. Only a break back below 1.1500 would negate the outlook.EURUSD – fundamental overview
The ECB left policy on hold as was widely expected. The central said premature tightening due to higher bond yields was undesirable, while pledging to increase bond buying under PEPP. We also saw Euro demand on the back of market reaction to the massive stimulus pipeline out of the US. Key standouts on the Friday calendar include German inflation, Eurozone industrial production, US producer prices and Michigan sentiment.EURUSD - Technical charts in detail
GBPUSD – technical overview
Technical studies are in the process of unwinding from stretched levels after the push to fresh multi-month highs. This leaves room for additional setbacks over the coming sessions, before the market considers a meaningful bullish continuation towards a retest of the 2018 high. But look for setbacks to now be very well supported into the 1.3500 area.GBPUSD – fundamental overview
It's been a quiet week in the UK and most of the price action in the Pound has been around market sentiment towards the US Dollar. The Pound has been supported in the aftermath of contained US inflation data and a massive US stimulus pipeline. Key standouts on the Friday calendar include UK trade, construction output, industrial production and GDP, US producer prices and Michigan sentiment.USDJPY – technical overview
The major pair remains confined to a massive multi-year triangle and it's going to take a clear break above or below the triangle to determine the direction of the next major move. We have seen a contraction in range as the market reaches the apex of the triangle, which suggests a breakout is coming soon. But until the triangle is broken, look to continue to see the market play the range within the triangle.USDJPY – fundamental overview
The Yen continues to trade with a soft tone on the back of ongoing demand for US and global equities. Key standouts on today’s calendar include US producer prices and Michigan sentiment.EURCHF – technical overview
Lots of sideways price action here, with no clear directional insight. For the most part, price action has been confined between 1.0600 and 1.1200, and it will take a weekly close above or below for an indication of the next big move.EURCHF – fundamental overview
The SNB remains uncomfortable with Franc appreciation and continues to remind the market it will need to be careful about any attempts at trying to force an appreciation in the currency. But the SNB will also need to be careful right now, as its strategy to weaken the Franc is facing headwinds from a less certain global outlook. Any signs of renewed risk liquidation will likely invite a very large wave of demand for the Franc that will put the SNB in the more challenging position of needing to back up its talk with action, that ultimately, may not prove to be as effective as it once was, given where we're at in the monetary policy cycle.AUDUSD – technical overview
Technical studies have turned up in recent months, after the market traded down to its lowest levels since 2003 in 2020. There is evidence of a longer-term bottom following the latest push back through 0.7000, though at this stage, there is risk for a deeper pullback to allow for shorter term studies to unwind. Setbacks should now be well supported ahead of 0.7500.Rallying commodities prices and surging stocks have been behind the latest wave of demand for the Australian Dollar. Key standouts on today’s calendar include US producer prices and Michigan sentiment.
USDCAD – technical overview
Has been in major decline since topping out in 2021 above 1.4600. At this stage, with the decline now well extended, the market is likely to find solid support into the 1.2500 area ahead of a resumption of gains. Ultimately, only a weekly close below 1.2500 would suggest otherwise. Back above 1.3000 will strengthen the outlook.USDCAD – fundamental overview
Rallying commodities prices and surging stocks have been behind the latest wave of demand for the Canadian Dollar. Key standouts on today’s calendar include Canada employment, US producer prices and Michigan sentiment.NZDUSD – technical overview
There's a case to be made for a meaningful bottom, after the market bottomed out in 2020. The recent break back above 0.7000 further strengthens this outlook, with the market back in uptrend mode as per the weekly Ichimoku cloud and focused on pushing back towards longer-term resistance in the 0.7500 area. Any setbacks are expected to be well supported ahead of 0.7000.NZDUSD – fundamental overview
The New Zealand Dollar got an added boost from hot housing data but has since been supported on rallying commodities prices and surging stocks. Key standouts on today’s calendar include US producer prices and Michigan sentiment.US SPX 500 – technical overview
Longer-term technical studies are looking quite exhausted and the market is showing signs of wanting to roll over after racing to another record high. Look for rallies to be well capped ahead of 4000, with a break back below 3600 to strengthen the outlook.US SPX 500 – fundamental overview
We're trading just off fresh record highs, and yet, with so little room for additional central bank accommodation, given an already depressed interest rate environment, the prospect for sustainable runs to the topside on easy money policy incentives and government stimulus, should no longer be as enticing to investors. Meanwhile, ongoing worry associated with coronavirus fallout should weigh more heavily on investor sentiment in 2021.GOLD (SPOT) – technical overview
The 2019 breakout above the 2016 high at 1375 was a significant development, opening the door for fresh record highs and an acceleration beyond the next major psychological barrier at 2000. Setbacks should now be well supported above 1600. Longer-term technical studies are however in the process of unwinding, with the market in search of a higher low ahead of a bullish continuation.GOLD (SPOT) – fundamental overview
The yellow metal continues to be well supported on dips with solid demand from medium and longer-term accounts. These players are more concerned about exhausted monetary policy, extended global equities, and coronavirus fallout. All of this should keep the commodity well supported, with many market participants also fleeing to the hard asset as the grand dichotomy of record high equities and record low yields comes to an unnerving climax.BTCUSD – technical overview
The short-term outlook should be less constructive in the aftermath of this latest wave of parabolic price action to fresh record highs through $55,000. Key indicators are unwinding from extreme overbought territory across multiple timeframes, warning of a period of deeper correction and consolidation before any meaningful bullish continuation can be expected. At the same time, look for setbacks to now be well supported into the $35,000 - $40,000 area.BTCUSD – fundamental overview
With so much of the good news priced in around all of the new adoption from major players in the traditional markets, and with the market as extended as it was in early 2021, a major period of pullback was fully anticipated in Q1. And while there is certainly a place for bitcoin to benefit in periods of risk off given its store of value draw, at the moment, the crypto asset is still vulnerable to periods of risk liquidation in US equities. We do however see plenty of demand from larger players into dips, with the $35,000-$40,000 seen as an attractive area to build exposure.BTCUSD - Technical charts in detail
ETHUSD – technical overview
The market has entered a period of overdue correction following a parabolic run to fresh record highs through 2,000 in February. There is room for additional declines, potentially back into the 1,000 area, before the market looks for that next higher low and a bullish continuation.ETHUSD – fundamental overview
Ether is in the process of an overdue price correction after an explosive start to 2021 that resulted in fresh record highs beyond $2,000. There were already signs of overvaluation in the defi space and this in conjunction with a deterioration in global risk sentiment have been behind a lot of this downside pressure. Still, we believe there will be plenty of demand for ether down into the $1,000 area. [audio mp3="https://www.lmax.com/blog/wp-content/uploads/sites/4/2021/03/12marchlmaxaudio.mp3"][/audio]