


Next 24 hours: Powell and Yellen in the Spotlight
Today’s report: New Zealand Dollar hit hard
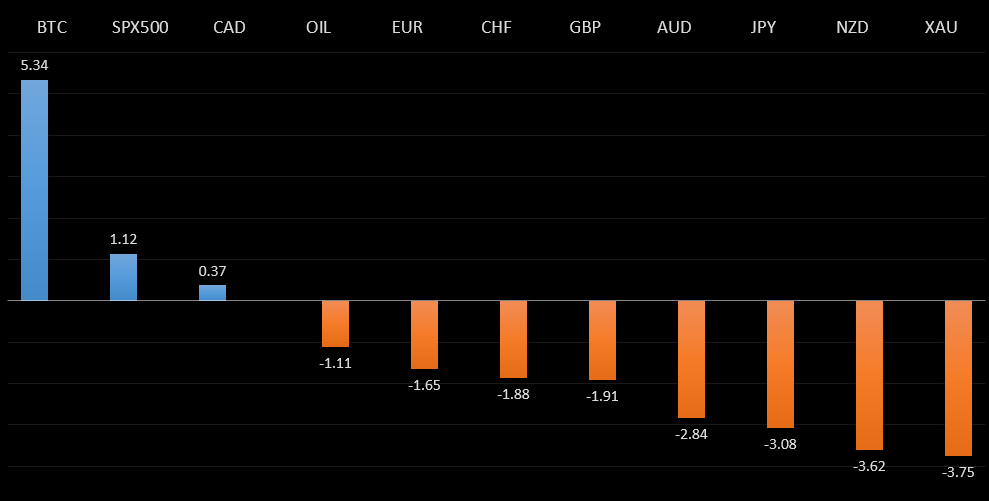
The big move in FX on Tuesday has come in the Kiwi market, with the New Zealand Dollar getting hit hard as the New Zealand government announces measures to rein in the booming housing market. These measures will now allow for the RBNZ to keep policy lower for longer.
Wake-up call
- aid spending
- third wave
- BOJ policy
- SNB policy
- Possible sanctions
- oil price
- Government measures
- Stocks vulnerable
- Dealers report
- Bigger money
- risk appetite
Peformance chart: 30 Day Performance vs. US dollar (%)
Suggested reading
- Turkey Isn't the First Domino in an Emerging Markets Bust, J. Authers, Bloomberg (March 23, 2021)
- Trading Time As A Fractal Experience, S. Levine, Integrating Investor (March 21, 2021)
Chart talk: Technical & fundamental highlights
Choose pair:
EURUSD – technical overview
The market is in the process of correcting following an impressive run to its highest levels since April 2018. There is room for additional downside over the coming sessions, though ultimately, the overall structure remains constructive and the market will be looking for that next higher low ahead of a bullish continuation. Only a break back below 1.1500 would negate the outlook.EURUSD – fundamental overview
The Euro got a boost on news of Germany upping its aid spending plans. Meanwhile, ECB Lagarde said the central bank bought more bonds under PEPP last week. Key standouts on Tuesday’s calendar include the US current account, a batch of Fed speak, US new home sales, Richmond Fed manufacturing, and Fed Chair Powell testimony.EURUSD - Technical charts in detail
GBPUSD – technical overview
Technical studies are in the process of unwinding from stretched levels after the push to fresh multi-month highs. This leaves room for additional setbacks over the coming sessions, before the market considers a meaningful bullish continuation towards a retest of the 2018 high. But look for setbacks to now be very well supported into the 1.3500 area.GBPUSD – fundamental overview
The Pound has held up well overall in the face of broad based US Dollar demand and in the aftermath of Boris Johnson's warning the UK needs to prepare for a third wave of the virus. Key standouts on Tuesday’s calendar include UK employment data, UK CBI trends, the US current account, a batch of Fed speak, US new home sales, Richmond Fed manufacturing, and Fed Chair Powell testimony.USDJPY – technical overview
The major pair remains confined to a massive multi-year triangle and it's going to take a clear break above or below the triangle to determine the direction of the next major move. We have seen a contraction in range as the market reaches the apex of the triangle, which suggests a breakout is coming soon. But until the triangle is broken, look to continue to see the market play the range within the triangle.USDJPY – fundamental overview
This past Friday, the Bank of Japan held its OCR at -0.1%, widened its JGB fluctuation band by 'around 25bps' on both sides of 0% and announced a plan allowing quicker cuts in both short and long-term rates. BoJ Governor Kuroda said the bank still had room to lower rates. All of this has kept the Yen from rallying in the face of risk off flow. Key standouts on Tuesday’s calendar include the US current account, a batch of Fed speak, US new home sales, Richmond Fed manufacturing, and Fed Chair Powell testimony.EURCHF – technical overview
Lots of sideways price action here, with no clear directional insight. For the most part, price action has been confined between 1.0600 and 1.1200, and it will take a weekly close above or below for an indication of the next big move.EURCHF – fundamental overview
The SNB remains uncomfortable with Franc appreciation and continues to remind the market it will need to be careful about any attempts at trying to force an appreciation in the currency. But the SNB will also need to be careful right now, as its strategy to weaken the Franc is facing headwinds from a less certain global outlook. Any signs of renewed risk liquidation will likely invite a very large wave of demand for the Franc that will put the SNB in the more challenging position of needing to back up its talk with action, that ultimately, may not prove to be as effective as it once was, given where we're at in the monetary policy cycle.AUDUSD – technical overview
Technical studies have turned up in recent months, after the market traded down to its lowest levels since 2003 in 2020. There is evidence of a longer-term bottom following the latest push back through 0.7000, though at this stage, there is risk for a deeper pullback to allow for shorter term studies to unwind. Setbacks should now be well supported ahead of 0.7500.AUDUSD – fundamental overview
The Australian Dollar is facing some headwinds on Tuesday. We're seeing downside pressure from potential western sanctions on China and falling iron ore prices. Key standouts on Tuesday’s calendar include the US current account, a batch of Fed speak, US new home sales, Richmond Fed manufacturing, and Fed Chair Powell testimony.USDCAD – technical overview
Has been in major decline since topping out in 2021 above 1.4600. At this stage, with the decline now well extended, the market is likely to find solid support into the 1.2300-1.2500 area ahead of a resumption of gains. Ultimately, only a weekly close below 1.2400 would suggest otherwise. Back above 1.2743 will strengthen the outlook.USDCAD – fundamental overview
A turnaround in the oil market and Monday's dip in Canada wholesale sales are behind some of this latest wave of profit taking on Canadian Dollar longs. Key standouts on Tuesday’s calendar include the US current account, a batch of Fed speak, US new home sales, Richmond Fed manufacturing, and Fed Chair Powell testimony.NZDUSD – technical overview
Finally signs of topping out after a nice multi-month rally. Look for a weekly close below 0.7000 to strengthen the bearish outlook and expose deeper setbacks towards the 0.6500 area. Back above 0.7300 would be required to take the immediate pressure off the downside.NZDUSD – fundamental overview
New measures taken to rein in surging property prices have translated to a much lower Kiwi rate, with the implication that this will allow the RBNZ to keep rates lower for much longer. Dealers have reported heavy NZD selling from HFTs and leveraged funds. Key standouts on Tuesday’s calendar include the US current account, a batch of Fed speak, US new home sales, Richmond Fed manufacturing, and Fed Chair Powell testimony.US SPX 500 – technical overview
Longer-term technical studies are looking quite exhausted and the market is showing signs of wanting to roll over after racing to another record high. Look for rallies to be well capped ahead of 4000, with a break back below 3600 to strengthen the outlook.US SPX 500 – fundamental overview
We're trading just off fresh record highs, and yet, with so little room for additional central bank accommodation, given an already depressed interest rate environment, the prospect for sustainable runs to the topside on easy money policy incentives and government stimulus, should no longer be as enticing to investors. Meanwhile, ongoing worry associated with coronavirus fallout should weigh more heavily on investor sentiment in 2021.GOLD (SPOT) – technical overview
The 2019 breakout above the 2016 high at 1375 was a significant development, opening the door for fresh record highs and an acceleration beyond the next major psychological barrier at 2000. Setbacks should now be well supported above 1600. Longer-term technical studies are however in the process of unwinding, with the market in search of a higher low ahead of a bullish continuation.GOLD (SPOT) – fundamental overview
The yellow metal continues to be well supported on dips with solid demand from medium and longer-term accounts. These players are more concerned about exhausted monetary policy, extended global equities, and coronavirus fallout. All of this should keep the commodity well supported, with many market participants also fleeing to the hard asset as the grand dichotomy of record high equities and record low yields comes to an unnerving climax.BTCUSD – technical overview
The short-term outlook should be less constructive in the aftermath of this latest wave of parabolic price action to fresh record highs through $60,000. Key indicators are unwinding from extreme overbought territory across multiple timeframes, warning of a period of deeper correction and consolidation before any meaningful bullish continuation can be expected. At the same time, look for setbacks to now be well supported into the $35,000 - $40,000 area.BTCUSD – fundamental overview
With so much of the good news priced in around all of the new adoption from major players in the traditional markets, and with the market as extended as it's been in 2021, a major period of pullback is fully anticipated into the end of Q1. And while there is certainly a place for bitcoin to benefit in periods of risk off given its store of value draw, at the moment, the crypto asset is still vulnerable to periods of risk liquidation in US equities. We do however see plenty of demand from larger players into dips, with the $35,000-$40,000 seen as an attractive area to build exposure.BTCUSD - Technical charts in detail
ETHUSD – technical overview
The market has entered a period of overdue consolidation following a parabolic run to fresh record highs through 2,000 in February. There is room for additional correction, potentially back into the 1,000 area, before the market looks for that next higher low and a bullish continuation.ETHUSD – fundamental overview
Ether is in the process of an overdue price consolidation after an explosive start to 2021 that resulted in fresh record highs beyond $2,000. There were already signs of overvaluation in the defi space and this in conjunction with a deterioration in global risk sentiment have been behind a lot of this downside pressure. Still, we believe there will be plenty of demand for ether down into the $1,000 area.