


Next 24 hours: Dollar sell off rather mild considering
Today’s report: Virus recovery process runs into bumps
Most of the price action into Thursday comes from the latest Fed Minutes communication which unsurprisingly leaned to the dovish side overall. This helped to fuel a fresh record run in US stocks, while also weighing on the US Dollar, with the Fed downplaying risks associated with rising yields.
Wake-up call
- PEPP
- GBPUSD Vaccine process runs into some bumps
- virusinfections ramp up
- SNB policy
- RBA purchases
- virus measures
- Softer data
- Stocks vulnerable
- Dealers report
- Bigger money
- risk appetite
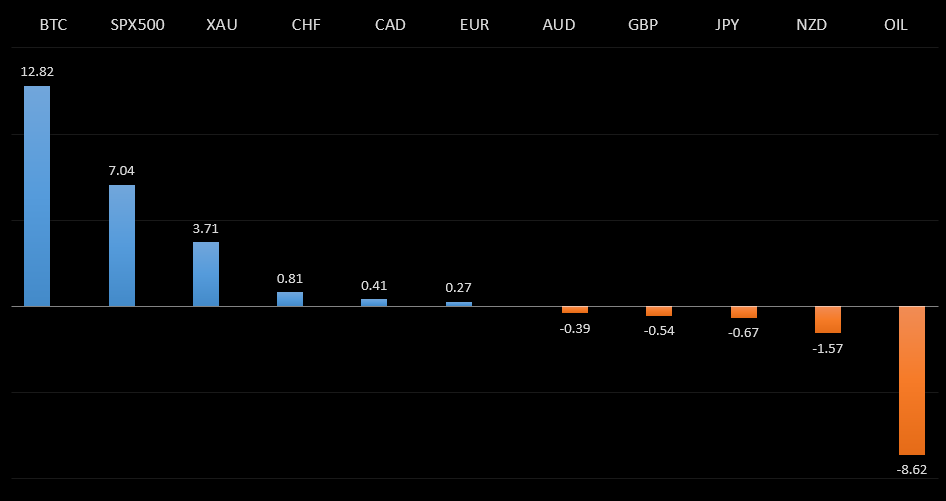
Peformance chart: 30 Day Performance vs. US dollar (%)
Suggested reading
- Emerging Markets Need a Savior. It's Not the Fed, J. Authers, Bloomberg (April 8, 2021)
- How Covid has Strained the World's Ports, C. Jones, Financial Times (April 7, 2021)
Chart talk: Technical & fundamental highlights
Choose pair:
EURUSD – technical overview
The market is in the process of correcting following an impressive run to its highest levels since April 2018. There is room for additional downside over the coming sessions, though ultimately, the overall structure remains constructive and the market will be looking for that next higher low ahead of a bullish continuation. Only a break back below 1.1500 would negate the outlook.EURUSD – fundamental overview
The Euro stretched its recovery on Wednesday but wasn't able to hold onto those gains. ECB's Knot said PEPP could be phased out later in the year if the H2 recovery plays out as expected. Thursday’s calendar features Eurozone and German construction PMIs, Eurozone producer prices, the ECB Minutes, US initial jobless claims, and a Fed Powell speech.EURUSD - Technical charts in detail
GBPUSD – technical overview
Technical studies are in the process of unwinding from stretched levels after the push to fresh multi-month highs. This leaves room for additional setbacks over the coming sessions, before the market considers a meaningful bullish continuation towards a retest of the 2018 high. But look for setbacks to now be very well supported into the 1.3500 area.GBPUSD – fundamental overview
Some hiccups in the vaccine rollout process and a market that had priced in much of the good news already, was selling the Pound aggressively in recent sessions, with a lot of the GBP selling pressure coming by way of a surging EURGBP cross rate. Thursday’s calendar features UK construction PMIs, Eurozone producer prices, the ECB Minutes, US initial jobless claims, and a Fed Powell speech.USDJPY – technical overview
The rally over the past several weeks is less bullish in the context of the longer-term chart, which shows the market very much confined to tighter consolidation. Overall, the market is still tracking below the top of the monthly Ichimoku cloud, with risk for the run to stall out in favour of a bearish reversal below 113.00. It would take a clear break back above 113.00 to negate the outlook.USDJPY – fundamental overview
Concerns over an uptick in Japanese coronavirus infections are having an impact on price action, with the Yen rallying on the risk off impact. At the same time, we're also seeing Yen demand in the aftermath of a dovish Fed Minutes communication. Thursday’s calendar features US initial jobless claims, and a Fed Powell speech.EURCHF – technical overview
Lots of sideways price action here, with no clear directional insight. For the most part, price action has been confined between 1.0600 and 1.1200, and it will take a weekly close above or below for an indication of the next big move.EURCHF – fundamental overview
The SNB remains uncomfortable with Franc appreciation and continues to remind the market it will need to be careful about any attempts at trying to force an appreciation in the currency. But the SNB will also need to be careful right now, as its strategy to weaken the Franc is facing headwinds from a less certain global outlook. Any signs of renewed risk liquidation will likely invite a very large wave of demand for the Franc that will put the SNB in the more challenging position of needing to back up its talk with action, that ultimately, may not prove to be as effective as it once was, given where we're at in the monetary policy cycle.AUDUSD – technical overview
Technical studies have turned up in recent months, after the market traded down to its lowest levels since 2003 in 2020. There is evidence of a longer-term bottom following the latest push back through 0.7000, though at this stage, there is risk for a deeper pullback to allow for shorter term studies to unwind. Setbacks should now be well supported ahead of 0.7400.AUDUSD – fundamental overview
The Australian Dollar saw early leveraged selling today, though exporter demand and USD selling from the dovish Fed Minutes provided support. The RBA will purchase up to AUD 2 billion of government bonds in today's QE operation, which will largely complete their first AUD 100 billion tranche of QE. The 2nd tranche of AUD 100 billion QE will start next week. Thursday’s calendar features US initial jobless claims, and a Fed Powell speech.USDCAD – technical overview
Has been in major decline since topping out in 2021 above 1.4600. At this stage, with the decline now well extended, the market is likely to find solid support into the 1.2300-1.2500 area ahead of a resumption of gains. Ultimately, only a weekly close below 1.2400 would suggest otherwise. Back above 1.2743 will strengthen the outlook.USDCAD – fundamental overview
The latest lockdown measures in Ontario haven't been a good thing for the Canadian Dollar. On the data front, there was a healthy jump in Canada Ivey PMIs, though this was offset by the negative news around the virus and narrowing of the trade surplus. Thursday’s calendar features US initial jobless claims, and a Fed Powell speech.NZDUSD – technical overview
Finally signs of topping out after a nice multi-month rally. Look for a weekly close below 0.7000 to strengthen the bearish outlook and expose deeper setbacks towards the 0.6500 area. Back above 0.7300 would be required to take the immediate pressure off the downside.NZDUSD – fundamental overview
The New Zealand Dollar has found some demand on dips on account of the broad based US Dollar selling following the dovish Fed Minutes. Still, data out of New Zealand on Thursday has been less than impressive after business confidence and the business activity outlook were on the decline. Thursday’s calendar features US initial jobless claims, and a Fed Powell speech.US SPX 500 – technical overview
Longer-term technical studies are looking quite exhausted and the market is showing signs of wanting to roll over after racing to another record high. Look for rallies to be well capped ahead of 4200, with a break back below 3700 to strengthen the outlook.US SPX 500 – fundamental overview
We're trading just off fresh record highs, and yet, with so little room for additional central bank accommodation, given an already depressed interest rate environment, the prospect for sustainable runs to the topside on easy money policy incentives and government stimulus, should no longer be as enticing to investors. Meanwhile, ongoing worry associated with coronavirus fallout should weigh more heavily on investor sentiment in 2021.GOLD (SPOT) – technical overview
The 2019 breakout above the 2016 high at 1375 was a significant development, opening the door for fresh record highs and an acceleration beyond the next major psychological barrier at 2000. Setbacks should now be well supported above 1600. Longer-term technical studies are however in the process of unwinding, with the market in search of a higher low ahead of a bullish continuation.GOLD (SPOT) – fundamental overview
The yellow metal continues to be well supported on dips with solid demand from medium and longer-term accounts. These players are more concerned about exhausted monetary policy, extended global equities, and coronavirus fallout. All of this should keep the commodity well supported, with many market participants also fleeing to the hard asset as the grand dichotomy of record high equities and record low yields comes to an unnerving climax.BTCUSD – technical overview
Monthly technical readings are still tracking in severe overbought territory heading into Q2 2021. Risk for any meaningful bullish continuation beyond the recent record high just over $60,000 should be limited over the coming days and weeks, with the higher probability leaning towards more correction and consolidation. There is now room for the correction to extend back down into the $40,000 area, where a higher low would ideally be sought out for a resumption of the bigger picture uptrend.BTCUSD – fundamental overview
Heading into 2021, there was a great anticipation for institutional adoption. And as we saw follow through on this anticipation, the bitcoin price tripled in value, exploding to a record high beyond $60,000. But with much of that now priced into the market, and with short-term bitcoin fundamentals still correlating with global risk sentiment, there does appear to be room for somewhat of an adjustment lower in the price before we see that next wave of renewed demand. We also believe bitcoin's emergence into the mainstream will invite more challenge and scrutiny from central banks and governments, which could translate to a bumpy ride in Q2 2021 before the asset once again finds its legs on the compelling longer-term value proposition.BTCUSD - Technical charts in detail
ETHUSD – technical overview
Despite the latest run to a fresh record high through $2,000, the market is looking quite extended following a massive run higher in 2021. At this stage, additional upside should be limited to allow for extended studies to unwind, before the market considers a meaningful bullish continuation. Look for setbacks to be well supported ahead of $1,500.ETHUSD – fundamental overview
Ether is in the process of an overdue price correction and consolidation after an explosive start to 2021 that resulted in fresh record highs beyond $2,000. There were already signs of overvaluation in the defi space and this in conjunction with a deterioration in global risk sentiment have been behind a lot of this downside pressure. Still, we believe there will be plenty of demand for ether down into the $1,000 area.