


Next 24 hours: Mixed signals from ECB officials
Today’s report: Reconsidering the Fed's outlook
We come into the new week with the US Dollar trying to make a run to the topside, this perhaps in anticipation of some more talk around a taper later this week when the Fed meets. Inflation data has certainly been picking up and this could force the Fed’s hand a bit more.
Wake-up call
- ECB speak
- UK re-opening
- Fed, BOJ
- vaccination rate
- surging OIL
- GDP projections
- Stocks vulnerable
- Dealers report
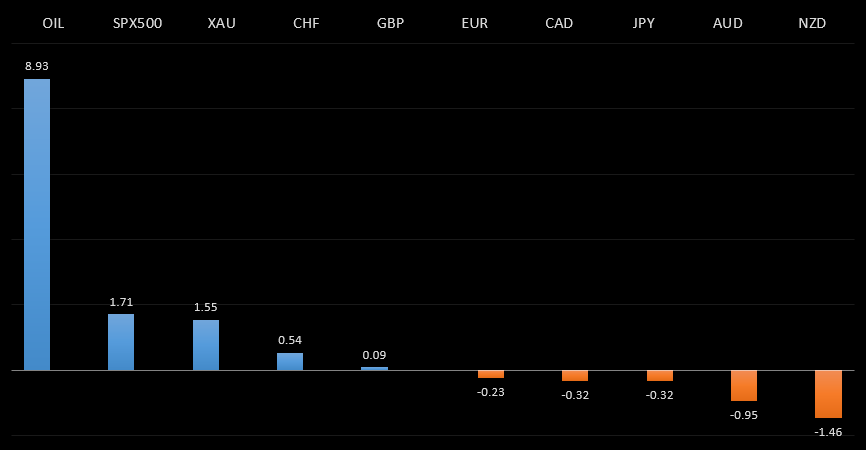
Peformance chart: 30 Day Performance vs. US dollar (%)
Suggested reading
- Inflation Scare Is More Heat Than Light So Far, J. Authers, Bloomberg (June 14, 2021)
- The Ultimate Superpower in Investing, C. Bilello, Compound Advisors (June 10, 2021)
Chart talk: Technical & fundamental highlights
Choose pair:
EURUSD – technical overview
The market has been looking for a higher low since topping out in 2021 up at 1.2350. Ideally, this next higher low is sought out ahead of 1.1600 in favour of the next major upside extension back through 1.2350 and towards a retest of the 2018 high at 1.2555 further up.EURUSD – fundamental overview
A wave of dovish speak from a number of ECB officials has been sourced as the primary driver behind this latest round of Euro selling. Last week, ECB Holzmann said the central bank would only need to review its monetary policy approach if inflation rose above 3%. Key standouts on today’s calendar include Eurozone industrial production, Canada manufacturing sales, a BOE Bailey speech, and US consumer inflation expectations.EURUSD - Technical charts in detail
GBPUSD – technical overview
Technical studies are in the process of consolidating from stretched levels after the push to fresh multi-month highs. This leaves room for additional consolidation, before the market considers a meaningful bullish continuation towards a retest of the 2018 high. But look for setbacks to now be very well supported into the 1.3500 area.GBPUSD – fundamental overview
The Pound has taken a hit on the surge in coronavirus cases that will likely delay the UK's phase 4 re-opening. We've also seen downside pressure on EU-UK tensions relating to Northern Ireland. Key standouts on today’s calendar include Eurozone industrial production, Canada manufacturing sales, a BOE Bailey speech, and US consumer inflation expectations.USDJPY – technical overview
The major pair has run into massive resistance in the form of the monthly Ichimoku cloud, and has since stalled out. This translates to a longer-term trend that is still bearish despite the run up we saw in 2021, with risk for deeper setbacks ahead. It would take a clear break back above 113.00 to negate the outlook.USDJPY – fundamental overview
The Yen hasn't been doing much at all, and we suspect more choppy sideways trade ahead of this week's central bank event risk in the form of the Fed and BOJ policy decisions. Key standouts on today’s calendar include Eurozone industrial production, Canada manufacturing sales, a BOE Bailey speech, and US consumer inflation expectations.AUDUSD – technical overview
Technical studies have turned up in recent months, after the market traded down to its lowest levels since 2003 in 2020. There is evidence of a longer-term bottom following the latest push back through 0.7000, though at this stage, there is risk for a deeper pullback to allow for shorter term studies to unwind. Setbacks should now be well supported ahead of 0.7400.AUDUSD – fundamental overview
The Australian Dollar took a hit last Friday, mostly on the back of broad based US Dollar demand, though we also saw Aussie selling from softer Aussie data. Another potential Aussie strain has come from concern about an uptick in the coronavirus given the low vaccination rate in the country. But trading conditions are thinner on this Monday on account of the Australia holiday. Key standouts on today’s calendar include Eurozone industrial production, Canada manufacturing sales, a BOE Bailey speech, and US consumer inflation expectations.USDCAD – technical overview
Has been in major decline since topping out in 2021 above 1.4600. At this stage, with the decline now well extended, the market is likely to find solid support into the 1.2000 area ahead of a resumption of gains. Ultimately, only a weekly close below 1.2000 would suggest otherwise. Back above 1.2352 will strengthen the outlook.USDCAD – fundamental overview
Broad based demand for the US Dollar and profit taking on a well extended Loonie have been behind most of the latest slide in the Canadian Dollar. The weakness in the Loonie comes despite Friday's strong batch of Canada data and surging OIL prices. Key standouts on today’s calendar include Eurozone industrial production, Canada manufacturing sales, a BOE Bailey speech, and US consumer inflation expectations.NZDUSD – technical overview
The market has been very well supported in recent months and there is evidence of a longer-term base. Look for setbacks to hold up above 0.7100, with sights set on a run back towards the 0.7500 area.NZDUSD – fundamental overview
The New Zealand Dollar had come under intense pressure on Friday as the broad market ran back into the US Dollar. We have however been seeing some demand for Kiwi into dips, after Monday's NZIER quarterly consensus survey revealed higher GDP projections. Key standouts on today’s calendar include Eurozone industrial production, Canada manufacturing sales, a BOE Bailey speech, and US consumer inflation expectations.US SPX 500 – technical overview
Longer-term technical studies are looking quite exhausted and the market is showing signs of wanting to roll over after racing to another record high. Look for rallies to be well capped ahead of 4300, with a break back below 4000 to strengthen the outlook.US SPX 500 – fundamental overview
We're trading just off fresh record highs, and yet, with so little room for additional central bank accommodation, given an already depressed interest rate environment, the prospect for sustainable runs to the topside on easy money policy incentives and government stimulus, should no longer be as enticing to investors. Meanwhile, ongoing worry associated with coronavirus fallout and risk of rising inflation should weigh more heavily on investor sentiment into the second half of 2021.GOLD (SPOT) – technical overview
The 2019 breakout above the 2016 high at 1375 was a significant development, opening the door for fresh record highs and an acceleration beyond the next major psychological barrier at 2000. Setbacks should now be well supported above 1600.GOLD (SPOT) – fundamental overview
The yellow metal continues to be well supported on dips with solid demand from medium and longer-term accounts. These players are more concerned about exhausted monetary policy, extended global equities, and coronavirus fallout. All of this should keep the commodity well supported, with many market participants also fleeing to the hard asset as the grand dichotomy of record high equities and record low yields comes to an unnerving climax.