


Today’s report: The magic trick is still working
What’s most interesting about financial markets as the week gets set to close out is the fact that there really has been no negative response to this week’s inflation reads, not only in the US, but around the globe, that continue to show upwards pressure.
Wake-up call
- ECB decision
- JPM report
- producer prices
- China stocks
- upbeat Lane
- softer data
- Stocks vulnerable
- Dealers report
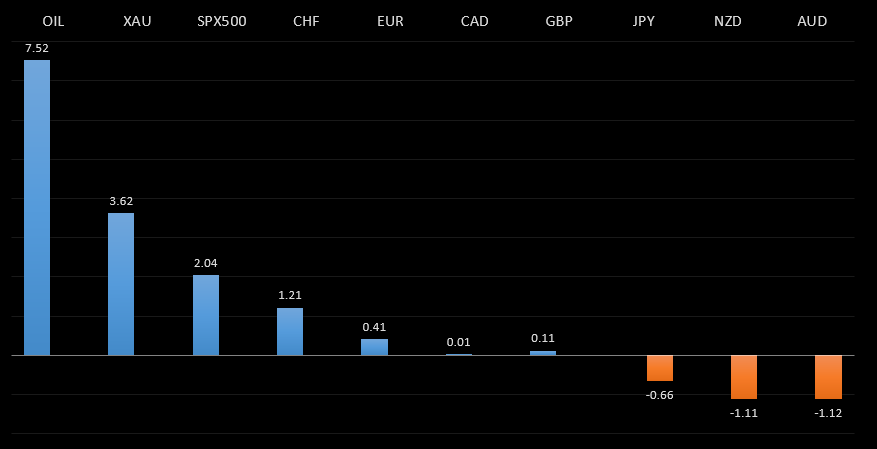
Peformance chart: 30 Day Performance vs. US dollar (%)
Suggested reading
- What's Scarier Than the Inflation Scare?, J. Authers, Bloomberg (June 11, 2021)
- The End of Hyper-Globalization, D. Rodrik, Project Syndicate (June 7, 2021)
Chart talk: Technical & fundamental highlights
Choose pair:
EURUSD – technical overview
The market has been looking for a higher low since topping out in 2021 up at 1.2350. Ideally, this next higher low is sought out ahead of 1.1600 in favour of the next major upside extension back through 1.2350 and towards a retest of the 2018 high at 1.2555 further up.EURUSD – fundamental overview
No surprises from the ECB on Thursday, with the central bank leaving policy on hold and maintaining PEPP. There were some initial bids in the aftermath of the decision on the upgraded near-term outlook, but this demand didn't really last with the central bank's longer-term outlook remaining subdued. Key standouts on today’s calendar include UK trade, industrial production, manufacturing production and GDP updates, and US Michigan sentiment.EURUSD - Technical charts in detail
GBPUSD – technical overview
Technical studies are in the process of consolidating from stretched levels after the push to fresh multi-month highs. This leaves room for additional consolidation, before the market considers a meaningful bullish continuation towards a retest of the 2018 high. But look for setbacks to now be very well supported into the 1.3500 area.GBPUSD – fundamental overview
The Pound has held up well in recent sessions, getting a lift from the JP Morgan call for 8.1% growth this year and a BOE rate hike in late 2022. Key standouts on today’s calendar include UK trade, industrial production, manufacturing production and GDP updates, and US Michigan sentiment.USDJPY – technical overview
The major pair has run into massive resistance in the form of the monthly Ichimoku cloud, and has since stalled out. This translates to a longer-term trend that is still bearish despite the run up we saw in 2021, with risk for deeper setbacks ahead. It would take a clear break back above 113.00 to negate the outlook.USDJPY – fundamental overview
The Yen hasn't been doing much at all, though we did see some demand on Thursday on the back of the latest solid data and producer prices beat. Key standouts on today’s calendar include UK trade, industrial production, manufacturing production and GDP updates, and US Michigan sentiment.AUDUSD – technical overview
Technical studies have turned up in recent months, after the market traded down to its lowest levels since 2003 in 2020. There is evidence of a longer-term bottom following the latest push back through 0.7000, though at this stage, there is risk for a deeper pullback to allow for shorter term studies to unwind. Setbacks should now be well supported ahead of 0.7400.AUDUSD – fundamental overview
The Australian Dollar is getting a boost into the end of the week on higher Aussie inflation expectations and rallying Chinese stocks. Consensus is now growing for an RBA taper next month. Key standouts on today’s calendar include UK trade, industrial production, manufacturing production and GDP updates, and US Michigan sentiment.USDCAD – technical overview
Has been in major decline since topping out in 2021 above 1.4600. At this stage, with the decline now well extended, the market is likely to find solid support into the 1.2000 area ahead of a resumption of gains. Ultimately, only a weekly close below 1.2000 would suggest otherwise. Back above 1.2352 will strengthen the outlook.USDCAD – fundamental overview
The Canadian Dollar had been bid into Friday, helped along by higher stocks and bullish Bank of Canada Lane comments. The central banker has said he is confident in a strong summer recovery and that the latest virus setback should be temporary. Key standouts on today’s calendar include UK trade, industrial production, manufacturing production and GDP updates, Canada capacity utilization, and US Michigan sentiment.NZDUSD – technical overview
The market has been very well supported in recent months and there is evidence of a longer-term base. Look for setbacks to hold up above 0.7100, with sights set on a run back towards the 0.7500 area.NZDUSD – fundamental overview
The New Zealand Dollar has been holding up on rallying global equities but has also been a laggard on softer data out of New Zealand this week. Key standouts on today’s calendar include UK trade, industrial production, manufacturing production and GDP updates, and US Michigan sentiment.US SPX 500 – technical overview
Longer-term technical studies are looking quite exhausted and the market is showing signs of wanting to roll over after racing to another record high. Look for rallies to be well capped above of 4200, with a break back below 4000 to strengthen the outlook.US SPX 500 – fundamental overview
We're trading just off fresh record highs, and yet, with so little room for additional central bank accommodation, given an already depressed interest rate environment, the prospect for sustainable runs to the topside on easy money policy incentives and government stimulus, should no longer be as enticing to investors. Meanwhile, ongoing worry associated with coronavirus fallout and risk of rising inflation should weigh more heavily on investor sentiment into the second half of 2021.GOLD (SPOT) – technical overview
The 2019 breakout above the 2016 high at 1375 was a significant development, opening the door for fresh record highs and an acceleration beyond the next major psychological barrier at 2000. Setbacks should now be well supported above 1600.GOLD (SPOT) – fundamental overview
The yellow metal continues to be well supported on dips with solid demand from medium and longer-term accounts. These players are more concerned about exhausted monetary policy, extended global equities, and coronavirus fallout. All of this should keep the commodity well supported, with many market participants also fleeing to the hard asset as the grand dichotomy of record high equities and record low yields comes to an unnerving climax.