


Today’s report: Yield differentials keep moving with the Buck
We come into Friday with the US Dollar running strong in the aftermath of a Fed decision that rocked the currency market after the central bank revealed a hawkish shift in the dot plot. The Fed is now projecting two 25 basis point rate hikes in 2023 and yield differentials have responded accordingly.
Wake-up call
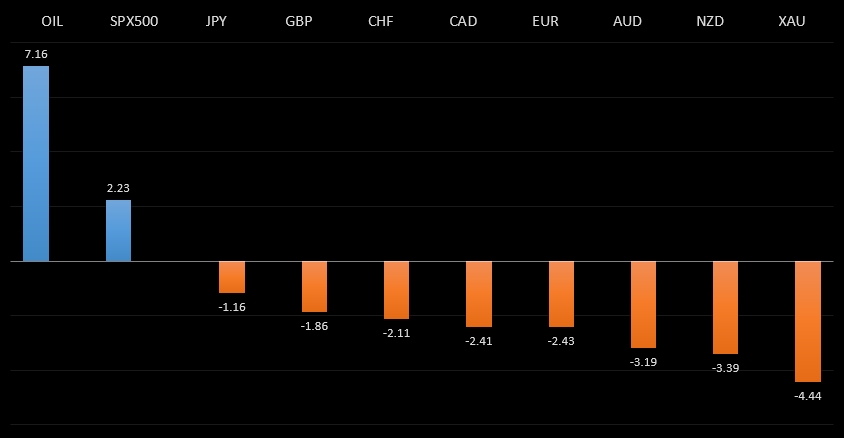
Peformance chart: 30 Day Performance vs. US dollar (%)
Suggested reading
- Market Narratives Have Pushed Aside Fundamentals, B. Ritholtz, Bloomberg (June 18, 2021)
- Is now a good time to open a new restaurant?, D. Garrahan, Forbes (June 16, 2021)
Chart talk: Technical & fundamental highlights
Choose pair:
EURUSD – technical overview
The market has been looking for a higher low since topping out in 2021 up at 1.2350. Ideally, this next higher low is sought out ahead of 1.1600 in favour of the next major upside extension back through 1.2350 and towards a retest of the 2018 high at 1.2555 further up.EURUSD – fundamental overview
The Euro has come under intense pressure on the back of dovish ECB Lane comments and this week's hawkish shift in the Fed dot plot. Meanwhile, Eurozone construction output slowed in April. Key standouts on today’s calendar include UK retail sales and the Eurozone current account. There is no first tier data on the docket in North America.EURUSD - Technical charts in detail
GBPUSD – technical overview
Technical studies are in the process of consolidating from stretched levels after the push to fresh multi-month highs. This leaves room for additional consolidation, before the market considers a meaningful bullish continuation towards a retest of the 2018 high. But look for setbacks to now be very well supported into the 1.3500 area.GBPUSD – fundamental overview
The Pound hasn't been immune to fallout in the currency market in the aftermath of the hawkish shift in the Fed's dot plot. But we have seen some demand into dips on the back of hotter UK inflation reads and a growing expectation the BOE will follow in the Fed's path when it meets next week. Key standouts on today’s calendar include UK retail sales and the Eurozone current account. There is no first tier data on the docket in North America.USDJPY – technical overview
The major pair has run into massive resistance in the form of the monthly Ichimoku cloud, and has since stalled out. This translates to a longer-term trend that is still bearish despite the run up we saw in 2021, with risk for deeper setbacks ahead. It would take a clear break back above 113.00 to negate the outlook.USDJPY – fundamental overview
The BOJ event risk was a non event, with no major changes as widely expected. Still, we did see some disappointment after the central bank failed to signal a resumption or ramping up of ETF purchases. Key standouts on today’s calendar include UK retail sales and the Eurozone current account. There is no first tier data on the docket in North America.AUDUSD – technical overview
Technical studies have turned up in recent months, after the market traded down to its lowest levels since 2003 in 2020. There is evidence of a longer-term bottom following the latest push back through 0.7000, though at this stage, there is risk for a deeper pullback to allow for shorter term studies to unwind. Setbacks should now be well supported ahead of 0.7400.AUDUSD – fundamental overview
The Australian Dollar has taken its hits this week, mostly from fallout in the aftermath of the hawkish shift in the Fed dot plot. But there has also been some worry around an emerging coronavirus outbreak in Sydney. Key standouts on today’s calendar include UK retail sales and the Eurozone current account. There is no first tier data on the docket in North America.USDCAD – technical overview
Has been in major decline since topping out in 2021 above 1.4600. At this stage, with the decline now well extended, the market is likely to find solid support into the 1.2000 area ahead of a resumption of gains. Ultimately, only a weekly close below 1.2000 would suggest otherwise. Back above 1.2352 strengthens the outlook.USDCAD – fundamental overview
Hot Canada CPI and some more solid Canada economic data this week haven't been enough to prevent the Canadian Dollar from selling off in the aftermath of the Fed's hawkish shift in the dot plot. Key standouts on today’s calendar include UK retail sales, the Eurozone current account and Canada housing data.NZDUSD – technical overview
The market has been very well supported in recent months and there is evidence of a longer-term base. Look for setbacks to hold up above 0.6900, with sights set on a run back towards the 0.7500 area.NZDUSD – fundamental overview
The RBNZ has announced that it will taper QE purchases yet again next week, though this has done nothing to prop the New Zealand Dollar. At the moment, the Kiwi rate is getting hit on the back of this week's hawkish shift in the Fed dot plot. Key standouts on today’s calendar include UK retail sales and the Eurozone current account. There is no first tier data on the docket in North America.US SPX 500 – technical overview
Longer-term technical studies are looking quite exhausted and the market is showing signs of wanting to roll over after racing to another record high. Look for rallies to be well capped ahead of 4300, with a break back below 4000 to strengthen the outlook.US SPX 500 – fundamental overview
We're trading just off fresh record highs, and yet, with so little room for additional central bank accommodation, given an already depressed interest rate environment, the prospect for sustainable runs to the topside on easy money policy incentives and government stimulus, should no longer be as enticing to investors. Meanwhile, ongoing worry associated with coronavirus fallout and risk of rising inflation should weigh more heavily on investor sentiment into the second half of 2021 as the Fed is forced to consider raising rates sooner than later.GOLD (SPOT) – technical overview
The 2019 breakout above the 2016 high at 1375 was a significant development, opening the door for fresh record highs and an acceleration beyond the next major psychological barrier at 2000. Setbacks should now be well supported above 1600.GOLD (SPOT) – fundamental overview
The yellow metal continues to be well supported on dips with solid demand from medium and longer-term accounts. These players are more concerned about exhausted monetary policy, extended global equities, and coronavirus fallout. All of this should keep the commodity well supported, with many market participants also fleeing to the hard asset as the grand dichotomy of record high equities and record low yields comes to an unnerving climax.