


Next 24 hours: An attempt at a comeback
Today’s report: Financial markets in turmoil post Fed
We continue to see fallout from the FOMC after the Federal Reserve flagged 2 rate hikes out in 2023. The resulting price action has been exceptionally USD bullish as yield differentials shift back in the Buck’s favour, while weighing significantly on investor sentiment.
Wake-up call
- Policy divergence
- retail sales
- Safe haven
- Aussie hit
- policy shift
- free trade
- Stocks vulnerable
- Dealers report
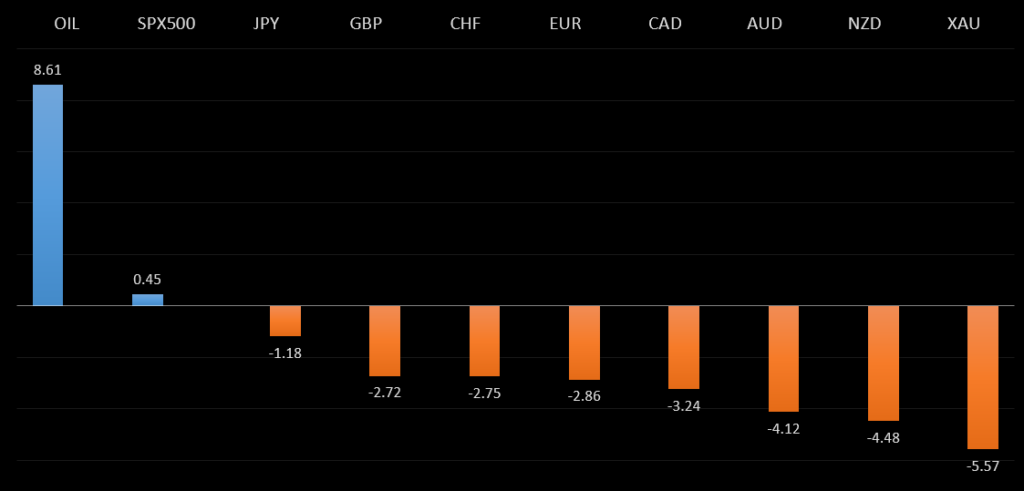
Peformance chart: 30 Day Performance vs. US dollar (%)
Suggested reading
- Markets Start to Suspect the Fed Has Cold Feet, J. Authers, Bloomberg (June 18, 2021)
- Is Now a Good Time to Open a New Restaurant?, D. Garrahan, Forbes (June 16, 2021)
Chart talk: Technical & fundamental highlights
Choose pair:
EURUSD – technical overview
The market has been looking for a higher low since topping out in 2021 up at 1.2350. Ideally, this next higher low is sought out ahead of 1.1600 in favour of the next major upside extension back through 1.2350 and towards a retest of the 2018 high at 1.2555 further up.EURUSD – fundamental overview
The divergence between Fed and ECB policy has become more pronounced in the aftermath of last week's Fed decision in which the central bank indicated there would be two rate hikes in 2023. Meanwhile, ECB officials have been out talking dovish and calling for more stimulus. There has also been concern about the Delta virus on the European continent. Looking ahead, key standouts on the calendar come in the form of the Chicago Fed national activity index and a speech from ECB President Lagarde.EURUSD - Technical charts in detail
GBPUSD – technical overview
Technical studies are in the process of consolidating from stretched levels after the push to fresh multi-month highs. This leaves room for additional consolidation, before the market considers a meaningful bullish continuation towards a retest of the 2018 high. But look for setbacks to now be very well supported into the 1.3500 area.GBPUSD – fundamental overview
Clearly, a lot of the USD demand in the previous week came from the Fed decision. But we've also seen the Pound getting hit on the horrid UK retail sales print and risks associated with the growing Delta virus variant. Looking ahead, key standouts on the calendar come in the form of the Chicago Fed national activity index and a speech from ECB President Lagarde.USDJPY – technical overview
The major pair has run into massive resistance in the form of the monthly Ichimoku cloud, and has since stalled out. This translates to a longer-term trend that is still bearish despite the run up we saw in 2021, with risk for deeper setbacks ahead. It would take a clear break back above 113.00 to negate the outlook.USDJPY – fundamental overview
The Yen has come back into demand in a big way as the new week gets going, with the currency reacting to traditional flows and rallying on the back of the broad based flight to safety in response to fallout from last week's Fed decision. Looking ahead, key standouts on the calendar come in the form of the Chicago Fed national activity index and a speech from ECB President Lagarde.AUDUSD – technical overview
Technical studies have turned up in recent months, after the market traded down to its lowest levels since 2003 in 2020. There is evidence of a longer-term bottom following the latest push back through 0.7000, though at this stage, there is risk for a deeper pullback to allow for shorter term studies to unwind. Setbacks should now be well supported ahead of 0.7400.AUDUSD – fundamental overview
Aussie retail sales have come in softer on Monday. This only adds to the existing downside pressure on the currency from the more hawkish shift in the Fed policy outlook in the aftermath of last week's decision. Looking ahead, key standouts on the calendar come in the form of the Chicago Fed national activity index and a speech from ECB President Lagarde.USDCAD – technical overview
Has been in major decline since topping out in 2021 above 1.4600. At this stage, with the decline now well extended, the market is likely to find solid support into the 1.2000 area ahead of a resumption of gains. Ultimately, only a weekly close below 1.2000 would suggest otherwise. Back above 1.2500 strengthens the outlook.USDCAD – fundamental overview
There hasn't been much at all for the Canadian Dollar to feel good about of late, with the exception of ongoing demand for the price of OIL. But overall, the Loonie has come under a lot of pressure in the aftermath of last week's hawkish shift in the Fed policy outlook. Looking ahead, key standouts on the calendar come in the form of the Chicago Fed national activity index and a speech from ECB President Lagarde.NZDUSD – technical overview
The market has been very well supported in recent months and there is evidence of a longer-term base. Look for setbacks to hold up above 0.6700, with sights set on a run back towards the 0.7500 area.NZDUSD – fundamental overview
Most of the downside in the New Zealand Dollar has come from broad based US Dollar demand from last week's hawkish shift in the Fed policy outlook. This has resulted in fresh 2021 lows for the currency against the Buck. Meanwhile, the UK and New Zealand released a joint statement that both sides have held constructive and productive discussions on a free trade agreement, and will accelerate talks with the aim of reaching an in-principle agreement in August. Looking ahead, key standouts on the calendar come in the form of the Chicago Fed national activity index and a speech from ECB President Lagarde.US SPX 500 – technical overview
Longer-term technical studies are looking quite exhausted and the market is showing signs of wanting to roll over after racing to another record high. Look for rallies to be well capped ahead of 4300, with a break back below 4000 to strengthen the outlook.US SPX 500 – fundamental overview
We're trading just off fresh record highs, and yet, with so little room for additional central bank accommodation, given an already depressed interest rate environment, the prospect for sustainable runs to the topside on easy money policy incentives and government stimulus, should no longer be as enticing to investors. Meanwhile, ongoing worry associated with coronavirus fallout and risk of rising inflation should weigh more heavily on investor sentiment into the second half of 2021 as the Fed is forced to consider raising rates sooner than later.GOLD (SPOT) – technical overview
The 2019 breakout above the 2016 high at 1375 was a significant development, opening the door for fresh record highs and an acceleration beyond the next major psychological barrier at 2000. Setbacks should now be well supported above 1600.GOLD (SPOT) – fundamental overview
The yellow metal continues to be well supported on dips with solid demand from medium and longer-term accounts. These players are more concerned about exhausted monetary policy, extended global equities, and coronavirus fallout. All of this should keep the commodity well supported, with many market participants also fleeing to the hard asset as the grand dichotomy of record high equities and record low yields comes to an unnerving climax.