


Next 24 hours: The extent of policy divergence
Today’s report: How will the other central banks respond?
The market is still digesting the latest Fed decision as the week gets going. Looking back, investors were clearly disappointed with the more hawkish leaning decision, which has resulted in downside pressure in stocks and upside in the US Dollar.
Wake-up call
- German GDP
- BOE decision
- Policy divergence
- RBA bets
- Oil demand
- stocks rebound
- Stocks vulnerable
- Dealers report
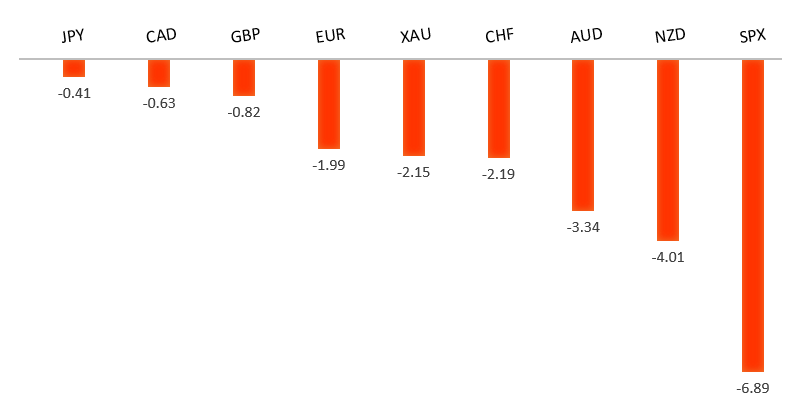
Peformance chart: 30 Day Performance vs. US dollar (%)
Suggested reading
- Credit Traders Lack Edge in Fed's New Regime, L. Abramowicz, Bloomberg (January 30, 2022)
- International Investors in Chinese Companies Face Growing Risks, J. Kynge, Financial Times (January 26, 2022)
Chart talk: Technical & fundamental highlights
Choose pair:
EURUSD – technical overview
The latest breakdown back below 1.1200 opens the door for a fresh downside extension towards the 1.0900 area. At this point, it will take a break back above the 2022 high at 1.1483 to take the immediate pressure off the downside.EURUSD – fundamental overview
Most of the downside pressure on the Euro has been coming from the US Dollar side of the equation, with yield differentials that much more favourable to the US Dollar in the aftermath of the Fed decision. But we've also seen downside pressure from softer German GDP reads and a decline in Eurozone economic confidence. Key standouts on today’s calendar come in the form of Eurozone GDP, German inflation, Canada producer prices, Chicago PMIs, and Dallas Fed manufacturing.EURUSD - Technical charts in detail
GBPUSD – technical overview
The market is in a correction phase in the aftermath of the run to fresh multi-month highs in 2021. At this stage, additional setbacks should be limited to the 1.3000 area ahead of the next major upside extension towards a retest and break of critical resistance in the form of the 2018 high. Back above 1.3835 takes pressure off the downside.GBPUSD – fundamental overview
The Pound has held up relatively well against its peers, but hasn't been able to avoid weakness against the US Dollar in the aftermath of the hawkish FOMC decision. Attention will now turn to this week's Bank of England policy decision. Key standouts on today’s calendar come in the form of Eurozone GDP, German inflation, Canada producer prices, Chicago PMIs, and Dallas Fed manufacturing.USDJPY – technical overview
The longer-term trend is bearish despite the recent run higher. Look for additional upside to be limited, with scope for a topside failure and bearish resumption back down towards the 100.00 area. It would take a clear break back above 117.00 to negate the outlook.USDJPY – fundamental overview
The Bank of Japan remains committed to accommodative policy which has made the yield differential gap with the US Dollar that much wider in favour of the Buck in the aftermath of a hawkish FOMC decision last week. This has contributed to Yen weakness despite the risk off flow in global markets. Key standouts on today’s calendar come in the form of Eurozone GDP, German inflation, Canada producer prices, Chicago PMIs, and Dallas Fed manufacturing.AUDUSD – technical overview
The Australian Dollar has been in the process of a healthy correction following the impressive run towards a retest of the 2018 high in 2021. At this stage, the correction is starting to look stretched and setbacks should be well supported above 0.7000 on a weekly close basis. A weekly close below 0.7000 will force a bearish shift.AUDUSD – fundamental overview
The Australian Dollar is trying to recover into the new week, getting help from a recovery in US equities and some hawkish expectations heading into tomorrow's RBA decision. Key standouts on today’s calendar come in the form of Eurozone GDP, German inflation, Canada producer prices, Chicago PMIs, and Dallas Fed manufacturing.USDCAD – technical overview
Finally signs of a major bottom in the works after a severe decline from the 2020 high. A recent weekly close back above 1.2500 encourages the constructive outlook and opens the door for a push back towards next critical resistance in the 1.3000 area. Any setbacks should be well supported into the 1.2200s.USDCAD – fundamental overview
The Canadian Dollar comes into the new week under pressure in the aftermath of a less hawkish than expected Bank of Canada decision and a more hawkish than expected FOMC decision. Oil prices have remained elevated however, which has helped to slow the pace of Loonie declines. Key standouts on today’s calendar come in the form of Eurozone GDP, German inflation, Canada producer prices, Chicago PMIs, and Dallas Fed manufacturing.NZDUSD – technical overview
Setbacks have intensified in recent weeks with the market trading down to fresh multi-month lows. A recent breakdown below the 0.6700 area opens the door for a drop towards 0.6500 in the sessions ahead.NZDUSD – fundamental overview
The New Zealand Dollar has finally found some demand after getting slammed to multi-month lows, with the currency propped up on the rebound in stocks and hawkish expectations from the RBNZ in 2022. Key standouts on today’s calendar come in the form of Eurozone GDP, German inflation, Canada producer prices, Chicago PMIs, and Dallas Fed manufacturing.US SPX 500 – technical overview
Longer-term technical studies are in the process of unwinding from extended readings off record highs. The latest breakdown below 4,272 opens the door for the next major downside extension towards 3,500. Back above 4,612 will be required at a minimum to take the immediate pressure off the downside.US SPX 500 – fundamental overview
With so little room for additional central bank accommodation, given an already depressed interest rate environment, the prospect for sustainable runs to the topside on easy money policy incentives and government stimulus, should no longer be as enticing to investors. Meanwhile, ongoing worry associated with coronavirus fallout and risk of rising inflation should weigh more heavily on investor sentiment in Q1 2022.GOLD (SPOT) – technical overview
The 2019 breakout above the 2016 high at 1375 was a significant development, opening the door for fresh record highs and an acceleration beyond the next major psychological barrier at 2000. Setbacks should now be well supported above 1600.GOLD (SPOT) – fundamental overview
The yellow metal continues to be well supported on dips with solid demand from medium and longer-term accounts. These players are more concerned about exhausted monetary policy, extended global equities, and coronavirus fallout. All of this should keep the commodity well supported, with many market participants also fleeing to the hard asset as the grand dichotomy of record high equities and record low yields comes to an unnerving climax.