


Next 24 hours: Key takeaways right now
Today’s report: Shifting expectations and currency impact
Since last week’s hawkish FOMC decision, we have heard from various Fed officials calming these hawkish expectations, while at the same time, the market has done a good job finally pricing in up to 5 hikes in 2022. This leaves the balance of risk shifting back out of the US Dollar’s favor, at least for the time being.
Wake-up call
- NIRP
- Strong demand
- Fed hawkishness
- sentiment uptick
- GDP miss
- employment data
- Stocks vulnerable
- Dealers report
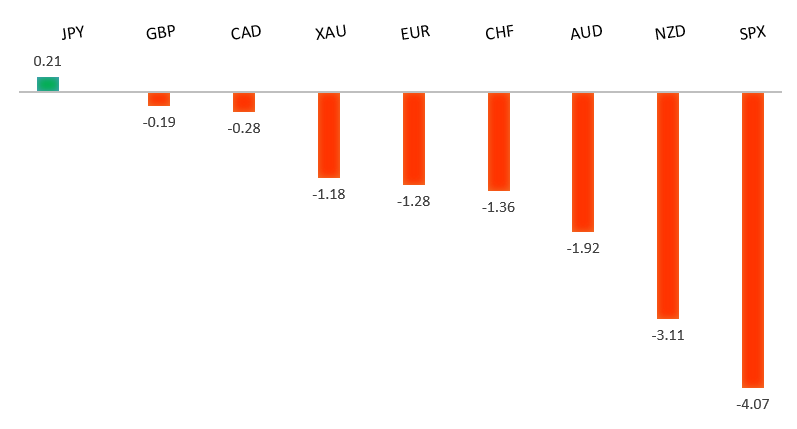
Peformance chart: 30 Day Performance vs. US dollar (%)
Suggested reading
- India’s Plan for Post-Pandemic Economy Is a Risky Ploy, A. Mukherjee, Bloomberg (February 1, 2022)
- Is Wealth Management Changing for Women?, Financial Times (February 1, 2022)
Chart talk: Technical & fundamental highlights
Choose pair:
EURUSD – technical overview
The latest breakdown back below 1.1200 opens the door for a fresh downside extension towards the 1.0900 area. At this point, it will take a break back above the 2022 high at 1.1483 to take the immediate pressure off the downside.EURUSD – fundamental overview
The market is pricing more hawkishness from the ECB this week in light of recent inflation data and ECB speak heading into the event risk. There is a growing expectations the central bank will now pivot away from NIRP. Key standouts on today’s calendar come from Eurozone inflation and US ADP employment.EURUSD - Technical charts in detail
GBPUSD – technical overview
The market is in a correction phase in the aftermath of the run to fresh multi-month highs in 2021. At this stage, additional setbacks should be limited to the 1.3000 area ahead of the next major upside extension towards a retest and break of critical resistance in the form of the 2018 high. Back above 1.3835 takes pressure off the downside.GBPUSD – fundamental overview
There is no longer any appetite to be selling Pounds ahead of tomorrow's BOE decision. The combination of rising inflation and some very strong housing numbers are only reinforcing hawkish leaning expectations. Key standouts on today’s calendar come from Eurozone inflation and US ADP employment.USDJPY – technical overview
The longer-term trend is bearish despite the recent run higher. Look for additional upside to be limited, with scope for a topside failure and bearish resumption back down towards the 100.00 area. It would take a clear break back above 117.00 to negate the outlook.USDJPY – fundamental overview
Yen weakness has slowed down in recent sessions despite the ongoing recovery in US equities. A lot of this could be around the market having already priced all of the Fed hawkishness for 2022, with expectation for 5 rate hikes now well absorbed. This leaves the balance of risk tilting back in the Yen's favour. Key standouts on today’s calendar come from Eurozone inflation and US ADP employment.AUDUSD – technical overview
The Australian Dollar has been in the process of a healthy correction following the impressive run towards a retest of the 2018 high in 2021. At this stage, the correction is starting to look stretched and setbacks should be well supported above 0.7000 on a weekly close basis. A weekly close below 0.7000 will force a bearish shift.AUDUSD – fundamental overview
Not a lot of surprise from the RBA on Tuesday. As expected, the RBA announced it was ending its QE program. A number of factors were cited, but the most important one was the central bank is getting closer to achieving its employment and inflation goals. The RBA also kept the cash rate at 0.10% and the interest rate on exchange settlement balances at 0%. Aussie gains post decision have mostly come from ongoing support for risk assets. Key standouts on today’s calendar come from Eurozone inflation and US ADP employment.USDCAD – technical overview
Finally signs of a major bottom in the works after a severe decline from the 2020 high. A recent weekly close back above 1.2500 encourages the constructive outlook and opens the door for a push back towards next critical resistance in the 1.3000 area. Any setbacks should be well supported into the 1.2200s.USDCAD – fundamental overview
The Canadian Dollar has managed a decent recovery on the back of rallying oil prices and a recovery in global risk sentiment. However, Loonie gains were held up somewhat on Tuesday on the back of a softer Canada GDP report. Key standouts on today’s calendar come from Eurozone inflation and US ADP employment.NZDUSD – technical overview
Setbacks have intensified in recent weeks with the market trading down to fresh multi-month lows. A recent breakdown below the 0.6700 area opens the door for a drop towards 0.6500 in the sessions ahead.NZDUSD – fundamental overview
Earlier today, New Zealand employment data came in mixed. But the New Zealand Dollar has finally found some demand after getting slammed to multi-month lows, with the currency propped up on the rebound in stocks and hawkish expectations from the RBNZ in 2022. Key standouts on today’s calendar come from Eurozone inflation and US ADP employment.US SPX 500 – technical overview
Longer-term technical studies are in the process of unwinding from extended readings off record highs. The latest breakdown below 4,272 opens the door for the next major downside extension towards 3,500. Back above 4,612 will be required at a minimum to take the immediate pressure off the downside.US SPX 500 – fundamental overview
With so little room for additional central bank accommodation, given an already depressed interest rate environment, the prospect for sustainable runs to the topside on easy money policy incentives and government stimulus, should no longer be as enticing to investors. Meanwhile, ongoing worry associated with coronavirus fallout and risk of rising inflation should weigh more heavily on investor sentiment in Q1 2022.GOLD (SPOT) – technical overview
The 2019 breakout above the 2016 high at 1375 was a significant development, opening the door for fresh record highs and an acceleration beyond the next major psychological barrier at 2000. Setbacks should now be well supported above 1600.GOLD (SPOT) – fundamental overview
The yellow metal continues to be well supported on dips with solid demand from medium and longer-term accounts. These players are more concerned about exhausted monetary policy, extended global equities, and coronavirus fallout. All of this should keep the commodity well supported, with many market participants also fleeing to the hard asset as the grand dichotomy of record high equities and record low yields comes to an unnerving climax.