


Next 24 hours: USD slide extends into August
Today’s report: Where we're at into August
As we head into the new week, we’re looking at a stronger trend of US Dollar outflows and higher US equities. All of this has been driven by a dovish repricing of Fed expectations in the aftermath of last week’s Fed decision and negative US GDP print.
Wake-up call
- Euro inflation
- consumer credit
- Fed repricing
- US PCE
- Oil, GDP
- Local data
- Stocks vulnerable
- Dealers report
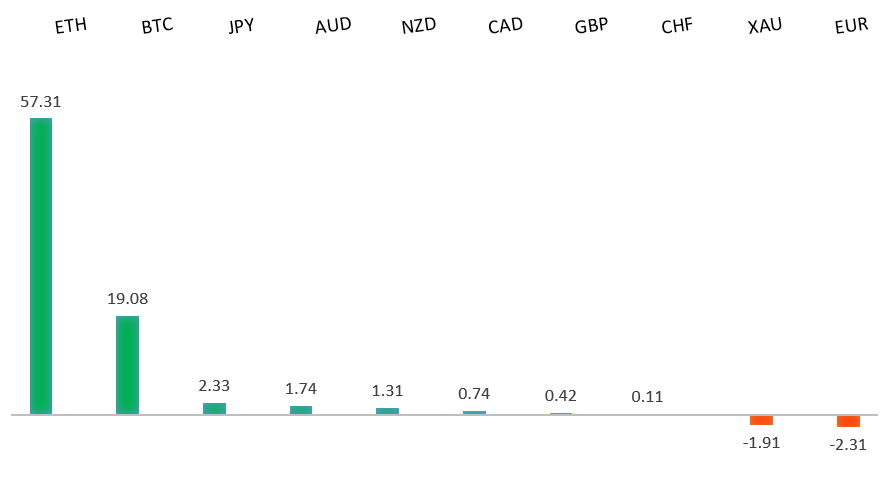
Peformance chart: 30 Day Performance vs. US dollar (%)
Suggested reading
- Putin Won’t Let OPEC Help Bring Down Oil Prices, J. Lee, Bloomberg (July 31, 2022)
- Could Protectionism Make Food Insecurity Even Worse?, B. Barkin, FT (July 28, 2022)
Chart talk: Technical & fundamental highlights
Choose pair:
EURUSD – technical overview
The market has come under intense pressure in recent months, with setbacks accelerating below the critical multi-year low from 2017 at 1.0340. This sets up a test of monumental support in the form of parity. At the same time, technical studies are tracking in oversold territory, suggesting additional setbacks should be limited. Back above 1.0500 would be required to take the immediate pressure off the downside.EURUSD – fundamental overview
The Euro has been trying to make its way back to the topside. There has been chatter of HFTs on the bid. Meanwhile, GDP readings on the whole out of the zone have been positive, and this in conjunction with ongoing signs of rising inflation, has been enough to fuel more demand for the single currency. Key standouts on Monday’s calendar come from German retail sales, German PMI reads, Eurozone and UK PMI reads, Eurozone unemployment, US ISM manufacturing, and US construction spending.EURUSD - Technical charts in detail
GBPUSD – technical overview
The market continues to be exceptionally well supported on dips below 1.2000. Unless we see a monthly close below 1.2000, we expect this to continue to be the case. Look for this latest break back above 1.2200 to strengthen the case for the establishment of a meaningful base.GBPUSD – fundamental overview
UK net consumer credit soared by GBP 1.8 billion in June, way above the GBP 1 billion forecast. This in conjunction with broad based selling of the US Dollar into month end, helped to fuel gains in the Pound to one-month highs against the Buck. Key standouts on Monday’s calendar come from German retail sales, German PMI reads, Eurozone and UK PMI reads, Eurozone unemployment, US ISM manufacturing, and US construction spending.USDJPY – technical overview
Technical studies are in the process of unwinding, with scope for additional correction in the days and weeks ahead. Look for additional upside from here to be well capped. Next key support comes in at 131.49.USDJPY – fundamental overview
We've seen some demand for the Yen in recent sessions. Most of this price action comes from position adjusting from shorter-term accounts following a massive decline in the Yen. There has also been a round of position adjusting in favor of the Yen on hotter Japan inflation data, and as the market reprices Fed rate hike expectations in the aftermath of last week's FOMC decision and softer US GDP. Key standouts on Monday’s calendar come from German retail sales, German PMI reads, Eurozone and UK PMI reads, Eurozone unemployment, US ISM manufacturing, and US construction spending.AUDUSD – technical overview
Overall pressure remains on the downside and conditions remain quite choppy. A break back above 0.7070 would be required at a minimum to take the immediate pressure off the downside. Until then, scope exists for deeper setbacks towards 0.6500.AUDUSD – fundamental overview
The Australian Dollar has been better bid in recent sessions, getting most of its boost from the recovery in US equities on the back of a repricing of Fed expectations. we did however see some Aussie selling on Friday after US PCE reads came in above forecast. Key standouts on Monday’s calendar come from German retail sales, German PMI reads, Eurozone and UK PMI reads, Eurozone unemployment, US ISM manufacturing, and US construction spending.USDCAD – technical overview
A recent surge back above 1.3000 signals an end to a period of bearish consolidation and suggests the market is in the process of carving out a more significant longer-term base. Next key resistance now comes in up into the 1.3500 area. Setbacks should be very well supported down into the 1.2500 area.USDCAD – fundamental overview
The latest round of support for the Canadian Dollar has come from higher oil and better than expected Canada GDP. At the same time, Friday's rise in US PCE was enough to offset a lot of the momentum for the Canadian Dollar. Key standouts on Monday’s calendar come from German retail sales, German PMI reads, Eurozone and UK PMI reads, Eurozone unemployment, US ISM manufacturing, and US construction spending.NZDUSD – technical overview
Overall pressure remains on the downside and conditions remain quite choppy. A break back above 0.6400 would be required to force a shift in the structure and suggest we are seeing a more significant bullish reversal. Until then, scope exists for fresh yearly lows and a retest of the major psychological barrier at 0.6000.NZDUSD – fundamental overview
The New Zealand Dollar has been better bid of late, getting help from US Dollar outflows and a US equities recovery post FOMC decision and softer US GDP. We've also seen demand from better than expected New Zealand data, the latest of which a rebound in New Zealand consumer confidence. Key standouts on Monday’s calendar come from German retail sales, German PMI reads, Eurozone and UK PMI reads, Eurozone unemployment, US ISM manufacturing, and US construction spending.US SPX 500 – technical overview
Longer-term technical studies are in the process of unwinding from extended readings off record highs. Look for rallies to be well capped in favor of lower tops and lower lows. Back above 4,206 will be required at a minimum to take the immediate pressure off the downside. Next major support comes in around 3,400.US SPX 500 – fundamental overview
We've finally reached a point in the cycle where the Fed recognizes unanchored inflation expectations pose a greater downside risk than over-tightening. This is significant, as it means less investor friendly monetary policy that risks potential recession in the months ahead. And so, naturally, stocks have been under intense pressure in 2022.GOLD (SPOT) – technical overview
The 2019 breakout above the 2016 high at 1375 was a significant development, opening the door for fresh record highs. Setbacks should now be well supported above 1700 on a monthly close basis.GOLD (SPOT) – fundamental overview
The yellow metal continues to be well supported on dips with solid demand from medium and longer-term accounts. These players are more concerned about inflation risk and a less upbeat global growth outlook. All of this should keep the commodity well supported, with many market participants also fleeing to the hard asset as the grand dichotomy of record high equities and record low yields comes to an unnerving climax.