


Today’s report: No signs of Fed Pivot
US economic data has been looking relatively solid, all while the Fed continues to dispel notions of the central bank being close to any pivot on policy.
Wake-up call
- Energy relief
- Market reconsiders
- still weak
- investor appetite
- Economic data
- business confidence
- Inflation headache
- Dealers report
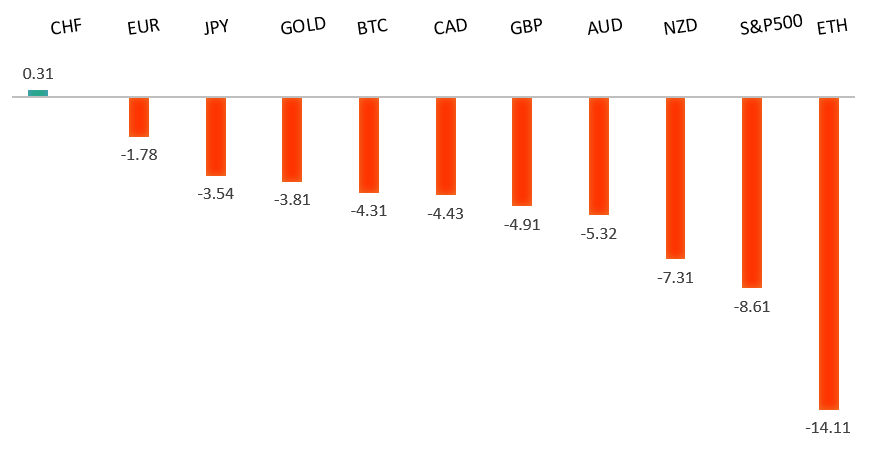
Peformance chart: 30 Day Performance vs. US dollar (%)
Suggested reading
- The Stock Market No Longer Has History on Its Side, A. Brown, Bloomberg (September 29, 2022)
- Brazil: A Nation Divided, B. Marino,Financial Times (September 29, 2022)
Chart talk: Technical & fundamental highlights
Choose pair:
EURUSD – technical overview
The market has come under intense pressure in recent months, with setbacks accelerating below parity. The next major support level comes in the form of the psychological barrier at 0.9000. At the same time, technical studies are turning up from oversold territory, suggesting additional setbacks should be limited in favour of some form of a meaningful base. Back above parity will take the immediate pressure off the downside.EURUSD – fundamental overview
The Euro has benefitted from the news of an energy relief plan out of Germany, while also getting a prop on hotter inflation data out of Germany and Italy. Key standouts on today’s calendar come from German retail sales and unemployment, UK GDP, Eurozone unemployment and inflation, US personal income, personal spending, and core PCE, Michigan sentiment and a batch of Fed speak.EURUSD - Technical charts in detail
GBPUSD – technical overview
The downtrend has been intense, with the market collapsing to a fresh record low after taking out the previous record low from 1985 earlier this week. The next major barrier below comes in at parity, though technical studies are unwinding from severe overextension, suggesting some form of a meaningful bottom could be in place. Back above 1.1274 will strengthen the recovery outlook.GBPUSD – fundamental overview
We saw a big rebound in the Pound on Thursday, this with the market feeling better about the elimination of systemic risk following BOE QE action. And though the BOE move was on net bearish Sterling, the fact that the operation was small in size and duration and the fact that the BOE is still expected to hike rates going forward, had the market reconsidering overly bearish bets on the Pound. That being said, there is still plenty of uncertainty around the impact of government tax cut and spending plans. Key standouts on today’s calendar come from German retail sales and unemployment, UK GDP, Eurozone unemployment and inflation, US personal income, personal spending, and core PCE, Michigan sentiment and a batch of Fed speak.USDJPY – technical overview
Technical studies are looking quite stretched on the longer-term chart, warning of consolidation and correction in the days and weeks ahead. Look for additional upside from here to be well capped into the 145.00 area. Next key support comes in at 140.35.USDJPY – fundamental overview
The Yen sits just off multi-year low levels and back around pre-intervention levels, despite the BOJ's aggressive attempts to force a reversal of flow earlier this month. Key standouts on today’s calendar come from German retail sales and unemployment, UK GDP, Eurozone unemployment and inflation, US personal income, personal spending, and core PCE, Michigan sentiment and a batch of Fed speak.AUDUSD – technical overview
Overall pressure remains on the downside with the market confined to a well defined downtrend. A break back above 0.6682 would be required to take the pressure off the downside. Until then, scope exists for deeper setbacks towards 0.6000.AUDUSD – fundamental overview
The Australian Dollar has managed to recover out from Wednesday's multi-month low, getting help from a round of profit taking on long US Dollar exposure. However, with global risk sentiment still in question, risk remains for renewed declines into rallies. Key standouts on today’s calendar come from German retail sales and unemployment, UK GDP, Eurozone unemployment and inflation, US personal income, personal spending, and core PCE, Michigan sentiment and a batch of Fed speak.USDCAD – technical overview
A recent surge back above 1.3000 signals an end to a period of bearish consolidation and suggests the market is in the process of carving out a more significant longer-term base. Next key resistance now comes in up into the 1.4000 area. Setbacks should be very well supported down into the 1.3000 area.USDCAD – fundamental overview
On Thursday, Canada GDP came in slightly better than forecast, though average weekly earnings slid considerably from the previous print. For the most part however, economic data is taking a back seat to broader global sentiment, with the Loonie correlating well with investor appetite or lack thereof. Key standouts on today’s calendar come from German retail sales and unemployment, UK GDP, Eurozone unemployment and inflation, US personal income, personal spending, and core PCE, Michigan sentiment and a batch of Fed speak.NZDUSD – technical overview
Overall pressure remains on the downside with the focus on a retest of the critical low from 2020 at 0.5469. A break back above 0.5755 would be required to take the immediate pressure off the downside.NZDUSD – fundamental overview
A rebound in ANZ business confidence and some broad based profit taking on US Dollar long positions have allowed the New Zealand Dollar to recover out from this week's yearly and multi-month low. However, the currency is mostly tracking with risk sentiment, which continues to deteriorate, pointing to further weakness in the exchange rate. Key standouts on today’s calendar come from German retail sales and unemployment, UK GDP, Eurozone unemployment and inflation, US personal income, personal spending, and core PCE, Michigan sentiment and a batch of Fed speak.US SPX 500 – technical overview
Longer-term technical studies are in the process of unwinding from extended readings off record highs. Look for rallies to be well capped in favor of lower tops and lower lows. Back above 3922 will be required at a minimum to take the immediate pressure off the downside. Next major support comes in around 3200.US SPX 500 – fundamental overview
We've finally reached a point in the cycle where the Fed recognizes unanchored inflation expectations pose a greater downside risk than over-tightening. This is significant, as it means less investor friendly monetary policy that risks potential recession in the months ahead. Overall, we expect inflation to continue to be a problem in 2022 that results in downside pressure into rallies.GOLD (SPOT) – technical overview
The 2019 breakout above the 2016 high at 1375 was a significant development, opening the door for fresh record highs. Setbacks should now be well supported above 1600 on a monthly close basis ahead of the next major upside extension.GOLD (SPOT) – fundamental overview
The yellow metal continues to be well supported on dips with solid demand from medium and longer-term accounts. These players are more concerned about inflation risk and a less upbeat global growth outlook. All of this should keep the commodity well supported, with many market participants also fleeing to the hard asset as the grand dichotomy of record high equities and record low yields comes to an unnerving climax.