


Special report: FOMC decision preview
Today’s report: Fed pivot bets hold up into big day
We had seen some market jitters on Tuesday, before all of that quickly went away and we were right back to risk on flow. Today is a big day with the FOMC event risk upon us, and as things stand, investors have been mostly comfortable to make bets around pricing in a Fed pivot.
Wake-up call
- GDP beats
- mortgage approvals
- FOMC risk
- sentiment uptick
- Commodities storm
- Q4 employment
- Inflation headache
- Dealers report
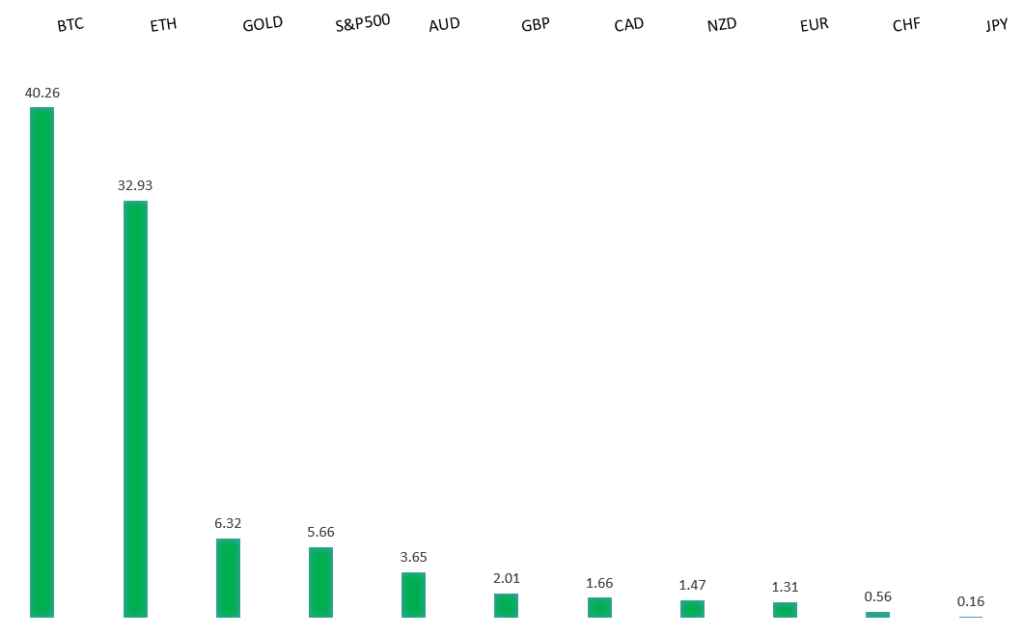
Peformance chart: 30 Day Performance vs. US dollar (%)
Suggested reading
- Powell Needs to Put on His Hawk Costume and Snarl, J. Authers, Bloomberg (February 1, 2023)
- How the buyout of Morrisons turned into a costly blunder, R. Smith, FT (January 26, 2023)
Chart talk: Technical & fundamental highlights
Choose pair:
EURUSD – technical overview
The Euro recovery has finally run back above meaningful previous support turned resistance at 1.0635. The December close above this level further encourages the recovery outlook and makes a stronger case for the formation of a longer-term bottom. Any setbacks should now be well supported ahead of 1.0300. Next major resistance at 1.1000.EURUSD – fundamental overview
The Euro has been well supported into dips on local GDP beats and renewed US Dollar selling. Both the Eurozone and France managed to avoid negative GDP prints. Meanwhile, France inflation data also ticked back to the topside. Softer German data had weighed earlier on in Tuesday trade. Key standouts on Wednesday’s calendar come from German, Eurozone, and UK manufacturing PMIs, Eurozone unemployment, Eurozone inflation, Canada manufacturing PMIs, US ISM manufacturing, US JOLTS job openings, US construction spending, and the Fed decision late in the day.EURUSD - Technical charts in detail
GBPUSD – technical overview
Signs have emerged of the market wanting to put in a longer-term base after collapsing to a record low in September. The latest weekly close back above the September high at 1.1739 strengthens this prospect. Any setbacks should now be well supported ahead of 1.1500. Next key resistance comes in at 1.2668.GBPUSD – fundamental overview
The Pound was an underperformer on Tuesday as UK mortgage approvals crashed. Key standouts on Wednesday’s calendar come from German, Eurozone, and UK manufacturing PMIs, Eurozone unemployment, Eurozone inflation, Canada manufacturing PMIs, US ISM manufacturing, US JOLTS job openings, US construction spending, and the Fed decision late in the day.USDJPY – technical overview
The major pair has been in the throes of a long overdue correction that was waiting to play out after a parabolic run to the topside to multi-year highs. At this stage, the correction could be getting close to having played out fully, with the market finally approaching critical previous resistance turned support in the 125.00 area.USDJPY – fundamental overview
The Yen has been confined to a narrow range, trading mostly on yield differentials and positioning into today's FOMC event risk. Key standouts on Wednesday’s calendar come from German, Eurozone, and UK manufacturing PMIs, Eurozone unemployment, Eurozone inflation, Canada manufacturing PMIs, US ISM manufacturing, US JOLTS job openings, US construction spending, and the Fed decision late in the day.AUDUSD – technical overview
There are signs of the potential formation of a longer-term base following the recent surge back above 0.6500. The recent weekly close back above previous support now turned resistance at 0.6682 strengthens the outlook for a bullish structural shift. Next key resistance comes in at 0.7284.AUDUSD – fundamental overview
The Australian Dollar had taken a big hit on Tuesday's discouraging Aussie retail sales showing before recovering on rallying US equities and commodities prices. Key standouts on Wednesday’s calendar come from German, Eurozone, and UK manufacturing PMIs, Eurozone unemployment, Eurozone inflation, Canada manufacturing PMIs, US ISM manufacturing, US JOLTS job openings, US construction spending, and the Fed decision late in the day.USDCAD – technical overview
A recent surge back above 1.3000 signals an end to a period of bearish consolidation and suggests the market is in the process of carving out a more significant longer-term base. Next key resistance now comes in up into the 1.4000 area. Setbacks should be very well supported down into the 1.3000 area.USDCAD – fundamental overview
Canada GDP came in pretty much as expected and commodities rallied back, which all contributed to a recovery in the Canadian Dollar. Key standouts on Wednesday’s calendar come from German, Eurozone, and UK manufacturing PMIs, Eurozone unemployment, Eurozone inflation, Canada manufacturing PMIs, US ISM manufacturing, US JOLTS job openings, US construction spending, and the Fed decision late in the day.NZDUSD – technical overview
Overall pressure remains on the downside with risk for the current recovery rally to stall out and form a lower top for the next major downside extension. A break back above 0.6577 would be required to take the immediate pressure off the downside.NZDUSD – fundamental overview
The New Zealand Dollar has come under some pressure this week on the back of a further decline in New Zealand house prices and softening Q4 employment data. Key standouts on Wednesday’s calendar come from German, Eurozone, and UK manufacturing PMIs, Eurozone unemployment, Eurozone inflation, Canada manufacturing PMIs, US ISM manufacturing, US JOLTS job openings, US construction spending, and the Fed decision late in the day.US SPX 500 – technical overview
Longer-term technical studies are in the process of unwinding from extended readings off record highs. Look for rallies to be well capped in favor of lower tops and lower lows. A monthly close back above 4300 will be required at a minimum to take the immediate pressure off the downside. Next major support comes in at 3492.US SPX 500 – fundamental overview
We've finally reached a point in the cycle where the Fed recognizes unanchored inflation expectations pose a greater downside risk than over-tightening. This is significant, as it means less investor friendly monetary policy that risks potential recession in the months ahead. Overall, we expect inflation to continue to be a problem in H1 2023 that results in downside pressure into rallies.GOLD (SPOT) – technical overview
The 2019 breakout above the 2016 high at 1375 was a significant development, opening the door for fresh record highs. Setbacks should now be well supported above 1600 on a monthly close basis ahead of the next major upside extension. The recent break back above 1808 strengthens the bullish outlook. Next major resistance comes in at 2000.GOLD (SPOT) – fundamental overview
The yellow metal continues to be well supported on dips with solid demand from medium and longer-term accounts. These players are more concerned about inflation risk and a less upbeat global growth outlook. All of this should keep the commodity well supported, with many market participants also fleeing to the hard asset as the grand dichotomy of record high equities and record low yields comes to an unnerving climax.