


Today’s report: Positioning into Friday event risk
There haven’t exactly been any signs out there to support this latest mild recovery in risk assets into the end of the week. Higher for longer Fed policy should still be a thing, and economic data out of Europe and the UK was not pretty on Thursday.
Wake-up call
- ECB Villeroy
- construction PMIs
- MOF action
- Aussie exports
- employment report
- export prices
- Policy outlook
- Dealers report
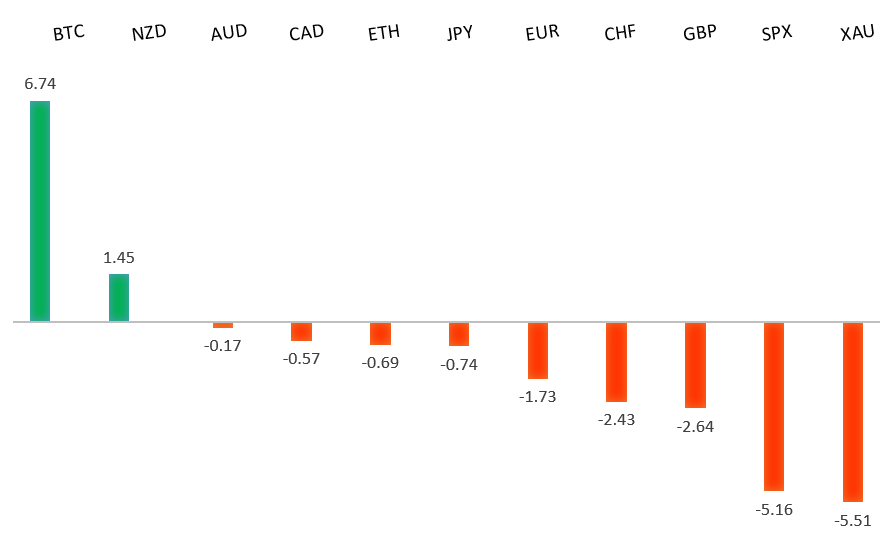
Peformance chart: 30 Day Performance vs. US dollar (%)
Suggested reading
- How To Know Gold Isn't Doing Well? Few Are Talking About It, Fisher Investments (October w, 2023)
- The Data Security Concerns Around TikTok, C. Criddle, Financial Times (October 5, 2023)
Chart talk: Technical & fundamental highlights
Choose pair:
EURUSD – technical overview
Any additional setbacks should be well supported on dips below 1.0500 in favor of the start to the next major upside extension. Ultimately, only a monthly close back below 1.0500 would give reason for concern. Back above 1.0618 will take the immediate pressure off the downside.EURUSD – fundamental overview
Indeed the Euro has been in minor recovery mode in recent sessions. At the same time, the push higher has been more about a US Dollar correction than anything Euro positive. On Thursday, German trade and construction PMI data came in awful, while ECB Villeroy said there was no justification for rate increases. Key standouts on Friday’s calendar come from German factory orders, the Canada employment report, and the US employment report.EURUSD - Technical charts in detail
GBPUSD – technical overview
Signs have emerged of the market wanting to put in a longer-term base after collapsing to a record low in September 2022. The November 2022 monthly close back above 1.2000 strengthens this prospect. Any setbacks should now be well supported ahead of 1.2000. Next key resistance comes in at 1.3143.GBPUSD – fundamental overview
As was the case with the Euro, the Pound was also up on Thursday on broad based US Dollar selling. Data and news out of the UK was not GBP supportive. UK Metro Bank was out attempting a capital raise, while UK construction PMIs plunged to a post-pandemic low. Key standouts on Friday’s calendar come from German factory orders, the Canada employment report, and the US employment report.USDJPY – technical overview
At this stage, it looks like the market is wanting to resume the bigger picture uptrend and head back towards a retest of that multi-year high from October 2022 up at 151.95. Look for any weakness to continue to be well supported on dips.USDJPY – fundamental overview
The Yen has entered a tight range trade after some whipsaw volatility earlier in the week on still unsubstantiated chatter around MOF intervention. Nevertheless, the market has been less inclined to sell Yen aggressively right now on fear of a second round of MOF action. Key standouts on Friday’s calendar come from German factory orders, the Canada employment report, and the US employment report.AUDUSD – technical overview
There are signs of the potential formation of a longer-term base with the market trading down into a meaningful longer-term support zone. Only a monthly close below 0.6300 would give reason for rethink. Back above 0.6523 will take the immediate pressure off the downside and strengthen case for a bottom.AUDUSD – fundamental overview
The Australian Dollar has been getting help from a broad selloff in the US Dollar, recovery in equities, and solid local data. Aussie exports data was decent, while retail sales came in as expected. Key standouts on Friday’s calendar come from German factory orders, the Canada employment report, and the US employment report.USDCAD – technical overview
Above 1.3000 signals an end to a period of longer-term bearish consolidation and suggests the market is in the process of carving out a more significant longer-term base. Next key resistance now comes in up into the 1.4000 area. Setbacks should be very well supported down into the 1.3000 area.USDCAD – fundamental overview
The Canadian Dollar has been a relative underperformer in recent sessions, taking a hit on slumping oil and a dip in Canada Ivey PMIs. Key standouts on Friday’s calendar come from German factory orders, the Canada employment report, and the US employment report.NZDUSD – technical overview
Overall pressure remains on the downside with the market once again stalling out on a run up into the 0.6500 area. Ultimately, a break back above 0.6049 would be required to take the immediate pressure off the downside. A monthly close below 0.5900 would intensify bearish price action.NZDUSD – fundamental overview
ANZ Commodity Export Prices were up 1.3% in September, matching the quickest pace since March 2022. This, along with a recovery in risk assets have helped to fuel this latest recovery in the New Zealand Dollar. Key standouts on Friday’s calendar come from German factory orders, the Canada employment report, and the US employment report.US SPX 500 – technical overview
Longer-term technical studies are in the process of unwinding from extended readings off record highs. Look for rallies to be well capped in favor of lower tops and lower lows. A monthly close back above 4600 will be required to take the immediate pressure off the downside. Next key support comes in at 4200.US SPX 500 – fundamental overview
We've finally reached a point in the cycle where the Fed recognizes unanchored inflation expectations pose a greater downside risk than over-tightening. This is significant, as it means less investor friendly monetary policy, especially with the growth outlook looking up in recent months. Overall, we expect inflation to continue to be a problem in 2023 that results in downside pressure into rallies despite market expectations that would argue otherwise.GOLD (SPOT) – technical overview
The 2019 breakout above the 2016 high at 1375 was a significant development, opening the door for fresh record highs. Setbacks should now be well supported above 1600 on a monthly close basis ahead of the next major upside extension. Next major resistance comes in at 2100, above which opens the next extension towards 2500.GOLD (SPOT) – fundamental overview
The yellow metal continues to be well supported on dips with solid demand from medium and longer-term accounts. These players are more concerned about inflation risk and a less upbeat global growth outlook. All of this should keep the commodity well supported, with many market participants also fleeing to the hard asset as the grand dichotomy of record high equities and record low yields comes to an unnerving climax.