


Next 24 hours: Flight to safety in unsettling start to week
Today’s report: Weekend attack fuels geopolitical tension
The world starts the new week in a different place than where it was as things closed out in the previous week. Geopolitical tension has ramped up significantly on the back of the Hamas attack on Israel, and the market is now concerned how this could blow-up into a much bigger risk.
Wake-up call
- industrial production
- housing data
- Japan earnings
- opposing flow
- Upbeat jobs
- both directions
- Policy outlook
- Dealers report
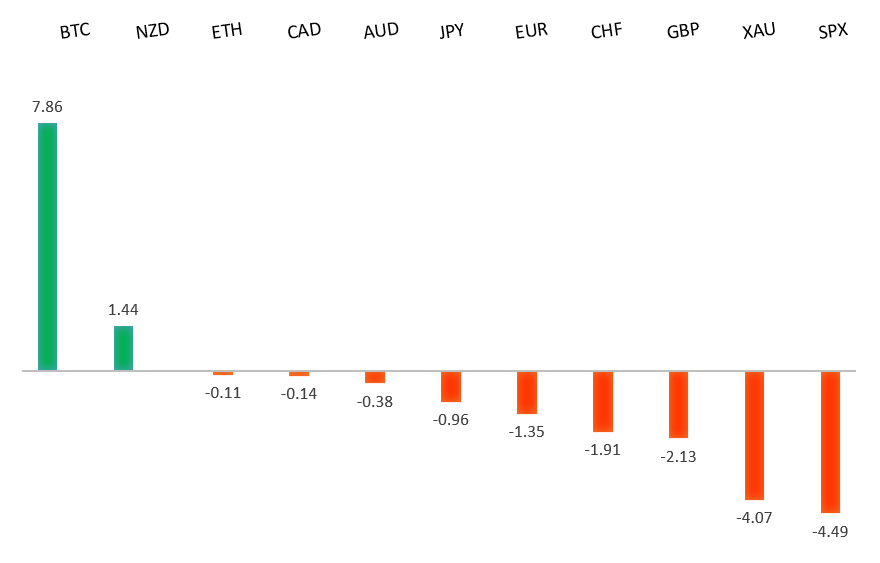
Peformance chart: 30 Day Performance vs. US dollar (%)
Suggested reading
- China Isn't Shifting Away From the Dollar, B. Setser, CFR (October 3, 2023)
- The Data Security Concerns Around TikTok, C. Criddle, Financial Times (October 5, 2023)
Chart talk: Technical & fundamental highlights
Choose pair:
EURUSD – technical overview
Any additional setbacks should be well supported on dips below 1.0500 in favor of the start to the next major upside extension. Ultimately, only a monthly close back below 1.0500 would give reason for concern. Back above 1.0618 will take the immediate pressure off the downside.EURUSD – fundamental overview
The Euro got a boost on Friday from upbeat German factory orders data, though upside was tempered on a strong US jobs report which has increased odds for a November Fed hike. Key standouts on Monday’s calendar come from German industrial production, and a batch of Fed speak from the likes of Logan, Barr, and Jefferson.EURUSD - Technical charts in detail
GBPUSD – technical overview
Signs have emerged of the market wanting to put in a longer-term base after collapsing to a record low in September 2022. The November 2022 monthly close back above 1.2000 strengthens this prospect. Any setbacks should now be well supported ahead of 1.2000. Next key resistance comes in at 1.3143.GBPUSD – fundamental overview
The Pound managed to consolidate recent gains despite dreadful UK housing data, with the currency mostly tracking along with broader flows. Upside was however capped after a strong US jobs report which increased the odds for a November rate hike from the Fed. Key standouts on Monday’s calendar come from German industrial production, and a batch of Fed speak from the likes of Logan, Barr, and Jefferson.USDJPY – technical overview
At this stage, it looks like the market is wanting to resume the bigger picture uptrend and head back towards a retest of that multi-year high from October 2022 up at 151.95. Look for any weakness to continue to be well supported on dips.USDJPY – fundamental overview
August earnings put in a notable decline in Japan for the month of August which opened renewed downside in the Yen. The bearish Yen price action kept up as yield differentials swung further in the Dollar's favor after an upbeat US jobs report. Key standouts on Monday’s calendar come from German industrial production, and a batch of Fed speak from the likes of Logan, Barr, and Jefferson.AUDUSD – technical overview
There are signs of the potential formation of a longer-term base with the market trading down into a meaningful longer-term support zone. Only a monthly close below 0.6300 would give reason for rethink. Back above 0.6523 will take the immediate pressure off the downside and strengthen case for a bottom.AUDUSD – fundamental overview
The Australian Dollar hasn't been sure about direction as the week gets going. On the one side, there has been support for the currency on rallying commodities prices. On the other side, risk off flow on geopolitical concerns has been offsetting. Key standouts on Monday’s calendar come from German industrial production, and a batch of Fed speak from the likes of Logan, Barr, and Jefferson.USDCAD – technical overview
Above 1.3000 signals an end to a period of longer-term bearish consolidation and suggests the market is in the process of carving out a more significant longer-term base. Next key resistance now comes in up into the 1.4000 area. Setbacks should be very well supported down into the 1.3000 area.USDCAD – fundamental overview
The Canadian Dollar managed to put in a solid Friday performance on the back of an impressive Canada jobs report. Meanwhile, the price of oil has jumped on rising geopolitical tension, which has helped to generate additional interest. Key standouts on Monday’s calendar come from German industrial production, and a batch of Fed speak from the likes of Logan, Barr, and Jefferson.NZDUSD – technical overview
Overall pressure remains on the downside with the market once again stalling out on a run up into the 0.6500 area. Ultimately, a break back above 0.6049 would be required to take the immediate pressure off the downside. A monthly close below 0.5900 would intensify bearish price action.NZDUSD – fundamental overview
The New Zealand Dollar hasn't been sure about directionas the week gets going. On the one side, there has been support for the currency on rallying commodities prices. On the other side, risk off flow on geopolitical concerns has been offsetting. Key standouts on Monday’s calendar come from German industrial production, and a batch of Fed speak from the likes of Logan, Barr, and Jefferson.US SPX 500 – technical overview
Longer-term technical studies are in the process of unwinding from extended readings off record highs. Look for rallies to be well capped in favor of lower tops and lower lows. A monthly close back above 4600 will be required to take the immediate pressure off the downside. Next key support comes in at 4200.US SPX 500 – fundamental overview
We've finally reached a point in the cycle where the Fed recognizes unanchored inflation expectations pose a greater downside risk than over-tightening. This is significant, as it means less investor friendly monetary policy, especially with the growth outlook looking up in recent months. Overall, we expect inflation to continue to be a problem in 2023 that results in downside pressure into rallies despite market expectations that would argue otherwise.GOLD (SPOT) – technical overview
The 2019 breakout above the 2016 high at 1375 was a significant development, opening the door for fresh record highs. Setbacks should now be well supported above 1600 on a monthly close basis ahead of the next major upside extension. Next major resistance comes in at 2100, above which opens the next extension towards 2500.GOLD (SPOT) – fundamental overview
The yellow metal continues to be well supported on dips with solid demand from medium and longer-term accounts. These players are more concerned about inflation risk and a less upbeat global growth outlook. All of this should keep the commodity well supported, with many market participants also fleeing to the hard asset as the grand dichotomy of record high equities and record low yields comes to an unnerving climax.